Schematic Diagram Maker for Lab & Experiment Setups
Make a clear, labeled schematic diagram of any experiment or lab setup. Describe your apparatus — flasks, burettes, stands, a Bunsen burner, tubing — and generate a clean, report-ready scientific schematic, then export it, free.
Schematic Diagram Maker
Free preview on this page · Clean file download needs a
Your schematic diagram will appear here
Describe the apparatus and connections for the clearest labeled result
Schematic Diagram Examples
Labeled lab and experiment setups across chemistry, biology, and physics
Distillation Apparatus
A full distillation rig — flask, column, condenser, and receiver — drawn and labeled like a lab manual.
PCR Experiment Setup
The three-step PCR cycle and its temperature profile, mapped out as a clean process schematic.
Spectrophotometer Schematic
Light source, prism, sample cuvette, and detector — the instrument shown as a labeled light path.
Electrolysis Cell
A classic electrochemistry setup with electrodes, electrolyte, and gas collection clearly labeled.
Gel Electrophoresis
Power supply, buffer tank, gel wells, and electrodes — the whole apparatus in one labeled diagram.
Telescope Optics
A reflecting telescope drawn as an optical schematic, with mirrors, eyepiece, and ray tracing.
Need a power-distribution overview with utility, transformers, buses and feeders? The Single-Line Diagram Generator includes reference examples and a symbol-convention checklist.
What is a scientific schematic diagram?
A scientific schematic diagram is a simplified, labeled drawing of an experimental setup or piece of apparatus. Instead of a photo-realistic picture, it shows each component as a clear symbol or outline, with the parts arranged the way they connect in the real experiment and every part named. The goal is clarity: anyone reading your lab report should be able to look at the schematic and understand exactly how the apparatus is assembled and how the experiment works. This maker draws that kind of diagram from a plain-English description, so you do not have to align tubing, stands, and glassware by hand.
Common lab apparatus you can include
- Glassware: beakers, conical and round-bottom flasks, test tubes, measuring cylinders, and burettes.
- Heating and support: a Bunsen burner, tripod and gauze, heating mantle, retort and clamp stands, and bosses.
- Connections: rubber or silicone tubing, delivery tubes, condensers with water flow, and stoppers.
- Measurement: thermometers, pH probes, voltmeters and ammeters, balances, and gas syringes.
- Reaction vessels: electrolysis cells, gas collection over water, distillation columns, and reflux setups.
How to make a schematic diagram from a description
- Describe your setup in plain English — name the apparatus, how the pieces connect, and what you want labeled.
- List the components in the order they appear, for example "burette on a stand above a conical flask".
- Generate the schematic; the tool draws each part as a clean component with labels and standard arrangement.
- Refine the prompt if needed — add or rename a label, adjust an aspect ratio, then download the diagram for your report.
When to use a schematic in a lab report
A schematic belongs in the method or apparatus section of a lab write-up, science report, or practical exam answer. It replaces a long paragraph describing how everything is connected — examiners and readers grasp the setup at a glance, and it makes your method reproducible. Use a labeled schematic whenever the arrangement of apparatus matters: titrations, distillations, electrolysis, gas collection, optics benches, or any multi-component setup. A clear diagram is often expected for full marks in chemistry, physics, and biology practical reports.
Schematic diagrams vs realistic drawings
A realistic drawing tries to look like the apparatus, with shading and depth, while a schematic strips it down to clean lines and symbols that emphasize how parts connect. For science reports the schematic is almost always the right choice: it is faster to read, easier to label, and focuses attention on the experimental design rather than the look of the glassware. This generator favors the clean, line-based schematic style with clear labels, so your diagram reads like one from a textbook or lab manual rather than a photograph.
Frequently Asked Questions
Related Science Tools
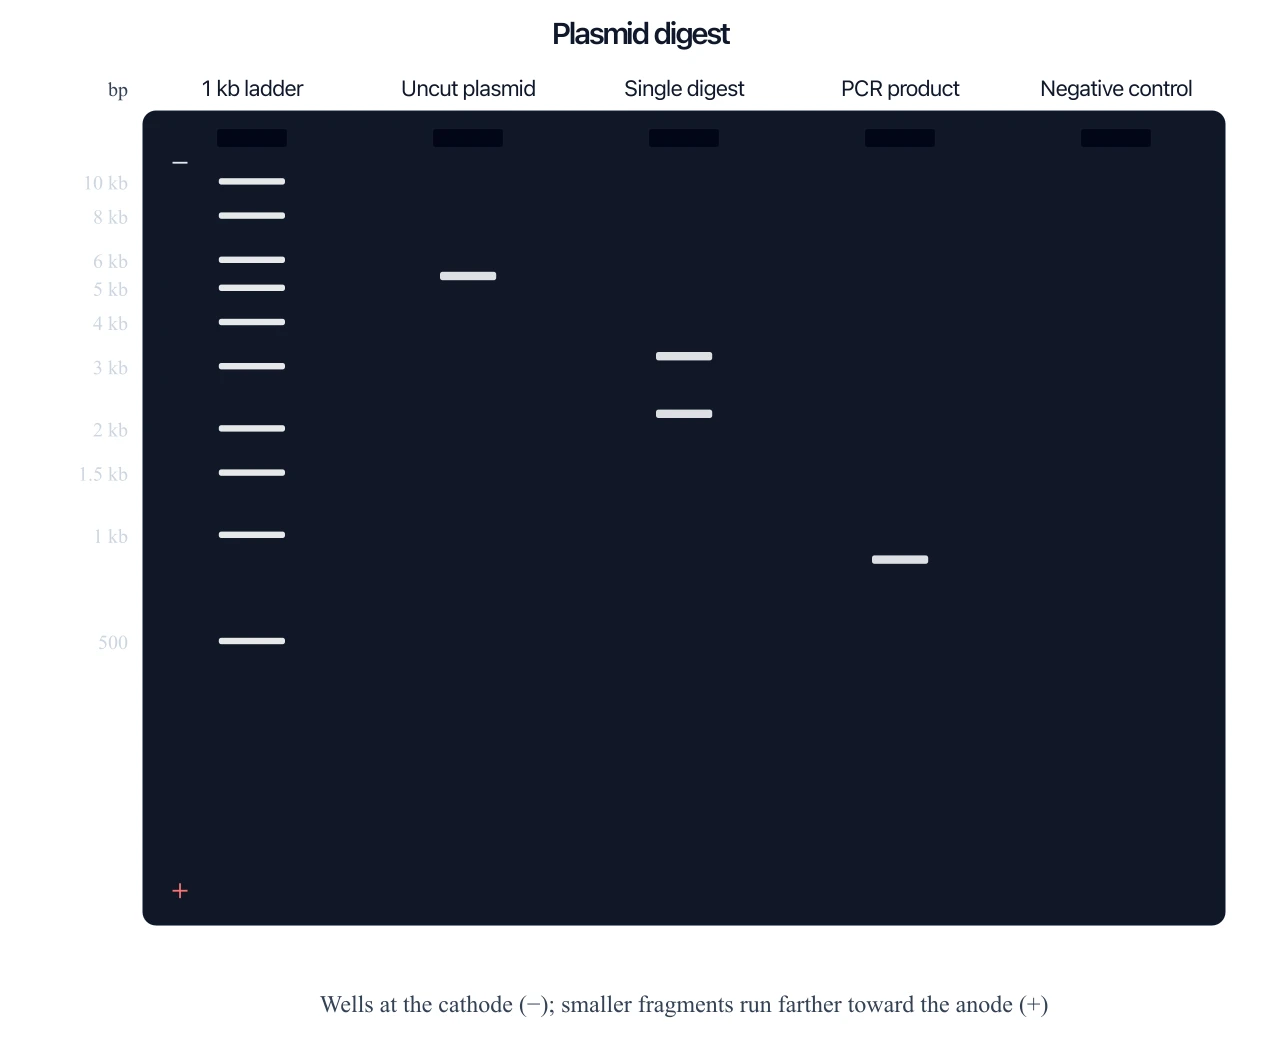 Biology
Gel Electrophoresis Diagram Generator
Need the result gel from fragment sizes, not just the apparatus? That is a separate tool.
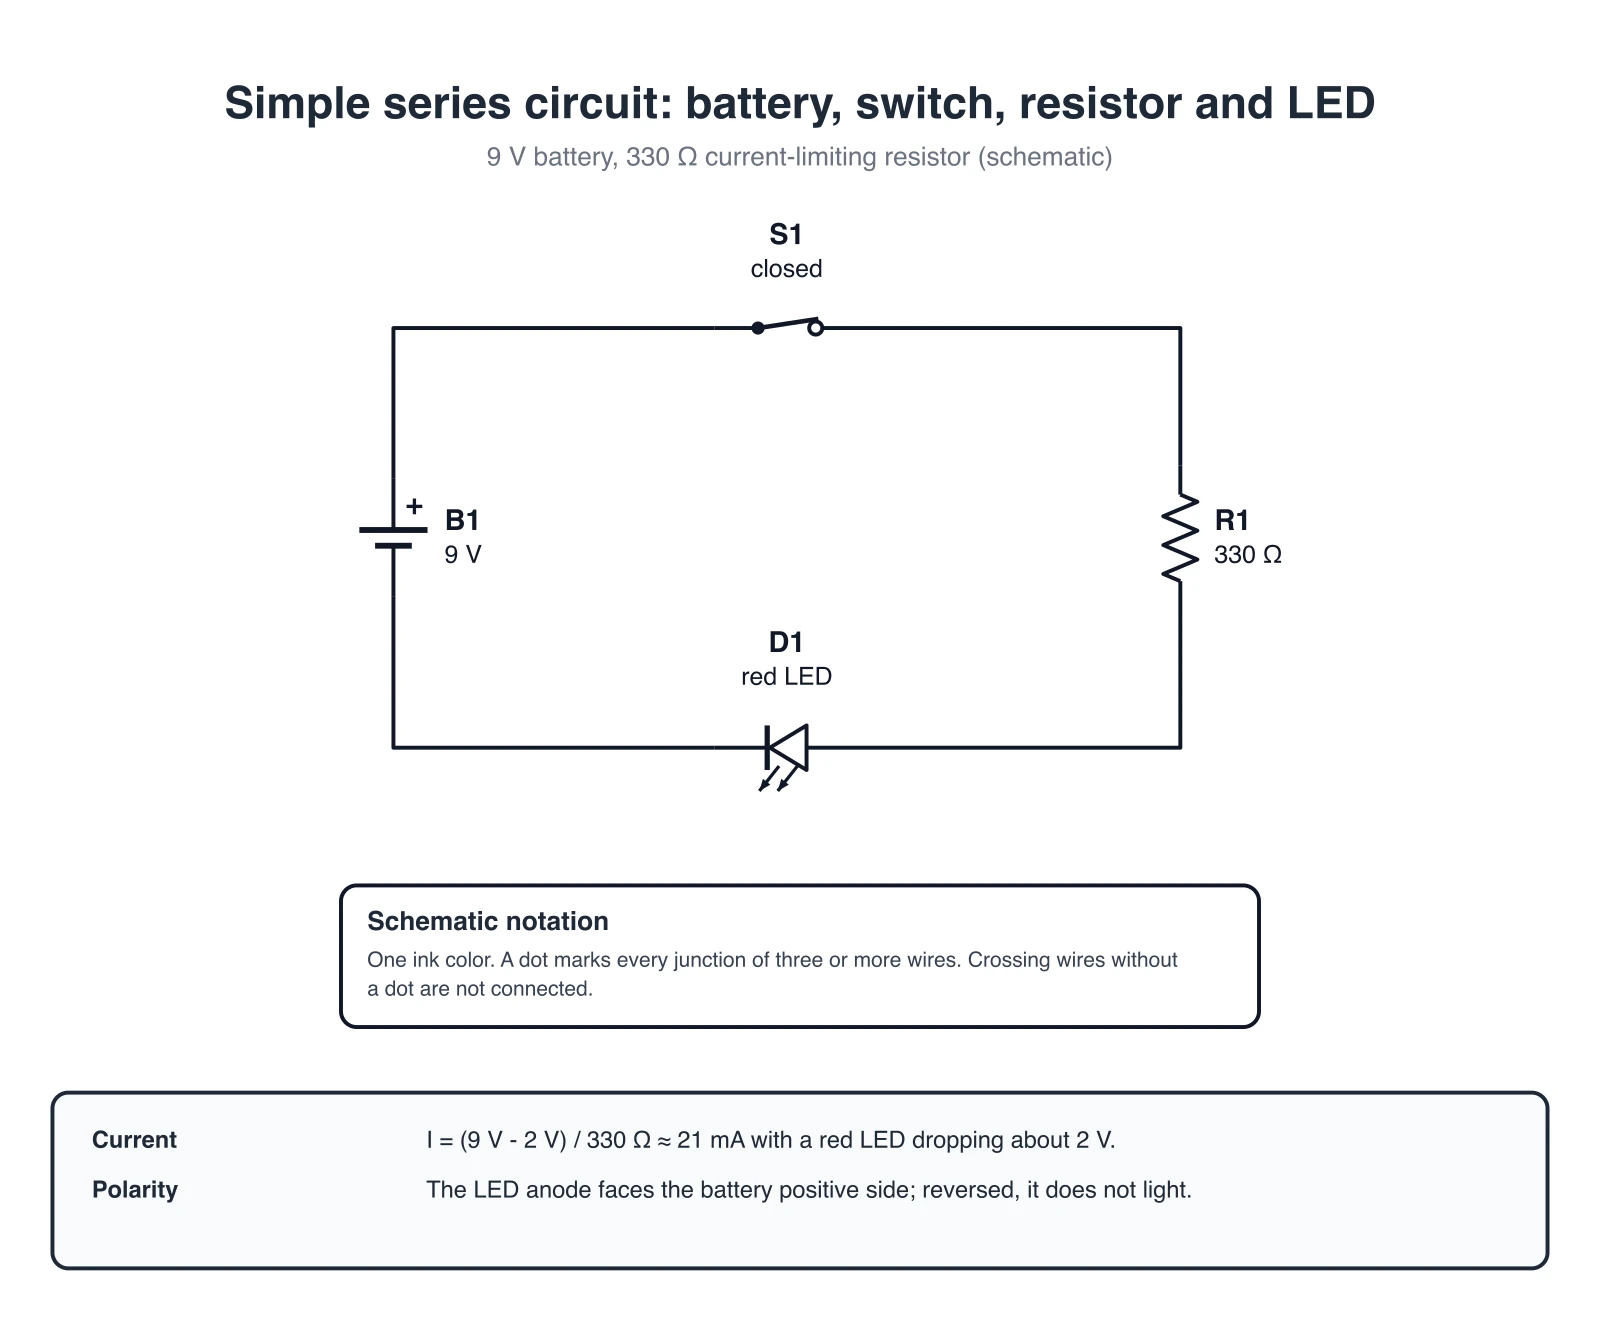 Physics
Circuit Diagram Maker
Draw electrical circuit schematics with resistors, capacitors, batteries, and standard component symbols.
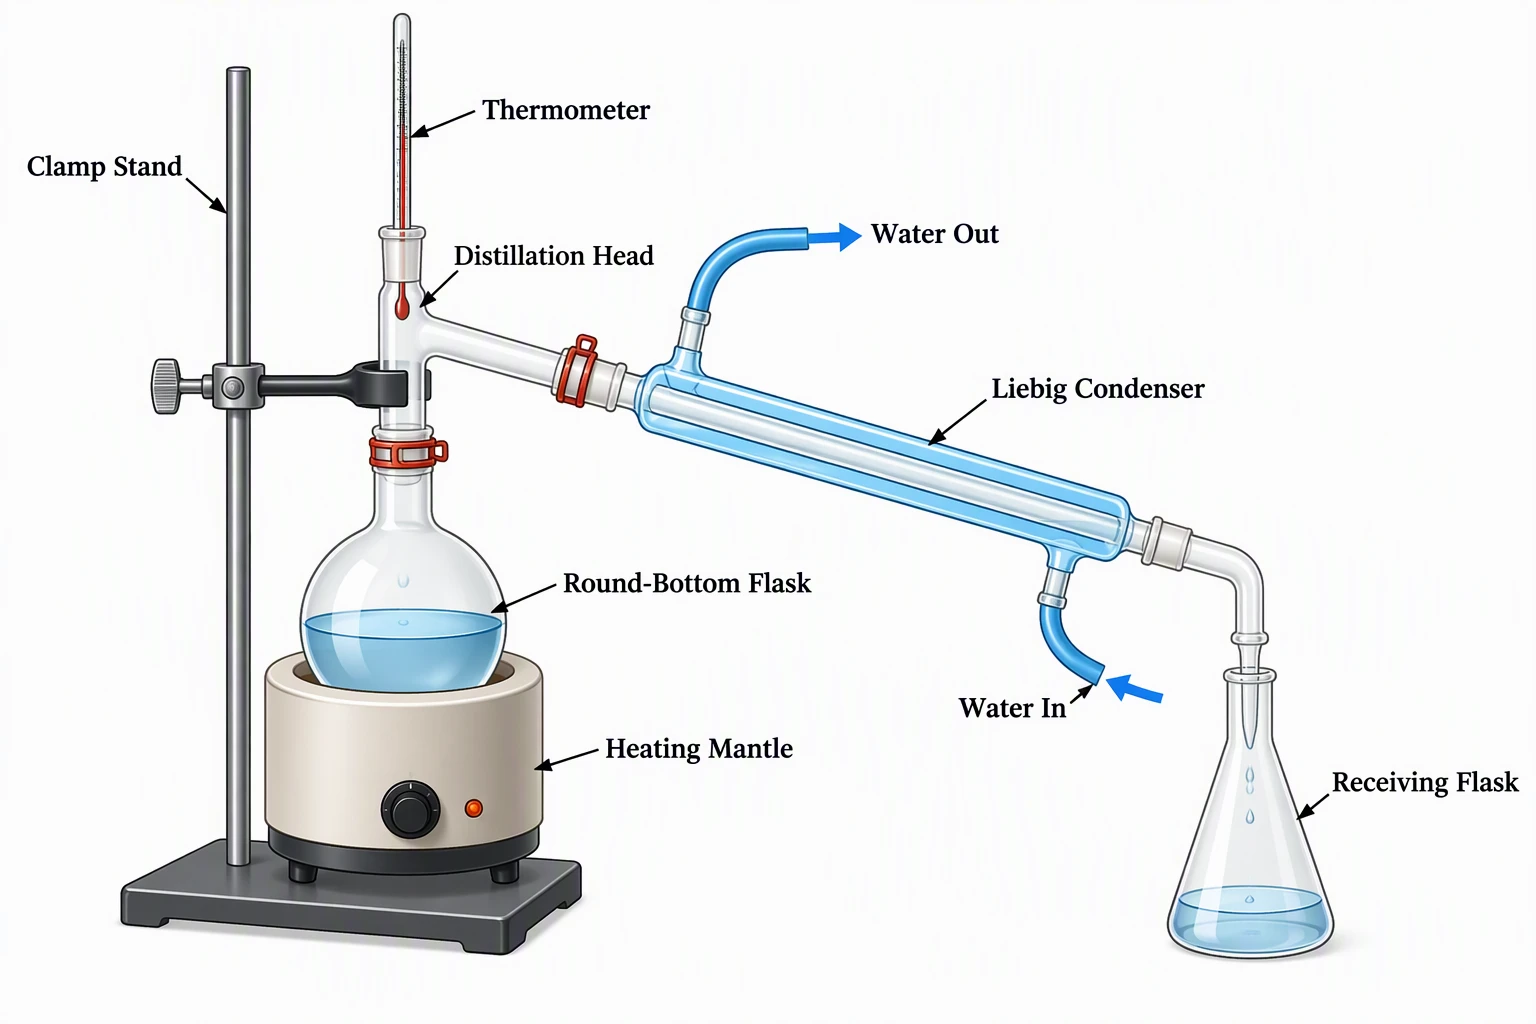 Science
Science Drawing Generator
Generate labeled science drawings of lab apparatus, biology, and physics setups for reports.
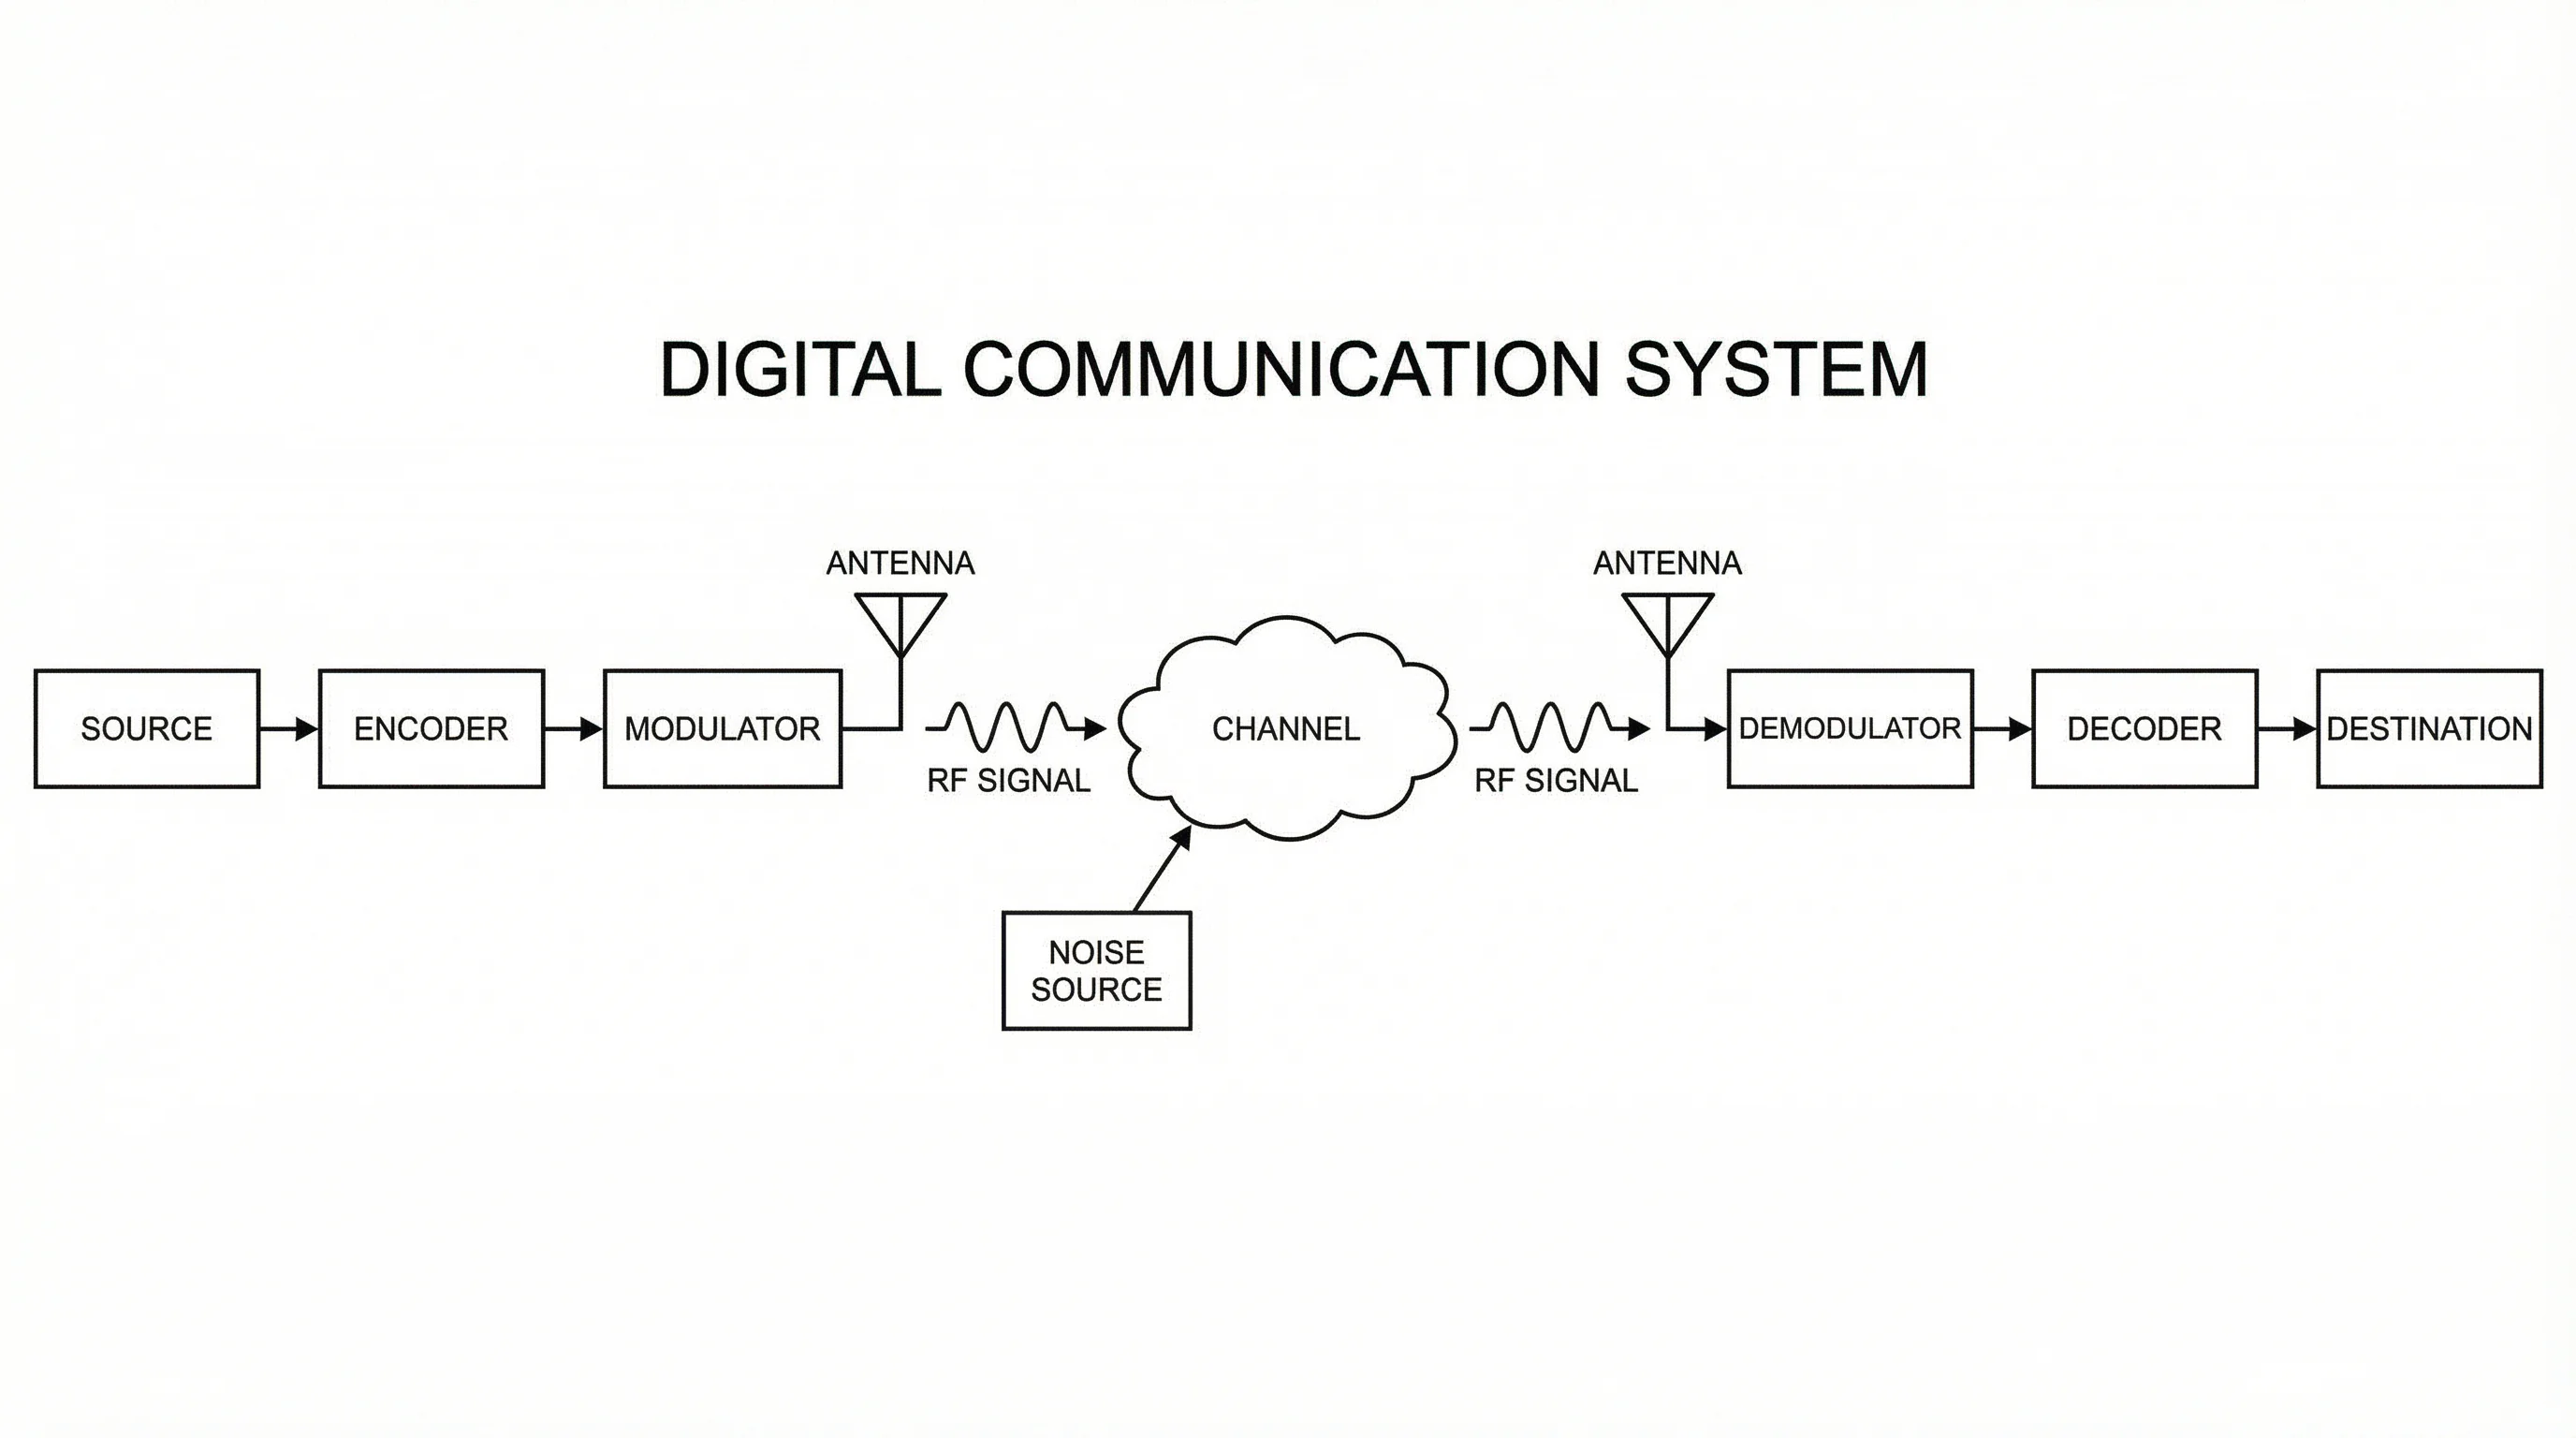 Visualization
Block Diagram Generator
Map systems and processes into clean, labeled block diagrams with connected components.