Number Needed to Treat Calculator
Enter a 2x2 table or two risks to get NNT or NNH, ARR, RRR, RR and OR with 95% confidence intervals, a forest plot and a report sentence. Free, for education.
Try an example (treated vs control)
Number needed to treat
NNT 10
Exact 1 / ARR = 10.00, rounded up to a whole person. 95% CI: NNTB 5.6 to 45.0.
| Measure | Estimate | 95% CI |
|---|---|---|
| CER (control event rate) | 25.00% | 19.51% to 31.43% |
| EER (treated event rate) | 15.00% | 10.71% to 20.61% |
| ARR (absolute risk reduction) | 10.00% | 2.22% to 17.78% |
| RRR (relative risk reduction) | 40.00% | 9.77% to 60.10% |
| RR (risk ratio) | 0.60 | 0.40 to 0.90 |
| OR (odds ratio) | 0.53 | 0.32 to 0.88 |
| NNT (number needed to treat) | 10 | NNTB 5.6 to 45.0 |
- The event is the outcome you count. If the event is a good outcome such as recovery, a negative ARR is the favorable result.
Sentence for a report
15.0% of the treated group and 25.0% of the control group had the event; ARR 10.0% (95% CI 2.2% to 17.8%); NNT 10 (95% CI NNTB 5.6 to 45.0).
For education and research use only. This is not a clinical decision tool and gives no medical advice.
From absolute risk reduction to NNT
NNT = 1 / ARR. The same relationship in a lookup, computed by the same code as the calculator.
| ARR | NNT | Fewer events per 1000 treated |
|---|---|---|
| 50.0% | 2 | 500 |
| 25.0% | 4 | 250 |
| 20.0% | 5 | 200 |
| 10.0% | 10 | 100 |
| 5.0% | 20 | 50 |
| 2.0% | 50 | 20 |
| 1.0% | 100 | 10 |
| 0.1% | 1000 | 1 |
These are arithmetic conversions, not thresholds. There is no standard NNT that counts as good or poor.
Free Number Needed to Treat Charts
Every chart below is drawn from the same code as the calculator above. View, download and print them free, no sign-up.
NNT Forest Plot: RR, OR and ARR
Treated 30/200 vs control 50/200: ARR 10.00%, NNT 10 with 95% CI NNTB 5.6 to 45.0.
Forest plots
Worked examples
How to read
To plot effects from several studies, enter each risk ratio or odds ratio with its lower and upper limit in the forest plot generator. For wording the size of a correlation (r), see the correlation coefficient interpretation page, and to test a 2×2 table for association, look up the critical value in the chi-square table. Exact tail probabilities for counts are in the binomial distribution table. This page is for education and research use only and is not a clinical decision tool.
What the number needed to treat is
The number needed to treat (NNT) is how many people would need to receive an intervention, compared with a control, for one additional person to avoid the event over a stated follow-up period. It is the reciprocal of the absolute risk reduction (ARR), so a bigger risk difference means a smaller NNT. An NNT of 1 would mean everyone treated avoids the event who would not otherwise have; an NNT that grows toward infinity means the two groups barely differ. Because it is built from one specific outcome and one time span, an NNT is always reported with both, for example "NNT 10 over 5 years for the study event".
How to calculate NNT from a 2×2 table
- Count the event in each group. The control event rate (CER) is the control events divided by the control total, and the experimental event rate (EER) is the same for the treated group. The ARR is CER − EER and NNT = 1 / ARR, rounded up to the next whole person.
- Take 30 events among 200 treated people and 50 among 200 controls. CER = 25.00%, EER = 15.00%, so ARR = 10.00% and NNT = 1 / 0.10 = 10. The relative risk is RR = 0.60 and the relative risk reduction is RRR = 1 − RR = 40%. The calculator rounds the NNT up, never down, and also shows the unrounded value, so 33.3 is reported as 34.
NNT, NNTB and NNH
When the treated group has more events than the control group, the ARR is negative and the same arithmetic gives the number needed to harm (NNH): how many people would need to be treated for one extra person to have the event. The calculator switches the label for you: 12/100 treated against 6/100 control gives an absolute risk increase of 6.00% and an NNH of 17. In confidence intervals the suffixes B and H keep the direction clear: NNTB is a number needed to treat for benefit, NNTH a number needed to treat for harm. An NNT and an NNH are therefore not the same number, even though both are reciprocals of a risk difference. The event is whatever outcome you count, so count the one the treatment is meant to prevent. If the outcome you care about is a good one such as recovery, enter the people who did not recover as the events, or read the labels with that in mind: a negative ARR is then the favorable result. This page rounds both NNT and NNH up to the next whole person; that is a page convention, and some guidelines round an NNH down.
Confidence interval for the NNT
- The NNT interval comes from the ARR interval. The calculator uses the Wald (normal approximation) interval for ARR, then takes the reciprocal of each end. When both ends of the ARR interval have the same sign this gives an ordinary range: for the example above, NNTB 5.6 to 45.0.
- When the ARR interval includes 0 the reciprocals no longer form one range, because the interval covers both a small benefit and a small harm, and 1 / 0 is infinite. Following Altman (BMJ 1998) the result is written with both sides: 10/50 against 12/50 has an ARR interval of −12.22% to 20.22% and is reported as NNTB 4.9 to ∞ to NNTH 8.2. A single range such as "−8.2 to 4.9" would wrongly imply the true NNT lies between those values. The Wald interval can be unreliable with small counts or rare events, so the calculator warns when a cell is below 5.
Why an NNT depends on baseline risk and follow-up
The same relative effect produces very different NNTs depending on how common the event is in the control group. With a relative risk reduction of 25%, a control event rate of 4% gives an NNT of 100, while a control event rate of 40% gives 10. The follow-up period matters in the same way: events accumulate over time, so an NNT over one year and an NNT over five years are different quantities and should not be compared directly. An NNT is also specific to one outcome. There is no standard cut-off for a good or bad NNT; what is acceptable depends on the outcome, the harms and the costs, which is a judgement the number cannot make for you. Use the table above to see how an absolute risk difference converts to an NNT.
Risk ratio versus odds ratio
The risk ratio (RR) compares probabilities and the odds ratio (OR) compares odds. When the event is rare they are almost the same, but when the event is common the OR moves further from 1 than the RR. With a true risk ratio of 0.5, the odds ratio is 0.49 at a 2% control event rate but 0.33 at a 50% rate. That is why reading an OR as "the risk is halved" overstates the effect for common outcomes. Report the RR and the absolute risk difference next to an OR so readers can see both.
Zero cells and small groups
If any of the four cells is 0, the RR and OR or their standard errors cannot be computed from the raw counts. The calculator then adds 0.5 to every cell for RR, OR and their intervals (Haldane-Anscombe) and says so beside the result. For 0/40 against 5/40 the corrected RR is 0.09 and the OR is 0.08, while the ARR (12.50%) and NNT (8) use the raw counts. With zero or very few events, treat all intervals as rough.
How to report an NNT
Give the NNT with its interval, the outcome and the follow-up period, and report the event rates behind it. For example: "50/200 (25%) of controls and 30/200 (15%) of treated participants had the event over 5 years; ARR 10.0%, NNT 10 (95% CI NNTB 5.6 to 45.0)." The calculator writes this sentence for you, and you can type your own follow-up period into it. This page is for education and research use only. It is not a clinical decision tool and gives no medical advice.
Frequently Asked Questions
Related Statistics Tools
 Research
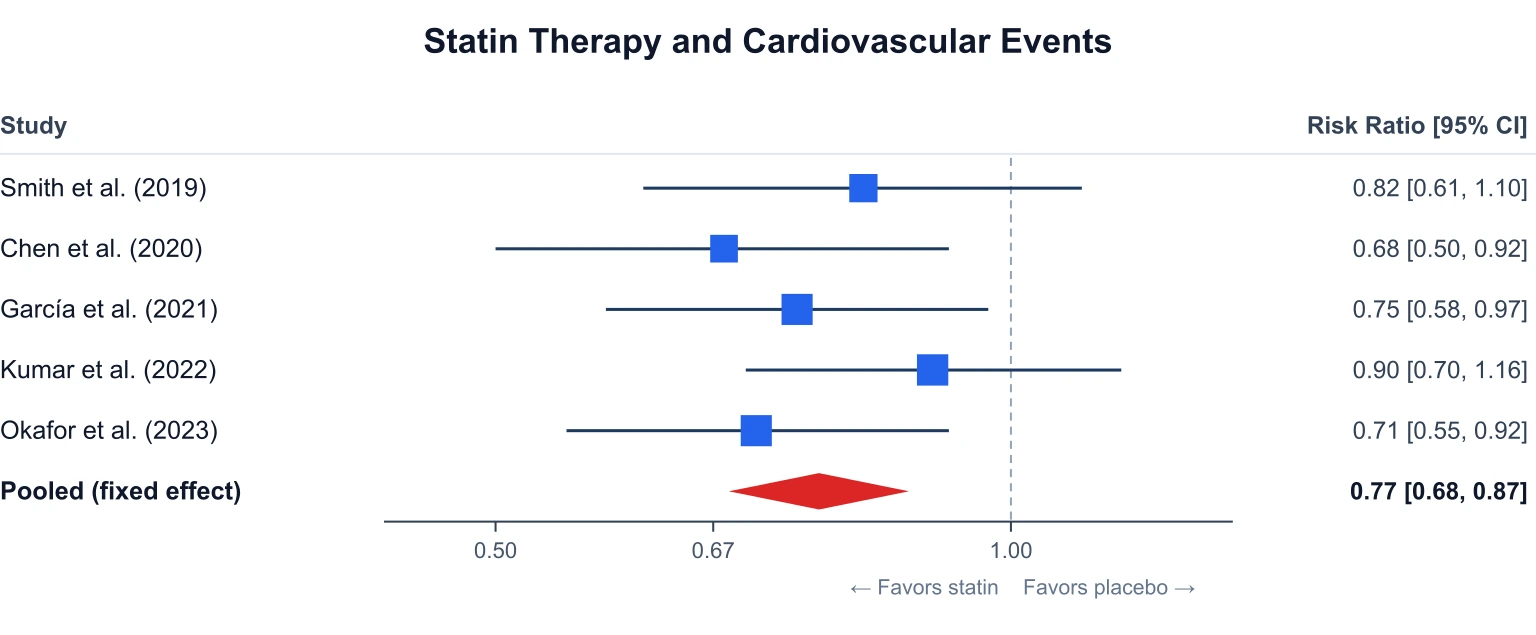
Forest Plot Generator
Create forest plots for meta-analysis: enter each study’s effect size and 95% CI, get weighted squares and a pooled diamond, export SVG.
 Research
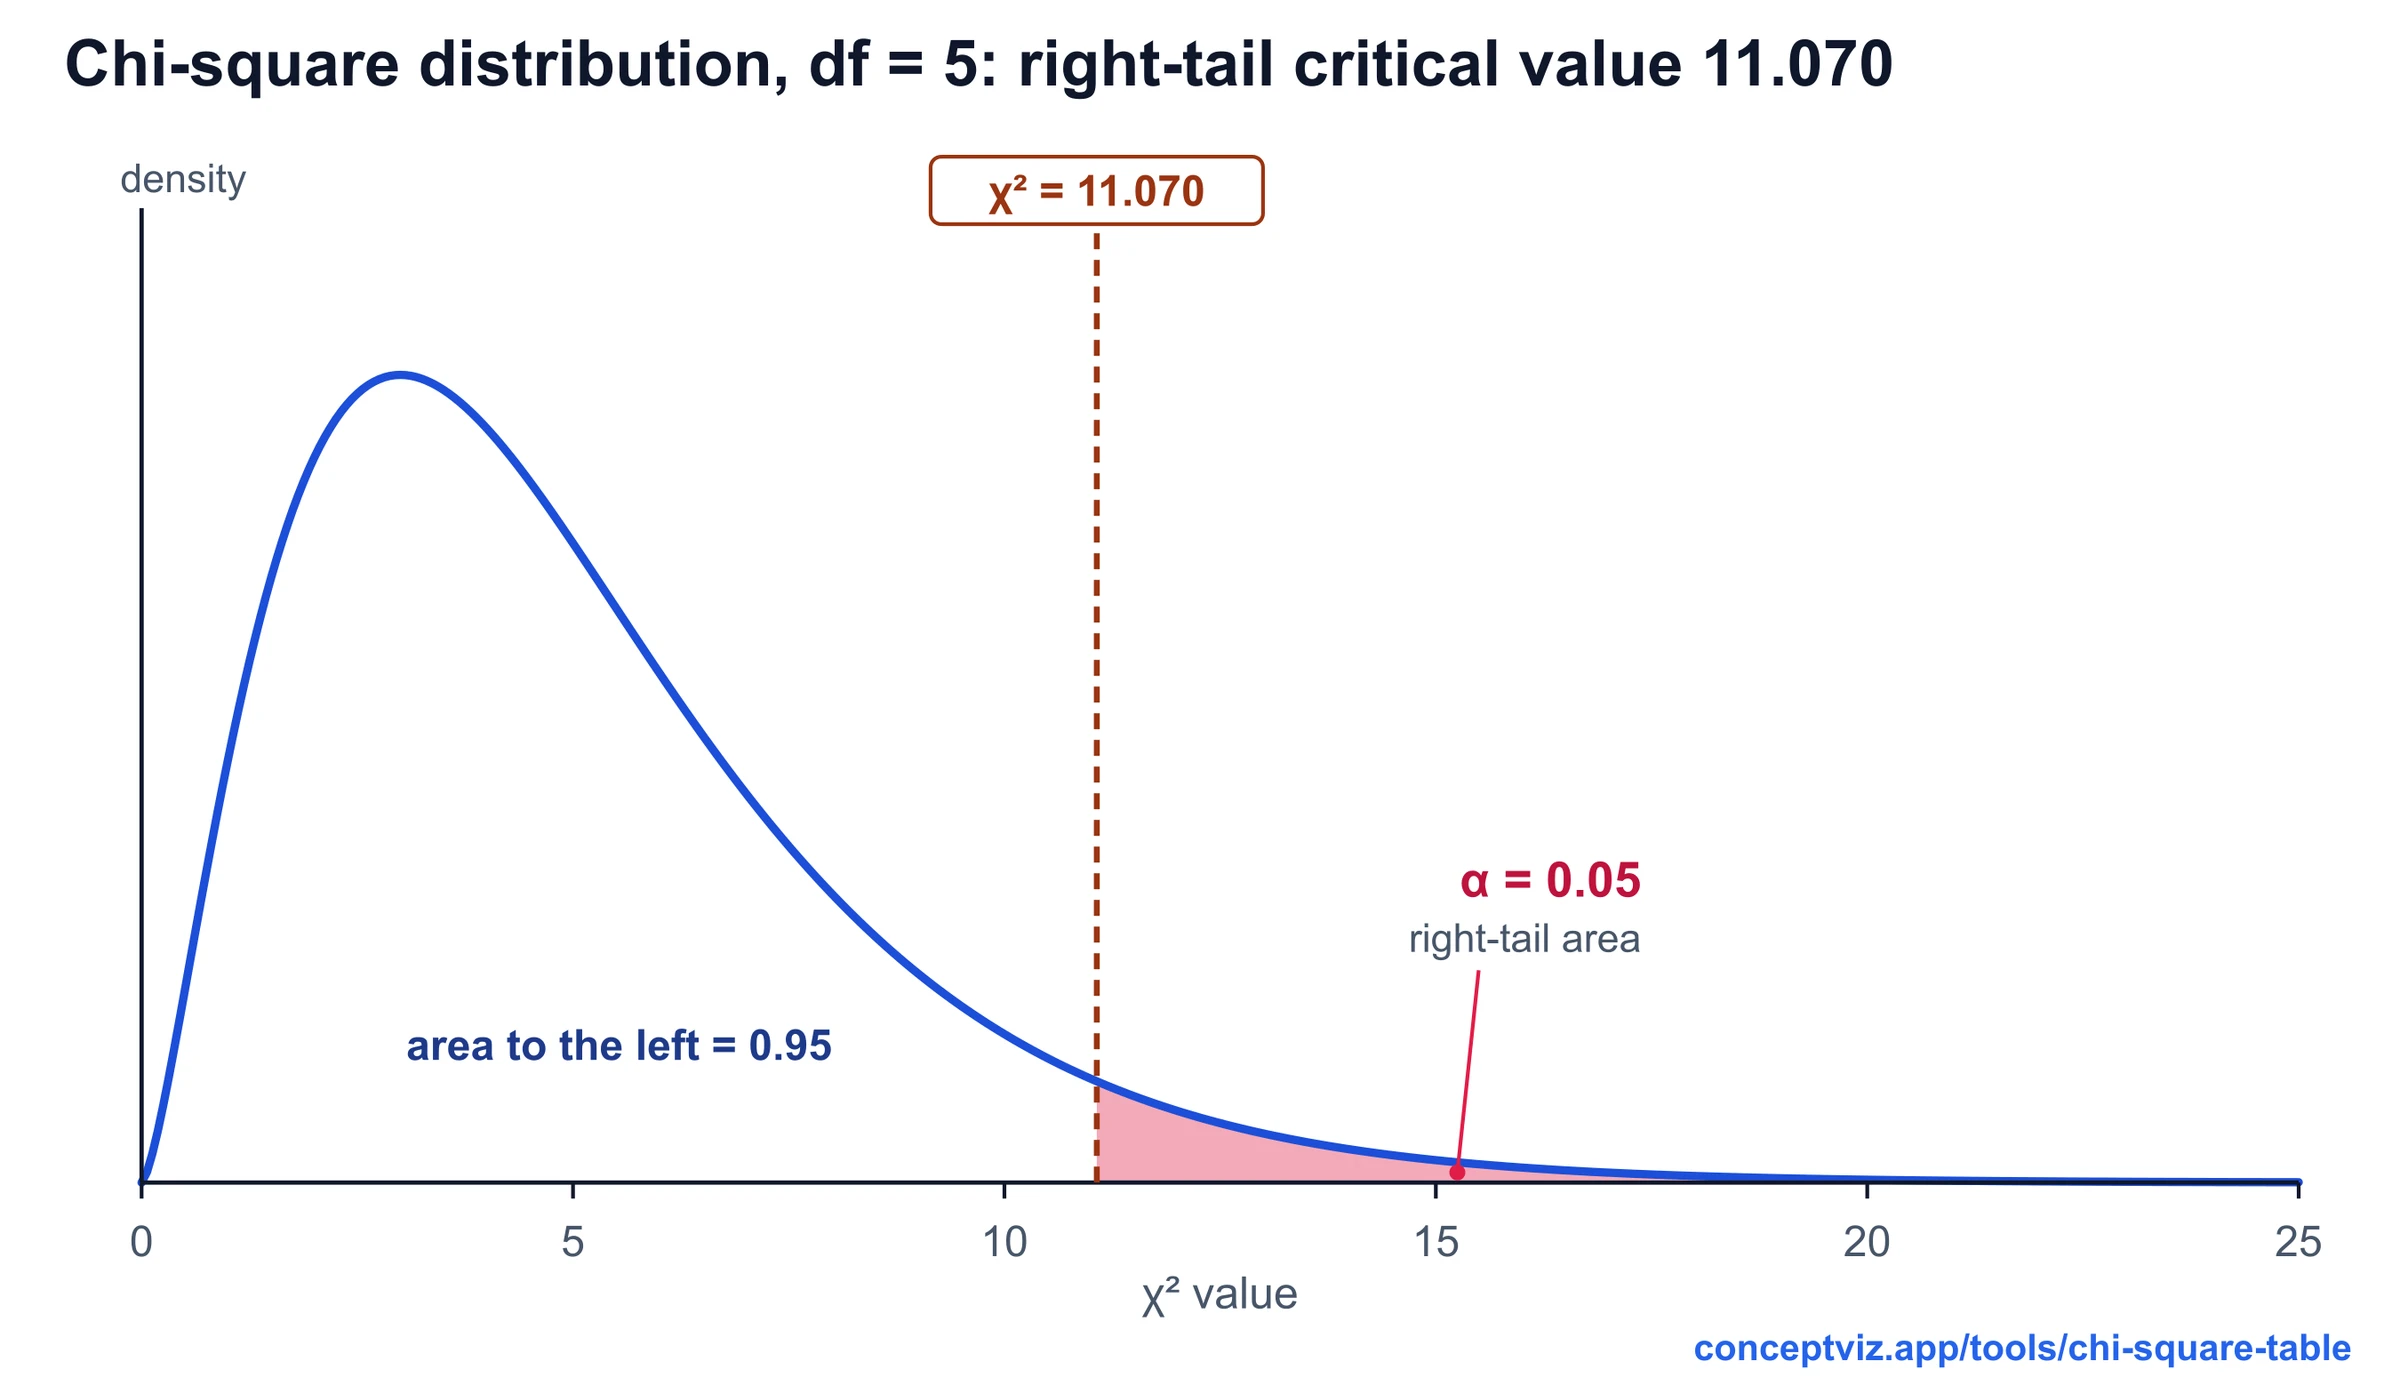
Chi-Square Table
Chi-square table with right-tail critical values for df 1 to 100, a p-value calculator with shaded area and lower-tail columns. Print or download.
 Research
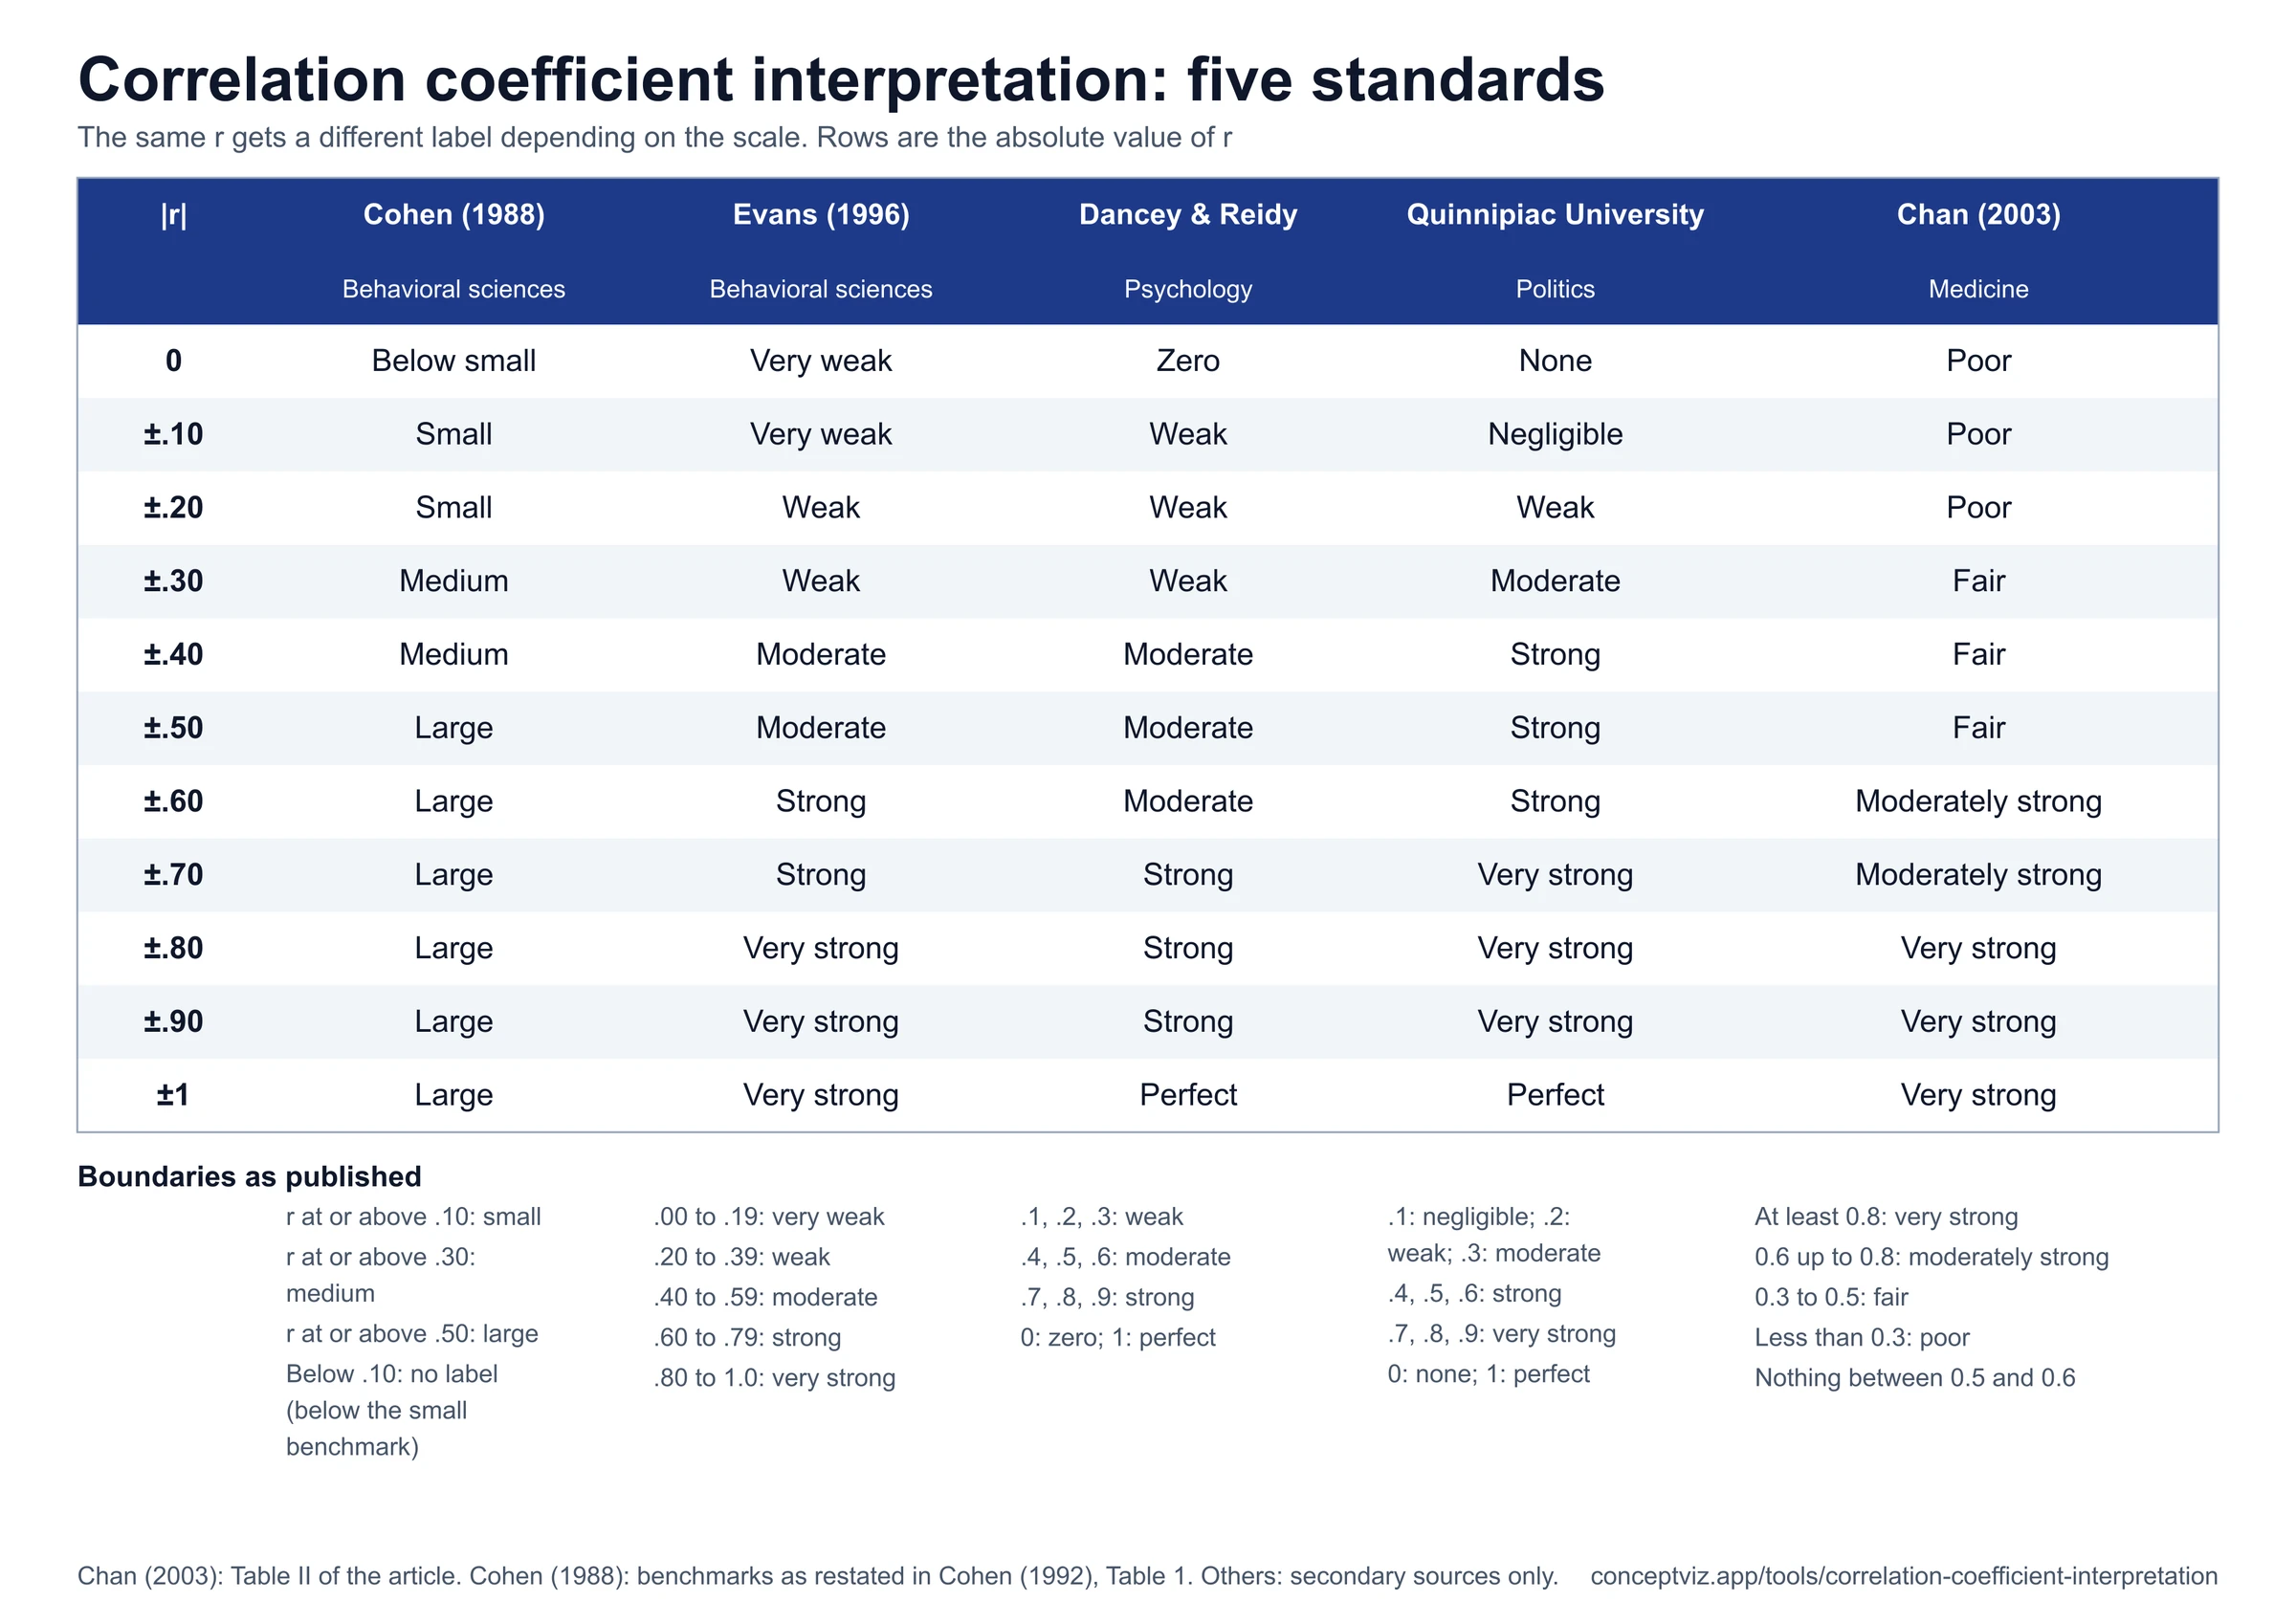
Correlation Coefficient Interpretation
Correlation coefficient interpretation chart with five published scales side by side, plus a calculator for labels, r squared, p value, 95% CI and APA wording.