Figure Legend Examples: Structure and Journal Rules
Write a figure legend in six parts, with before-and-after examples, a fill-in template, and Nature, Science, Cell, PLOS and APA rules with official links.
A good figure legend lets a reader understand the figure without opening the rest of the paper. It does that with six small parts: a title that states the finding, a description of each panel, the symbols and colours, what the error bars show, the sample size and statistical test, and the scale bar. Each part is one sentence or less. Most weak legends are missing the same two or three of them.
"Legend" and "caption" mostly mean the same thing in practice. Life-science journals say legend; APA Style says caption and uses "legend" only for the key drawn inside the figure. Either way, the job is the same, and the length, placement and wording rules change from journal to journal. This guide shows the structure, six before-and-after rewrites, a fill-in template and a journal comparison with an official link for every row, checked in October 2026.
AI Scientific Image Generator
Draft schematics, pathways and concept figures from a text prompt, then check every label and write the legend from your own data.
Try it free →The six parts of a figure legend
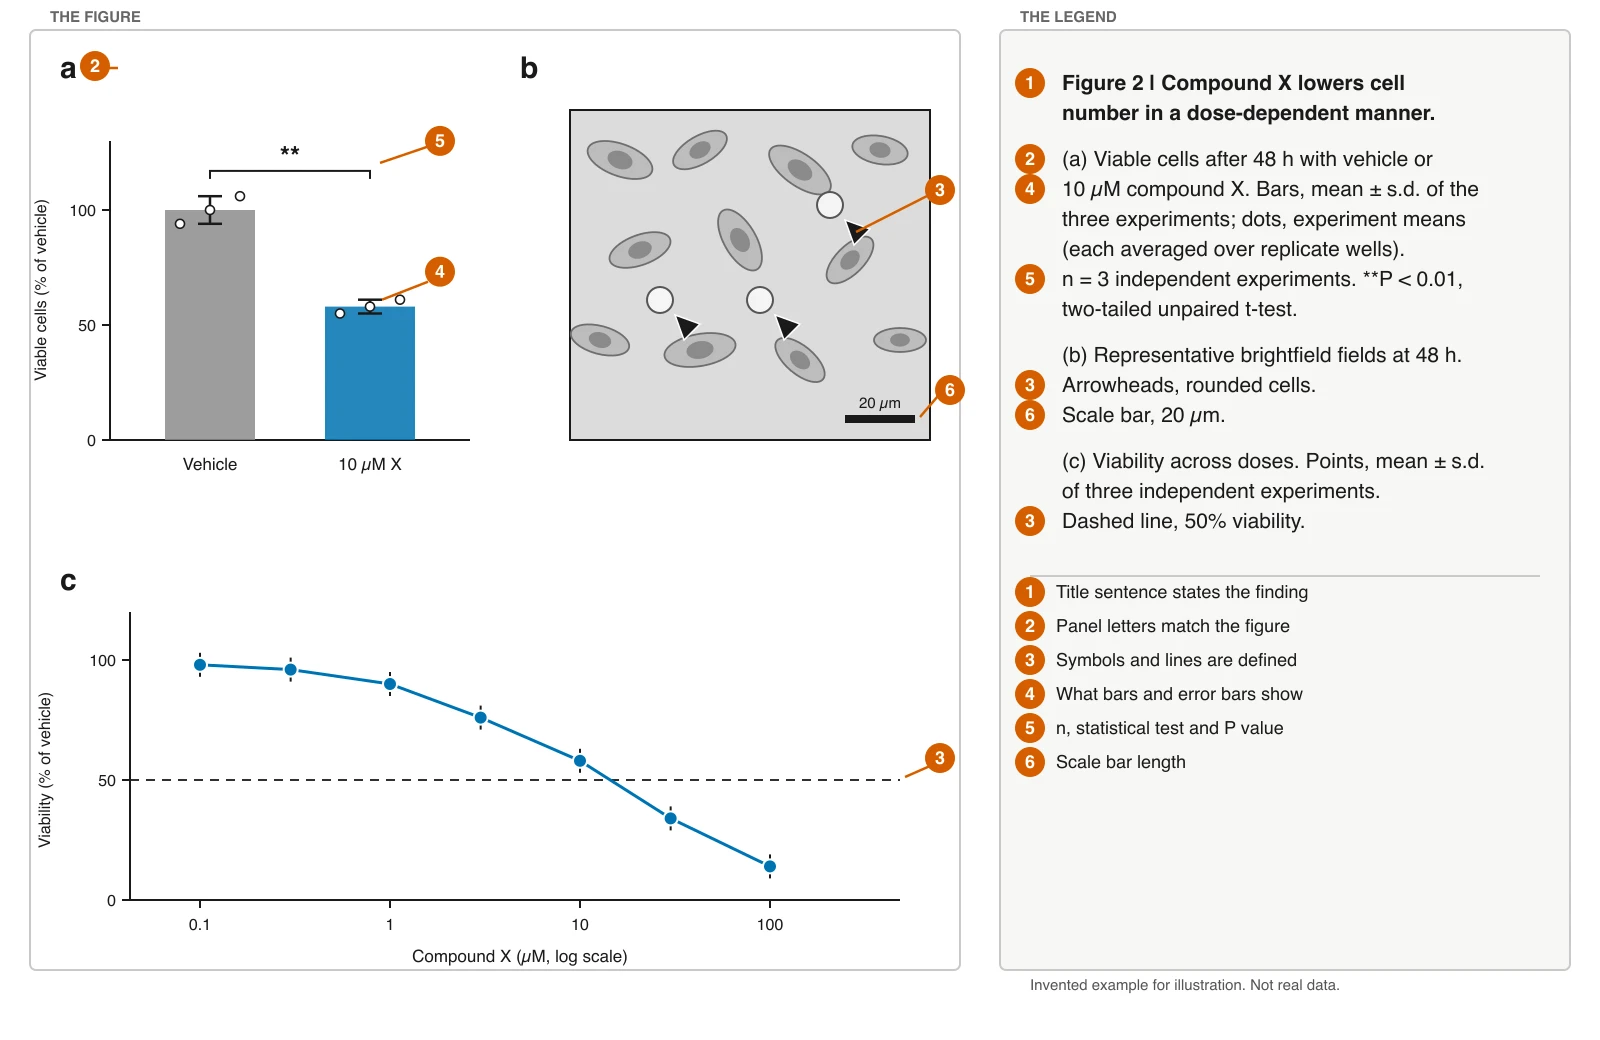
The figure below is an invented example: a three-panel figure on the left and its legend on the right. Each numbered badge on the figure points to the part of the legend that explains it. The data are made up for illustration and come from no real experiment.
An exact diagram we drew ourselves (not AI generated). Badge 1 is the title sentence, 2 the panel letters, 3 the symbols and lines, 4 the error bars, 5 the n, test and P value, 6 the scale bar. Data are invented.
| Part | What to write | Typical mistake |
|---|---|---|
| 1. Title | One sentence that applies to the whole figure, either the finding ("Compound X lowers cell number in a dose-dependent manner") or the content ("Dose response of compound X") | "Results of the experiment" |
| 2. Panel descriptions | A letter and a short description for each panel, in order, with the same letters as the figure | A panel in the figure that the legend never mentions |
| 3. Symbols and lines | Define every arrow, arrowhead, asterisk, dashed line, colour and abbreviation that the reader cannot guess | Leaving the reader to infer what the dashed line means |
| 4. Error bars | Say what the bars and dots are: mean ± s.d., mean ± s.e.m., 95% confidence interval, or individual values | "Error bars show variation" |
| 5. n and statistics | What n counts (wells, animals, independent experiments), the statistical test and the P value or its threshold | A P value with no test, or an n with no unit |
| 6. Scale bar | The length of the scale bar, for microscopy or maps, instead of a magnification factor | A scale bar drawn in the figure and not stated in the legend |
Two things stay out of a legend. Detailed methods belong in the Methods section, and interpretation belongs in the Results or Discussion. Newcastle University's figure legend guidance says the same: describe what the figure shows and leave the explanation to the main text.
Figure legend rules by journal
Length, placement and wording differ. The table lists what each official page says, and says "Not stated" where the page is silent. Always check the journal you are submitting to, because instructions change.
| Nature | Science | Cell Press | PLOS ONE | APA 7 (student and professional) | |
|---|---|---|---|---|---|
| Label and title | Begin with a brief title for the whole figure | Label such as "Fig. 1", then a short bold title as the first line, applying to the figure as a whole | Not stated on the figure page | Label "Fig 1" and a title of 15 words or fewer are required; a legend is optional | "Figure 1" in bold above the figure, title one line below in italic title case |
| Length | Fewer than 300 words per legend | No caption longer than 200 words | Not stated | Not stated; "be succinct" | Not stated; notes only as needed |
| Methods in the legend | None if the paper has a Methods section | Not stated | Describe image processing in the legend or methods | Avoid lengthy descriptions of methods | Not applicable |
| Panels | A short description of each panel and the symbols used | Uppercase letters (A, B), described in order | Not stated | Lettered panels, for example (A) or (a) | Not applicable |
| Statistics | All error bars and statistics defined in the legend | N, P and the test in the caption or main text | Not stated on the figure page | Define non-standard symbols and abbreviations | Notes can explain asterisks used to indicate p values |
| Scale bars and image edits | Use scale bars rather than magnification factors | Say so in the caption if image adjustments are non-linear | Scale bar on all microscopy images; explain alterations and stitching in the legend | Say in the legend if gel lanes were spliced | Not applicable |
| Where it goes | After the main reference list in the final text file | Not stated for the main text (captions are single-spaced and in numerical order) | At the end of the main manuscript file (final files) | Right after the paragraph where the figure is first cited | Embedded after first mention, or on a separate page after the references |
| Official page | Nature formatting guide | Science instructions, initial manuscript | Cell Press figure guidelines | PLOS figure guidelines | APA figure setup |
Checked October 2026. Nature's and Cell Press's placement rules are for the accepted (final) paper; Science's instructions are for the initial manuscript. Nature's figure panel labels (a, b, c) and sizes are covered in our Nature, Science and Cell figure size guide. This page covers only the text.
A few details are easy to miss:
- Nature encourages a legend with its figure at first submission, then, for the accepted paper, a list of legends after the main references and separate from the figure files.
- Science puts the values for N, P and the specific statistical test either in the caption or in the main text, so check where your paper reports them and do not leave them out of both.
- Cell Press pages cover image handling in the legend more than wording. If you stitch panels together or remove gel lanes, the legend has to say so.
- PLOS treats the legend as optional but the title as required, so a title-only caption is valid. A full legend is still better if the figure has symbols to define.
- APA 7 puts the explanatory text in a note under the figure. A note can be general, specific or probability, and carries definitions of abbreviations, copyright attribution and the meaning of asterisks. The APA sample figures show a note that begins with italic Note.
Six before-and-after figure legend examples
All of these are invented by us for illustration. They are not taken from any journal, and the genes, drugs and numbers are made up.
1. A title that says nothing
Before
Figure 1. Results of the experiment.
After
Figure 1 | Knockdown of gene X halves colony formation.
The after version states the finding, which is what a reader scanning a paper looks for. If your target journal prefers descriptive titles, "Colony formation after knockdown of gene X" also works. What does not work is a title that could sit above any figure in any paper.
2. Error bars without a meaning, n or test
Before
(a) Colony counts. Error bars show variation.
After
(a) Colonies 10 days after plating. Bars, mean ± s.d. of three independent experiments; dots, experiment means (each averaged over triplicate wells). n = 3 independent experiments. **P < 0.01, two-tailed unpaired t-test.
Three things changed: the error bar now has a name (s.d.), n has a unit (independent experiments), and the P value comes with its test. The wells in one experiment are technical replicates, so they are averaged into one value per experiment, and the test uses those experiment means. Treating every well as an independent sample would overstate the evidence. Say what n counts, because "n = 9" could be nine wells, nine animals or nine experiments, and readers judge the result differently in each case.
3. A micrograph with undefined markers
Before
(b) Staining of cells. Scale 1.
After
(b) Immunofluorescence of control and knockdown cells stained for γH2AX (green) and DAPI (blue). Arrowheads, cells with more than five foci. Scale bar, 10 µm.
The after version names the stain and the colour channels, defines the arrowheads, and gives the scale bar a length and a unit. Nature asks for scale bars rather than magnification factors, and Cell Press requires one on all microscopy images.
4. Methods inside the legend
Before
(c) Cells were seeded at 5,000 per well in 96-well plates in medium with 10% serum, left to attach overnight, treated with compound X for 48 h and assayed for viability with a luminescent reagent according to the manufacturer's instructions.
After
(c) Viability after 48 h of treatment with compound X (see Methods for assay conditions). Points, mean ± s.d. of three independent experiments. Dashed line, 50% viability.
Nature says legends should not contain details of methods when the paper has a Methods section, and PLOS says to avoid lengthy descriptions of methods. Keep only the conditions a reader needs to read the panel, such as the time point, and move the rest.
5. Interpretation in the legend
Before
(d) Treated cells show fewer cells in S phase. This shows that compound X acts by blocking the cell cycle, which explains the loss of viability in panel c.
After
(d) Proportion of cells in S phase after 24 h with vehicle or 10 µM compound X, measured by flow cytometry. Bars, mean ± s.d. of three independent experiments.
The mechanism claim belongs in the Results or Discussion, where you can argue for it and cite other work. The legend only says what the panel shows and how it was measured.
6. An APA caption for a student paper
Before
Fig. 1: graph of scores
[figure]
After
Figure 1
Mean Quiz Scores by Study Method
[figure]
Note. Error bars show standard errors. n = 24 students per group.
APA 7 puts the number in bold above the figure, the title one line below in italic title case, and any explanation in a note below the figure. If you reproduce a figure from another source, the note also carries the credit, for example "Adapted from" followed by the source. Your instructor or department may add rules, so check them as well.
A fill-in template
Copy this and replace the brackets. Delete any part that does not apply.
Figure [number] | [Title sentence stating the finding]. (a) [What panel a shows, with time point or condition]. [Bars/points/lines], [mean ± s.d. / s.e.m. / 95% CI]; [dots], [individual wells / animals]. n = [number] [what n counts] from [number] independent experiments. [//]P < [value], [name of the statistical test]. (b) [What panel b shows]. [Symbol], [meaning]. Scale bar, [length and unit]. (c) [What panel c shows]. [Line style or colour], [meaning].
Then run through this checklist before you submit:
- The title applies to the whole figure, not to one panel.
- Every panel letter in the figure appears in the legend, in order, and the other way round.
- Every arrow, asterisk, dashed line, colour and abbreviation is defined, and abbreviations match the main text.
- Every error bar is named (s.d., s.e.m., confidence interval), and n says what it counts.
- The statistical test and the P value, or the threshold behind each asterisk, are given.
- Scale bars have a length and a unit.
- Methods and interpretation are in the right section.
- The length, label style and placement match the journal's page, linked in the table above.
Common figure legend mistakes
- Writing the legend after the figure is frozen. Write it while you build the figure, so you notice the symbols and bars that need defining.
- Describing the figure instead of what it shows. "A bar chart with two bars" tells the reader nothing the figure does not.
- Different wording for the same thing. If the text says "knockdown", the legend should not say "silencing".
- Putting the key only inside the figure. Nature suggests, where possible, putting text such as keys to symbols in the legend rather than on the figure itself.
- Leaving out what n counts. A P value without n and a test cannot be checked.
- Missing credits. If a figure or part of it is reproduced from another source, credit it the way the journal or style guide asks. PLOS puts credits in the last sentence of the legend; APA puts them in the note.
Make the figure first, then write the legend
A legend is easiest to write when the figure is final. If you are still drafting a schematic, a pathway or a concept figure, a text-to-image tool such as the AI Scientific Image Generator can give you a first draft quickly. Treat it as a draft: check every label, arrow and symbol against your own data, and write the legend from what the finished figure actually shows, not from the prompt. Journal policies on AI-generated images differ and change. Cell Press, for example, does not permit generative AI or AI-assisted tools to create or alter research or data images, so an AI image is only suitable for a schematic or concept figure, and a chart of your results should be drawn from your data with a data tool. Read your target journal's policy before using any AI image in a paper.
Start free with 2 image credits, valid for 7 days, no card required.
Bar Chart Maker
Turn your data into a clean bar chart, then write the legend from the numbers.
Related guides
- Nature, Science and Cell figure size and font guide
- How to make scientific diagrams for research papers
- Scientific color palette guide
- TOC graphic and graphical abstract requirements by journal
Further reading
- Nature formatting guide, Figure legends section
- Science: instructions for preparing an initial manuscript
- Cell Press figure guidelines
- PLOS: how to submit figures and captions
- APA Style: figure setup and sample figures
- AJE: writing an effective figure legend
Frequently asked questions
What is a figure legend?
A figure legend is the text that accompanies a figure and lets the reader understand it without going back to the main text. It usually has a title, a short description of each panel, definitions of symbols and abbreviations, what the error bars show, and the sample size and statistical test.
What is the difference between a figure legend and a figure caption?
In most journals the two terms mean the same thing. Life-science journals tend to say legend. APA Style says caption for the title and note under a figure, and uses legend only for the key inside the figure that explains its symbols.
How long should a figure legend be?
It depends on the journal. Nature asks for fewer than 300 words per legend, and Science says no single caption should be longer than 200 words. Other journals do not state a limit on the pages we checked, so follow the journal's current instructions and keep the legend short enough that the figure is still the main thing on the page.
What should a figure legend include?
A title that applies to the whole figure, a description of each panel, definitions of symbols, colours and abbreviations, what the error bars represent, the sample size and statistical test, and the scale bar length for microscopy images. Leave out detailed methods and interpretation.
Does a figure legend need the sample size and statistical test?
Often yes. Nature asks for all error bars and statistics to be defined in the legend, and Science asks for N, P and the test to be given in the caption or main text. State what n counts, such as wells, animals or independent experiments.
Where does the figure legend go?
It depends on the journal. Nature asks for legends after the main reference list in the final text file, PLOS places them right after the paragraph where the figure is first cited, and Cell Press asks for them at the end of the main manuscript file. APA puts the number and title above the figure and a note below it.
How do I write a figure caption in APA 7?
Put the figure number in bold above the figure, the title one double-spaced line below it in italic title case, and any explanation in a note below the figure that starts with italic Note. Number figures in the order they are mentioned in the paper.
Should the legend explain what the results mean?
No. The legend should say what the figure shows and how it was measured. Explaining what the result means belongs in the Results or Discussion section.
Categories
More Posts
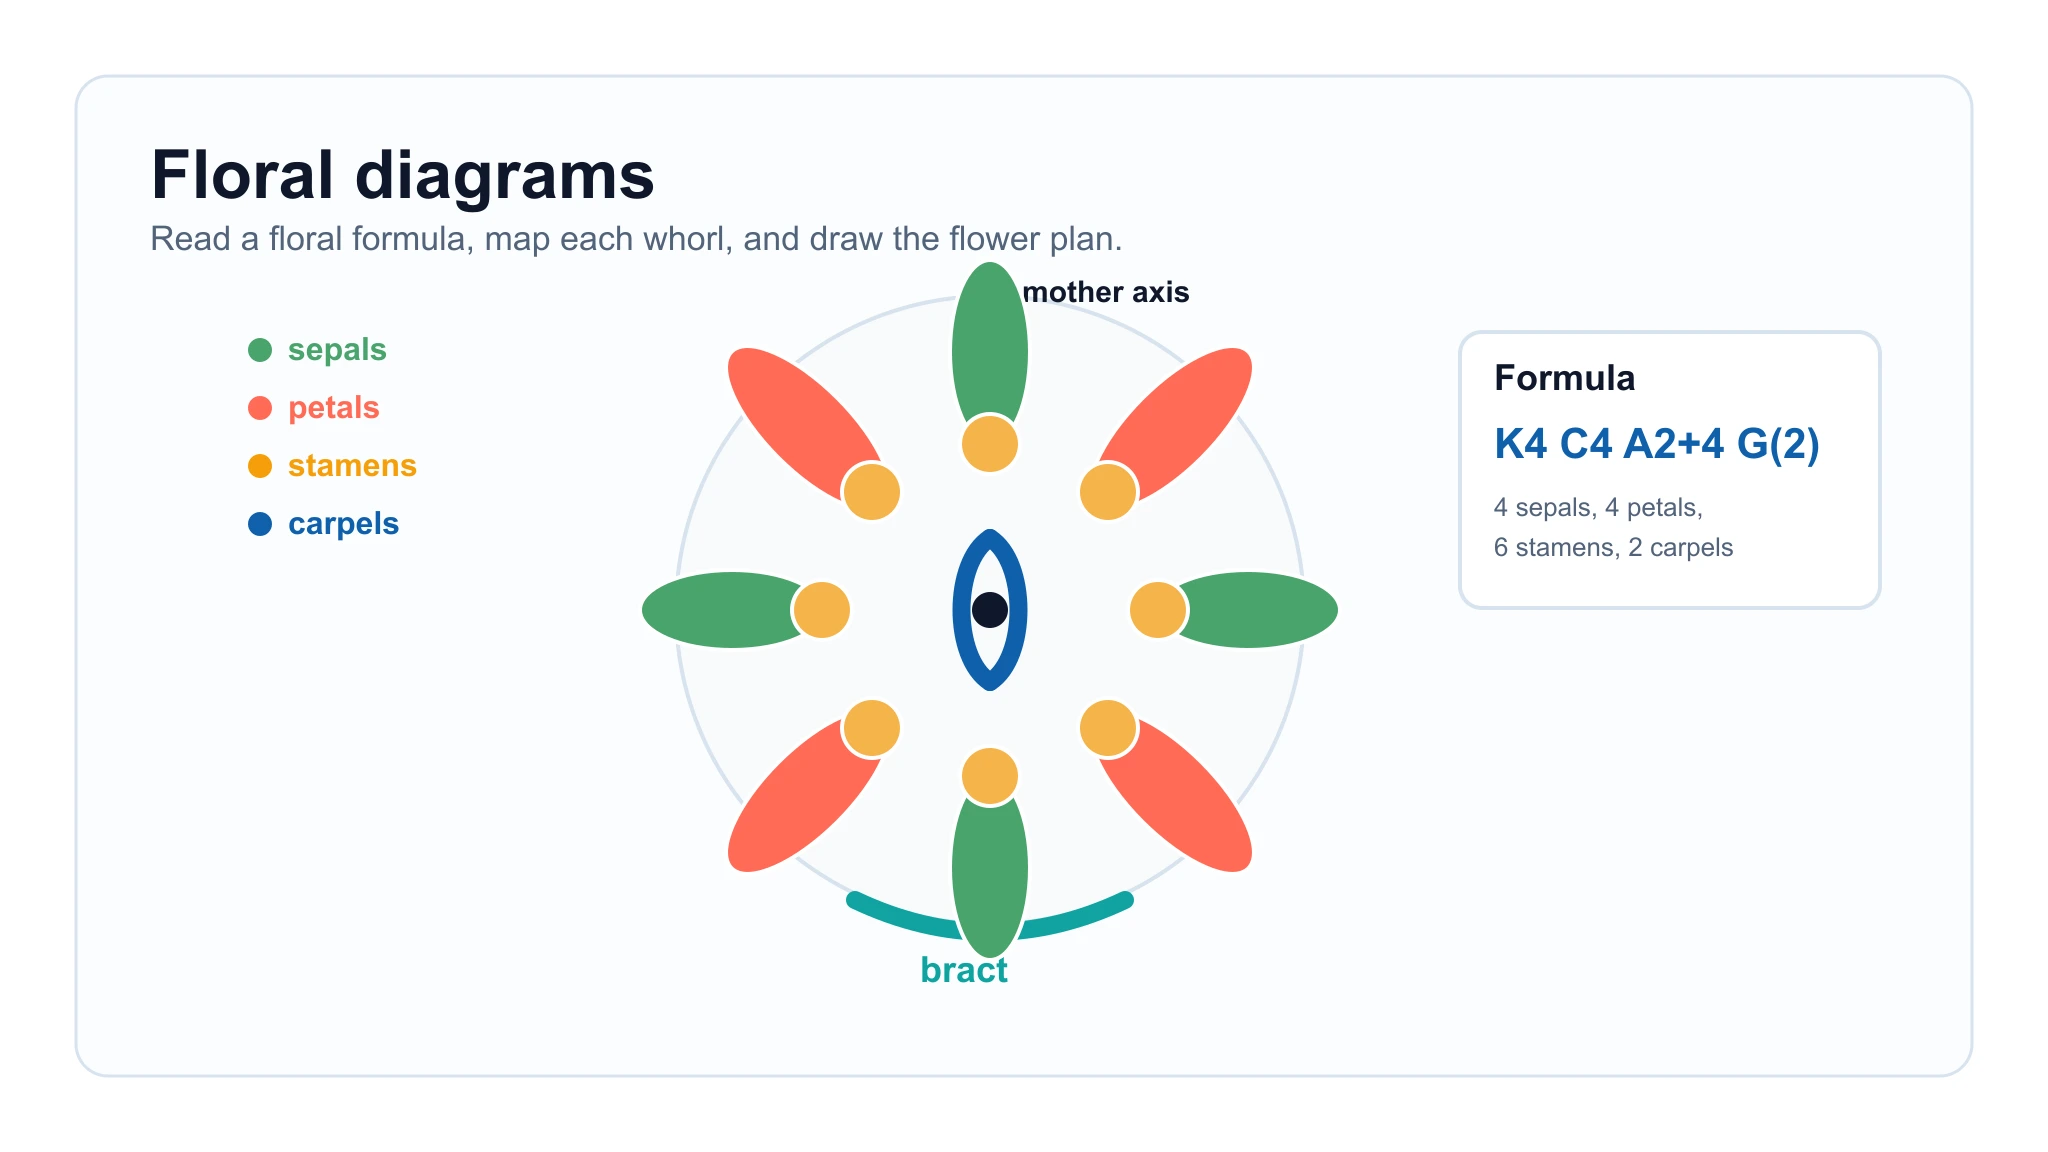
Floral Diagram Guide: Floral Formula Symbols, Examples, and How to Draw One
Learn how to read floral diagrams, understand floral formula symbols, draw whorls from a formula, and use examples like Brassicaceae.
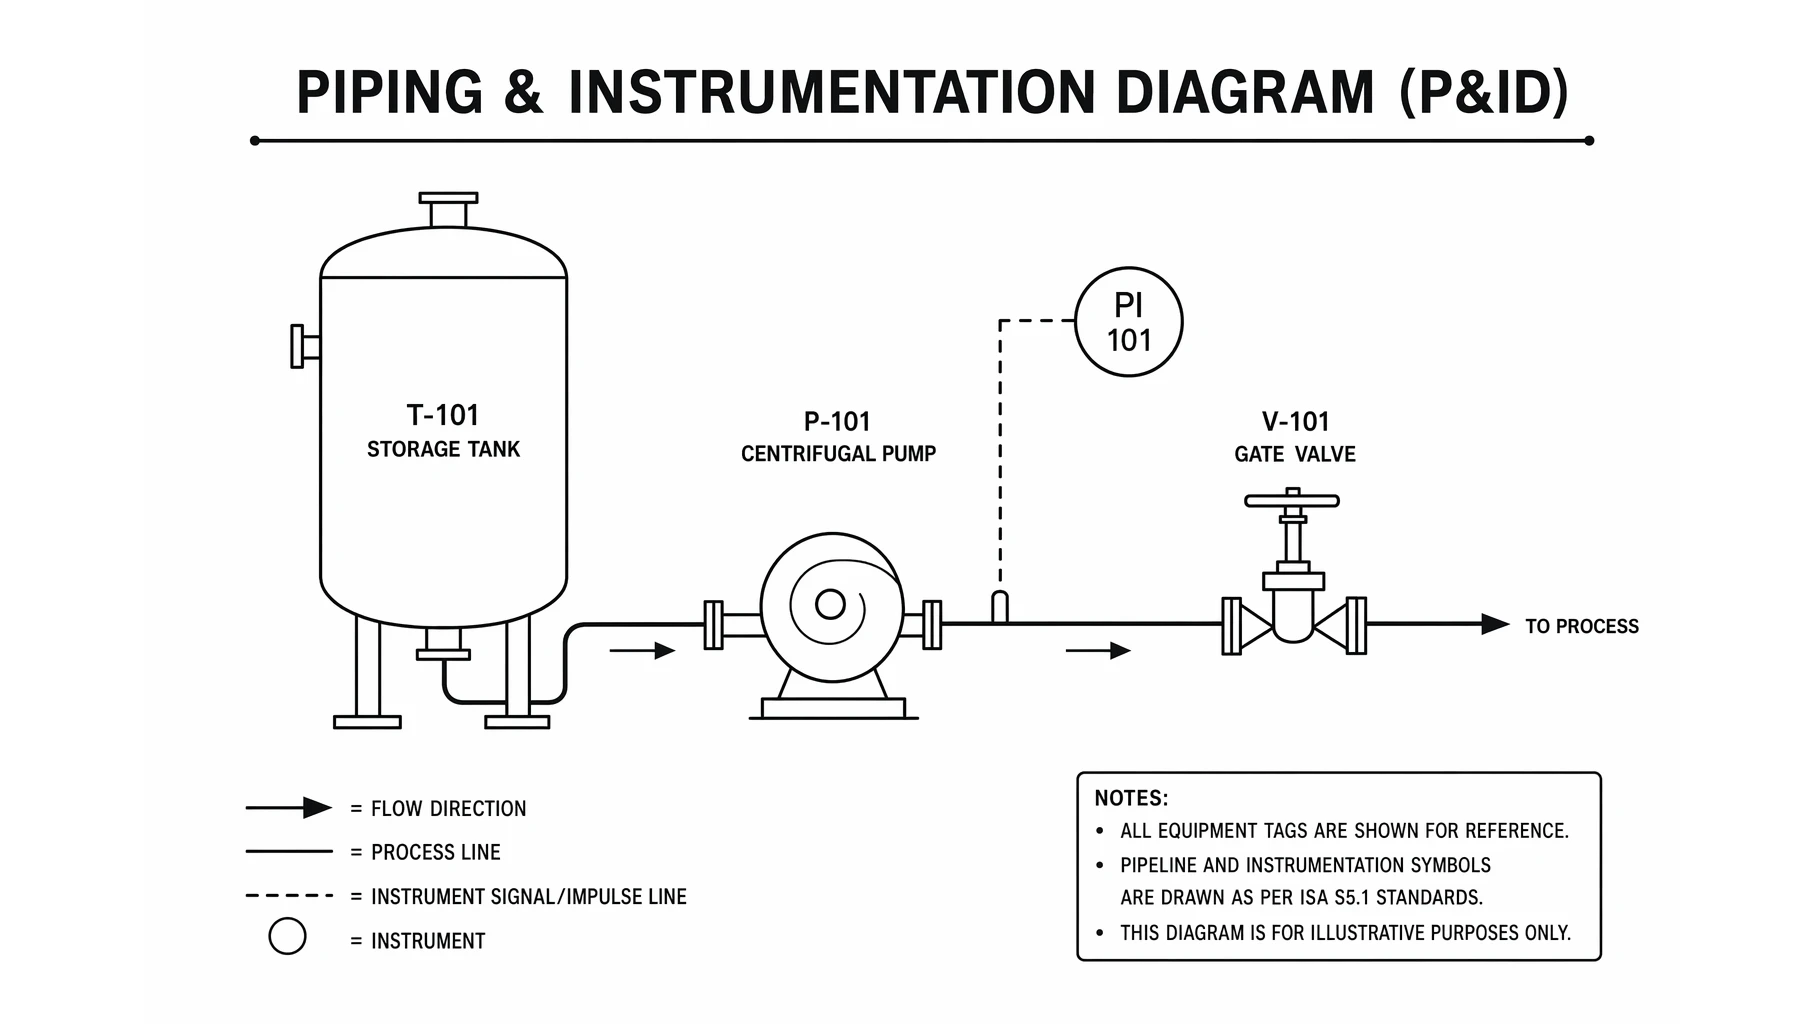
What Is a P&ID? Piping & Instrumentation Diagrams Explained
A P&ID shows every pipe, valve, and instrument in a process. Learn to read piping and instrumentation diagrams, ISA symbols, and how a P&ID differs from a PFD.
How to Illustrate Science: Methods, Tools & Examples (2026)
Learn 8 proven ways to illustrate science for research papers, posters, and presentations. Covers diagrams, infographics, graphical abstracts, and more.