Synthesis Matrix Generator for Literature Reviews
Free synthesis matrix generator — build a literature review matrix: sources as rows, themes as columns. Editable grid, example included, export SVG or CSV.
Synthesis Matrix Examples
Exact engine renders plus AI illustrations across disciplines
Themes by Source Matrix
Exact engine render — five sources synthesized across four thematic columns.
Writing Center Format Matrix
Exact engine render — the classic Author/Year, Methodology, Key Findings, Gaps format.
Psychology Thesis Review
AI illustration — a psychology thesis literature review organized as a synthesis matrix.
Nursing Evidence Table
AI illustration — an evidence synthesis table for a nursing literature review.
Education Policy Dissertation
AI illustration — an education policy dissertation literature review matrix.
Systematic Review Extraction
AI illustration — a data extraction matrix for a PRISMA systematic review.
What is a synthesis matrix?
A synthesis matrix — also called a literature review matrix — is a grid that organizes the sources for a literature review. Each row is one source (author and year), each column is a theme, methodology, or facet of your research question, and each cell records what that source says about that theme. Instead of summarizing papers one by one, the matrix forces you to compare them side by side: read down a column to see how the whole literature treats a single theme, and read across a row to see one source’s full contribution. Writing centers at universities like NC State and the University of Arizona recommend it as the core tool for turning a pile of papers into an actual synthesis. This generator renders your matrix as a clean, printable table as you type.
How to build a synthesis matrix (the matrix method)
- Choose your columns first. Pick 3–5 themes that map to your research question, or use the Writing Center Standard template — Methodology, Key Findings, and Gaps — to compare how studies were done and what they found.
- Add one row per source with its author and year. Five to fifteen sources is typical for a graduate literature review section.
- Fill each cell with a short, pointed note — a finding, a method detail, or a limitation — not a full summary of the paper.
- Read down each column to synthesize: where do sources agree, conflict, or leave gaps? Those patterns become the topic sentences of your literature review paragraphs.
- Export the finished matrix as SVG for your notes or appendix, or as CSV to keep working in Excel or Google Sheets.
Example: mindfulness in education
The tool opens with a completed example so you can see what a finished matrix looks like before you start: five widely cited studies on mindfulness in education — Zenner et al. (2014), Schonert-Reichl et al. (2015), Broderick & Metz (2009), Kuyken et al. (2013), and Roeser et al. (2013) — compared across four themes: attention and focus, stress and wellbeing, academic outcomes, and implementation challenges. Notice how each cell holds one pointed note, not a paragraph. Reading down the Academic Outcomes column, for instance, immediately shows the pattern a literature review should state: effects on achievement are consistently smaller and less certain than effects on wellbeing. Replace the example rows with your own sources when you are ready.
Synthesis matrix vs summary table
A summary table reports studies one row at a time — citation, aim, method, result — and is read row by row. A synthesis matrix rotates the perspective: the columns are your themes, so the table is read column by column to compare sources against each other. The summary table answers "what did each study do?"; the synthesis matrix answers "what does the literature as a whole say about each theme, and where are the gaps?" Most writers draft the summary table first while reading, then build the synthesis matrix to plan the actual writing. If your advisor asks for a "lit review matrix," this is what they mean.
Where it fits in a systematic review (PRISMA) workflow
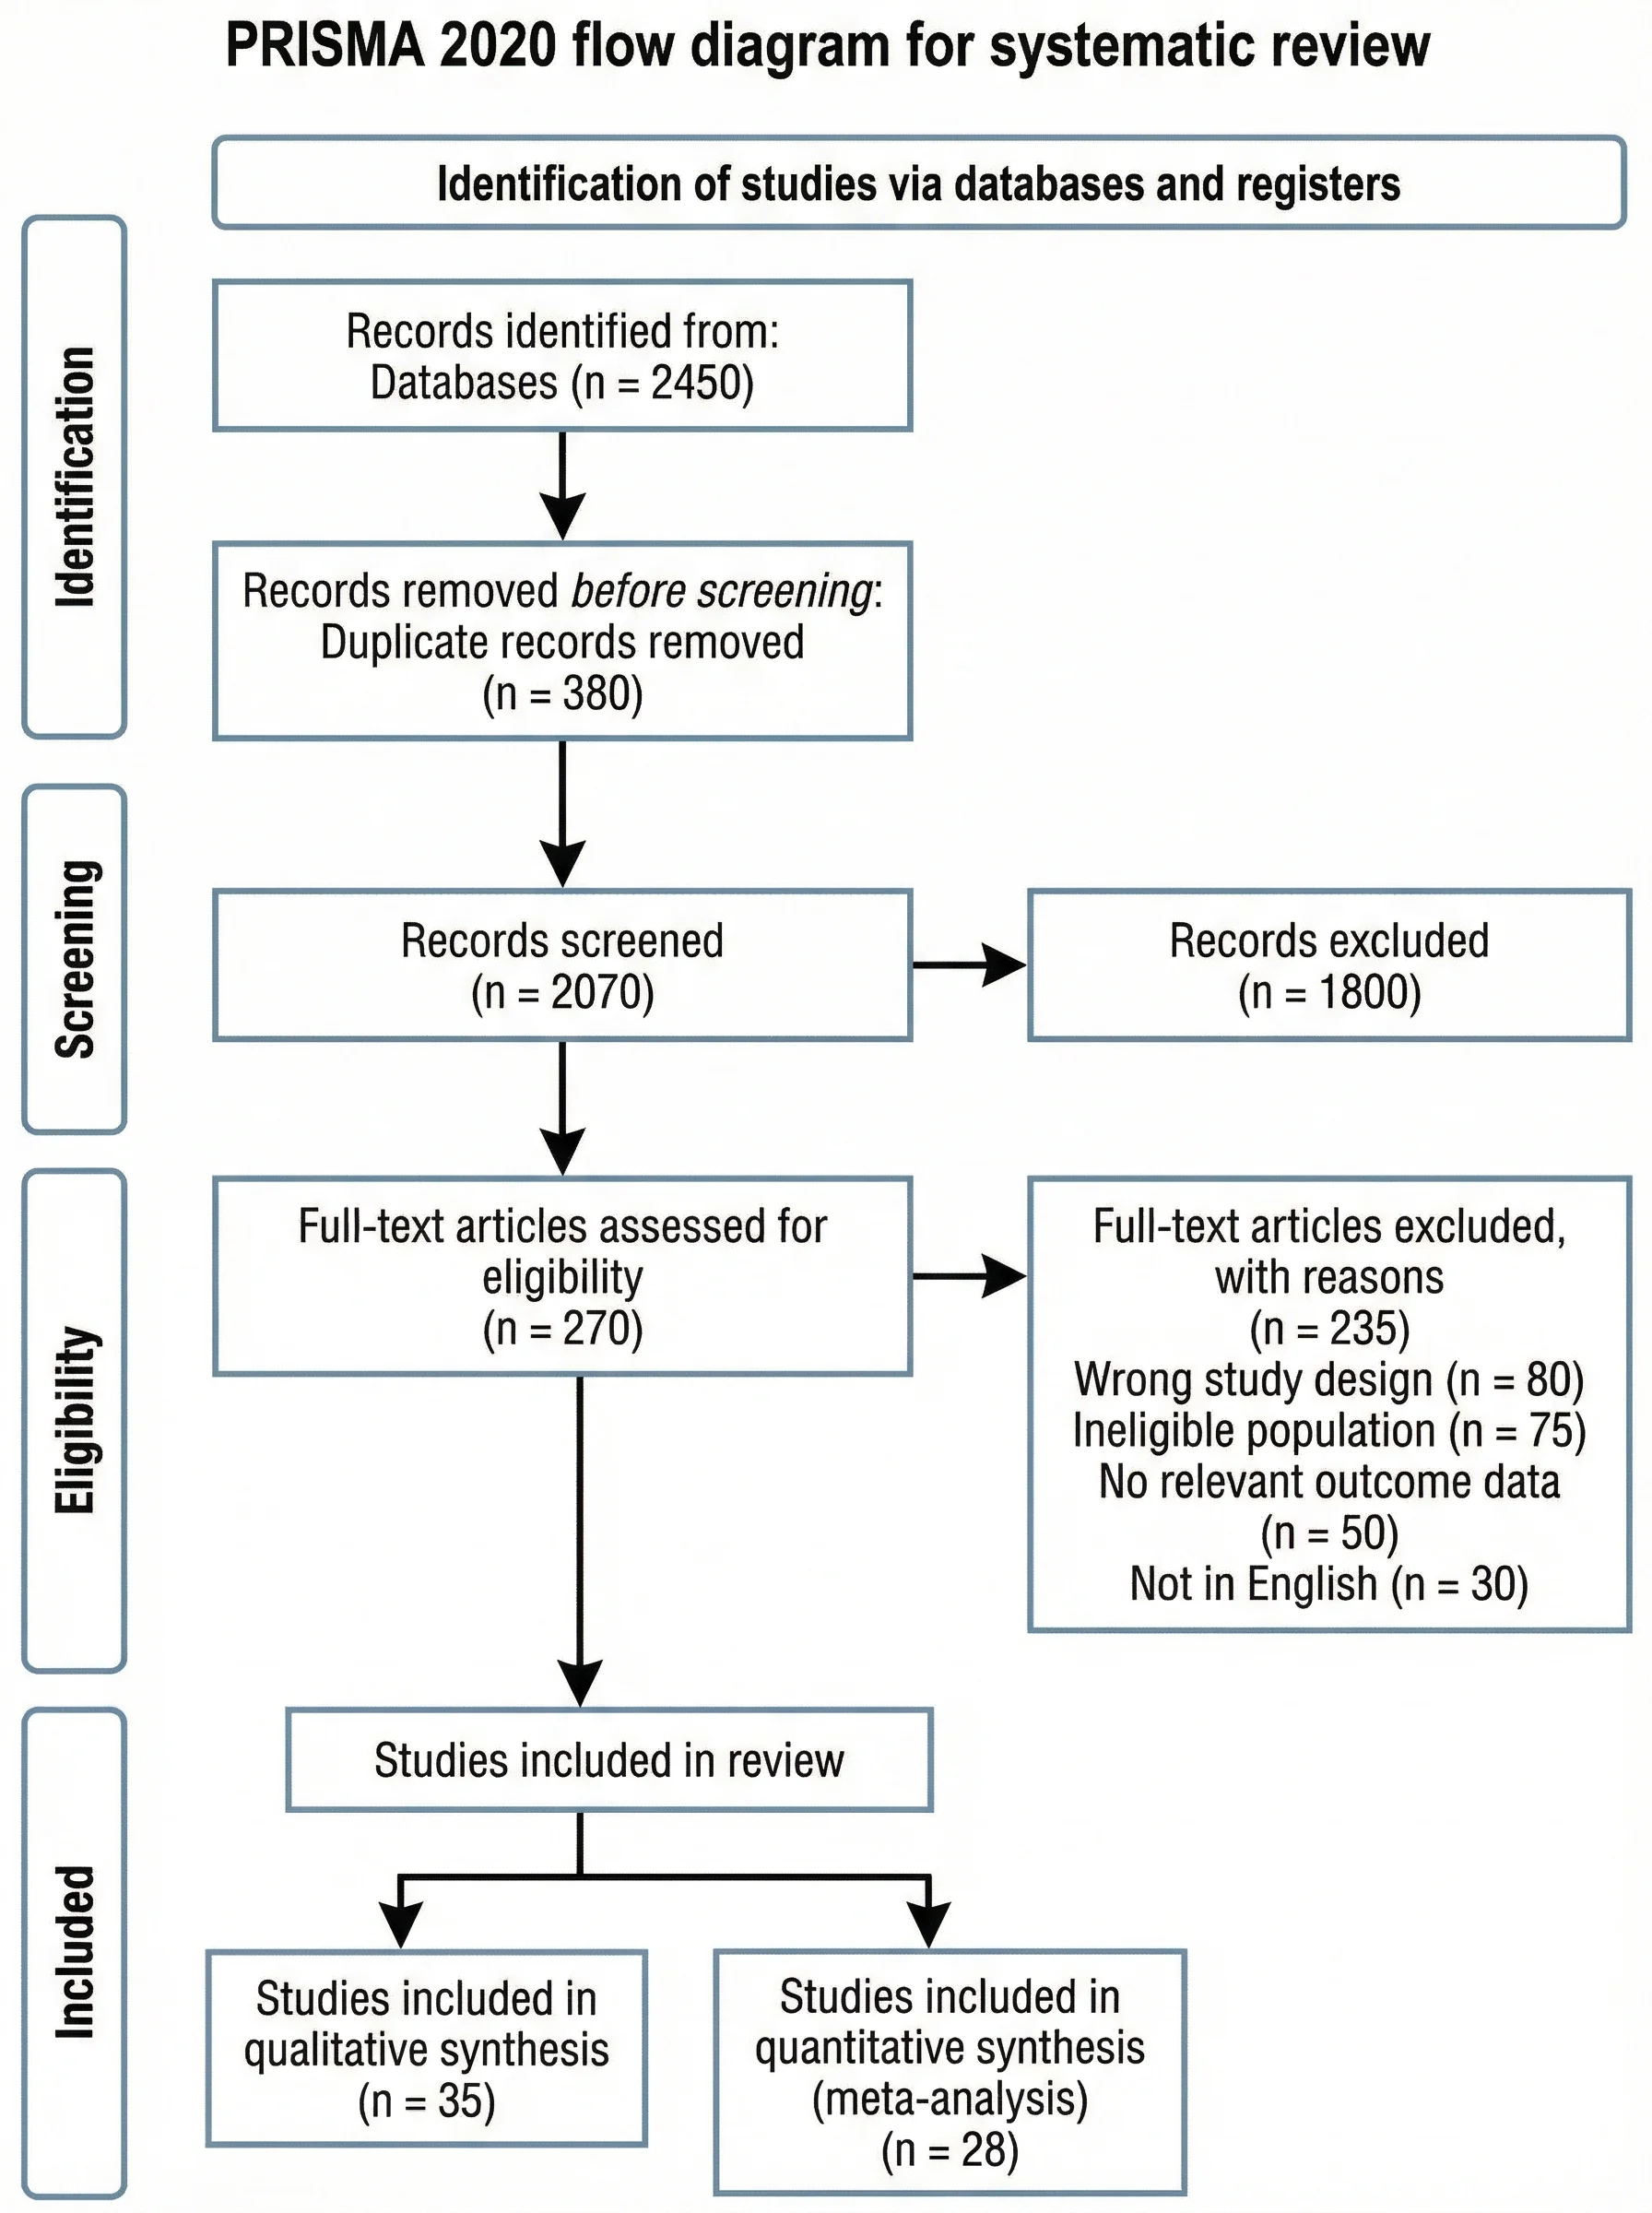
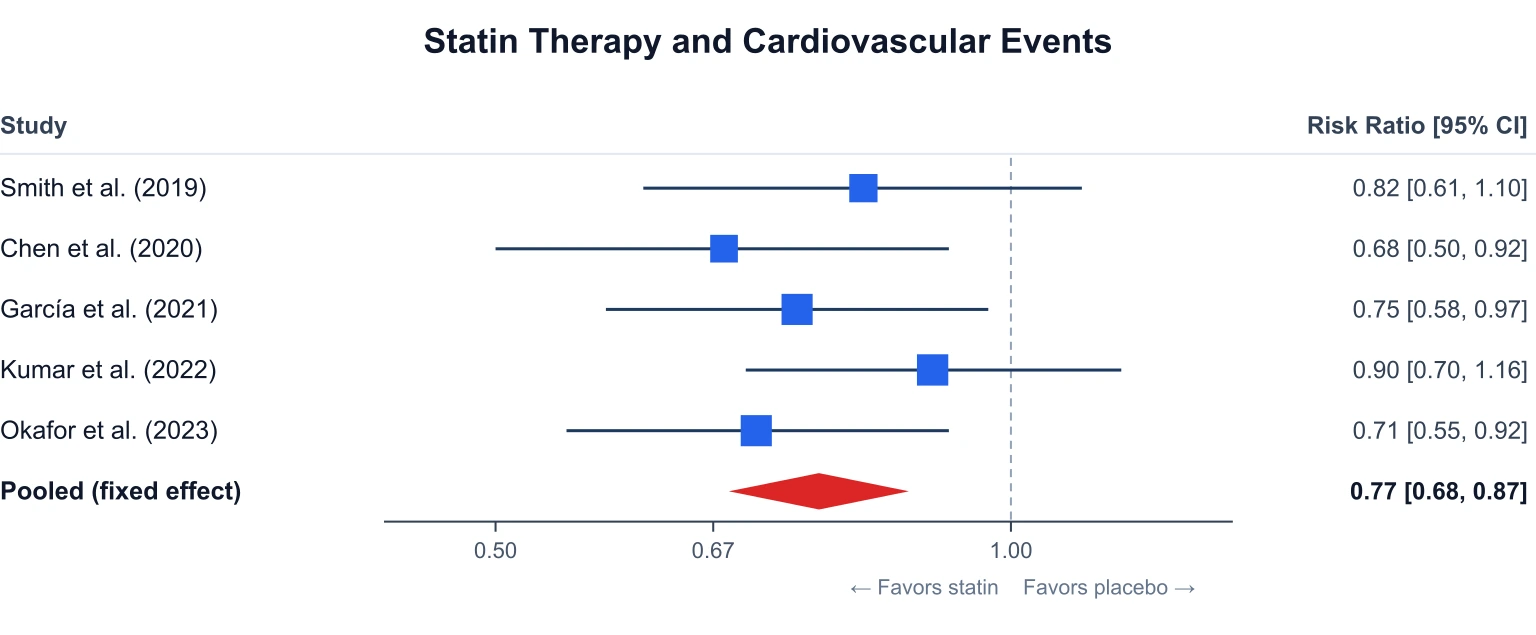
In a systematic review, the synthesis matrix sits between screening and writing. Your PRISMA flow diagram documents how many records you identified, screened, and included; the synthesis matrix is where you extract and compare data from the included studies. Add a column per data item in your extraction plan — design, sample, measures, effect sizes — and the matrix becomes your evidence table. If the review includes a meta-analysis, the same matrix feeds the numbers you later plot in a forest plot. For a narrative graduate literature review the workflow is lighter, but the matrix plays the same role: it is the bridge between reading the sources and synthesizing them.
Frequently Asked Questions
Related Research Tools
 Research
PRISMA Flow Diagram Generator
Document identification, screening, and inclusion for your systematic review.
 Research
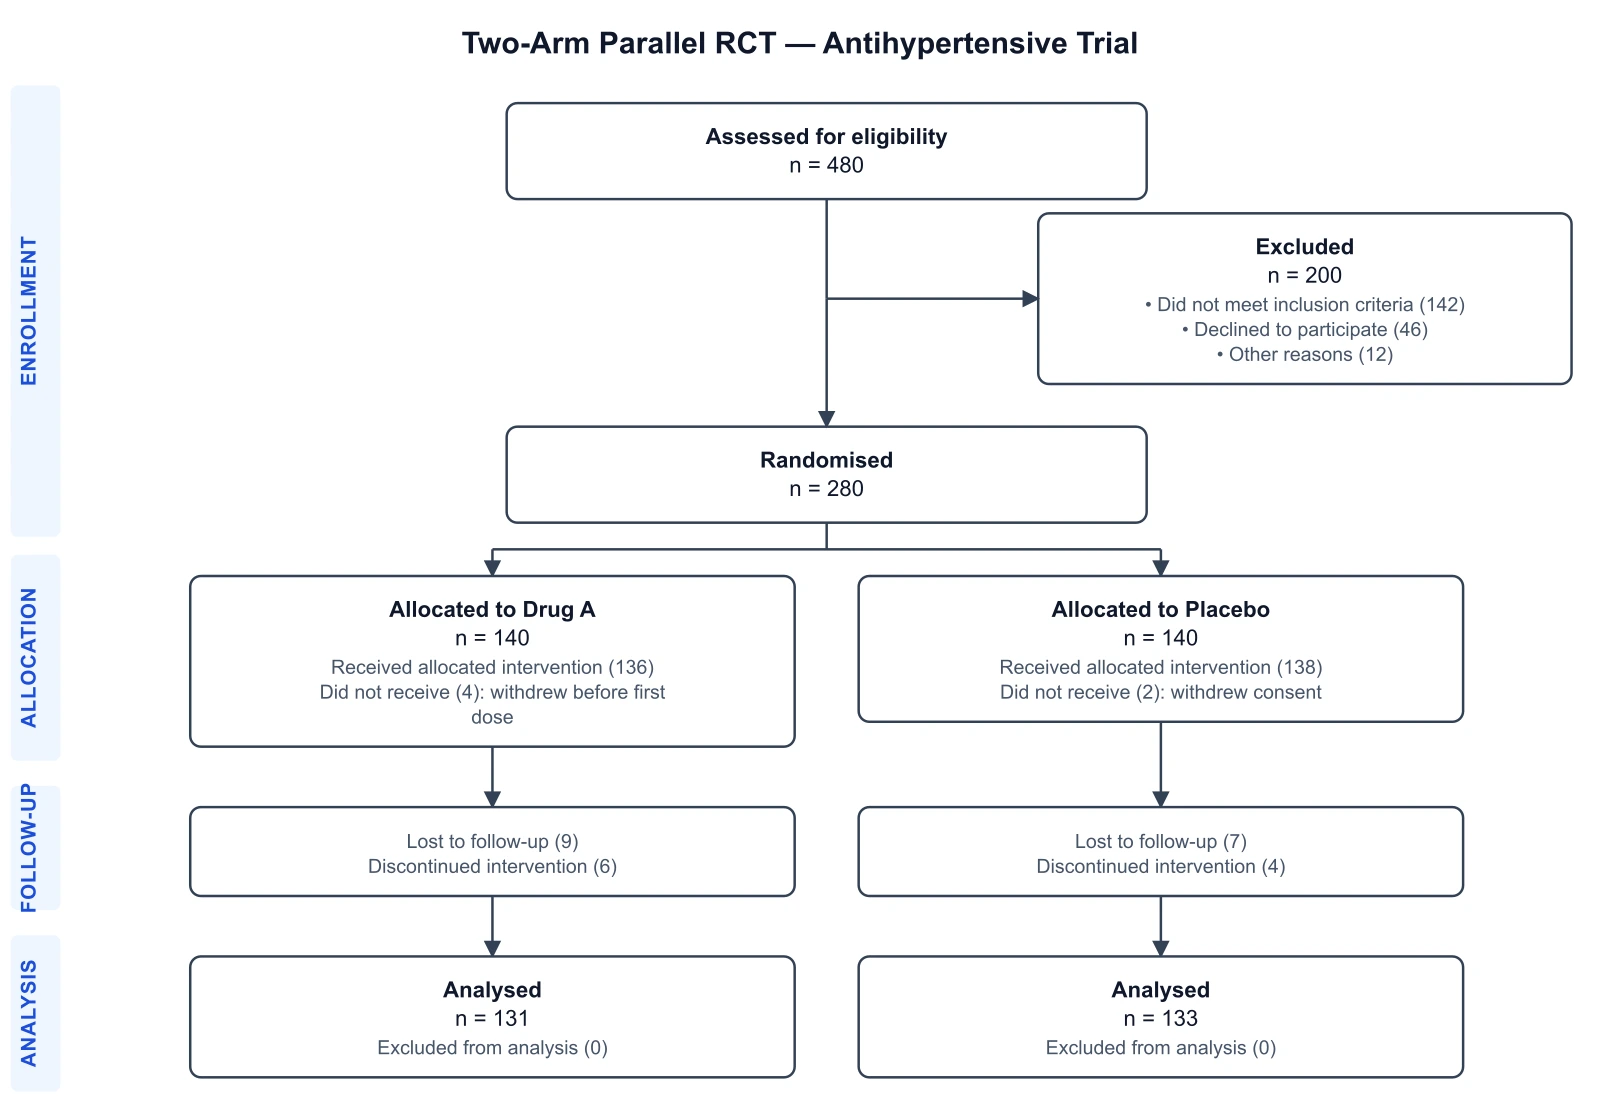
CONSORT Diagram Generator
Draw a CONSORT 2010 participant flow diagram for a randomized controlled trial.
 Research
Forest Plot Generator
Plot pooled effect sizes with confidence intervals for a meta-analysis.