Solution Architecture Diagram Generator for Proposals and Design Reviews
Draft a solution architecture diagram for an RFP response, a design review, or a client handover. Describe the context, the integrations and the deployment, and get a labeled first draft with non-functional notes.
Solution Architecture Diagram Generator
Preview is free on this page ·
Your solution architecture diagram will appear here
Describe your solution and click Generate
Solution Architecture Diagram Examples
Cloud web, enterprise integration, data platform, business context, disaster recovery, and layered views
Three-Tier Cloud Web Solution
Users, CDN and load balancer in front of app servers in two zones. App servers in both zones write to the primary database, and the standby only receives replication. Known issues: the cross-zone arrow is a simplification, and there is no object storage or cache.
Enterprise Integration Solution
A portal reaches CRM, ERP and a data warehouse through an API gateway and an integration platform, with single sign-on and a cloud and on-premises boundary. Known issues: all integration arrows are one-way, the link from the cloud to the on-premises ERP shows no VPN or agent, and one OAuth label overlaps the cloud border.
Data Platform Solution
Sources, ingestion, a lakehouse with raw, curated and serving zones plus governance, and the consumers on the right. Known issues: arrows work at column level and do not show which source feeds batch or streaming ingestion, and the row-level security note sits on a column border.
Business Context for an RFP
The proposed solution in the center, the people who use it on one side, the external systems it talks to on the other. Known issue: the two-way arrow to the business capabilities bar is ambiguous, because capabilities belong inside the solution.
Disaster Recovery Deployment
Primary and recovery sites with replication, a failover path, and recovery point and time targets. Known issues: the recovery site omits the firewall shown at the primary site, the internet arrow lands on the site box instead of the firewall, and the failover path is not fully clean.
Layered Solution View
Business, application, data and technology layers with a security and compliance bar that spans all of them. Known issue: only neighboring layers are connected, so a direct application-to-technology dependency is not shown.
What is a solution architecture diagram?
A solution architecture diagram shows how a proposed solution fits into a customer environment: who uses it, which existing systems it connects to, what it is made of, and where it runs. It is usually written by a solution architect or pre-sales engineer and handed to people who will not read code, such as the buyer, a security reviewer, an operations team, or an RFP evaluator. That is the difference from a software architecture diagram, which shows how the inside of one application is organized for the developers who build it. If you need that internal view, use the software architecture diagram generator instead; this page is for the picture you put in a proposal or a design review.
What a customer-ready solution architecture diagram contains
- Business context: the users, teams and external parties around the solution, and what each one does with it.
- System integration: the existing systems the solution connects to (CRM, ERP, identity provider, payment or shipping partners) and how, through an API gateway, an integration platform, files or events.
- Solution components: the major building blocks, named in the customer’s own words rather than in internal code names.
- Deployment topology: where each part runs (cloud, on-premises, zones, data centers) and how traffic and data move between them.
- Non-functional notes: short callouts for availability, recovery targets, security, performance and compliance, placed next to the component they apply to.
- Boundaries and legend: trust boundaries, what is in scope and what is not, and one line explaining the arrow and line styles.
Technical architecture diagram or solution architecture diagram?
The two terms overlap. People searching for a technical architecture diagram usually want the technology stack and how the pieces are deployed, which is the deployment and component part of a solution architecture diagram. A solution architecture diagram adds the business context and the integration with existing systems around it. In practice, one proposal often carries both: a context view on the first page, an integration or component view in the middle, and a deployment topology near the end. You can generate each view separately and reuse the same component names in every prompt, but consistency between views is not guaranteed, so check each one.
A solution architecture template you can reuse in a proposal
- Page 1, business context: the proposed solution in the center, actors on one side, external systems on the other, one short label on every arrow.
- Page 2, integration view: the systems being connected, the integration layer between them, and the identity and security path.
- Page 3, logical or layered view: business, application, data and technology layers, or the data platform stages if the solution is data-centric.
- Page 4, deployment topology: regions, zones or sites, load balancing, replication and failover, with the availability and recovery targets from the requirements.
- Aim for the same component names on every page so a reviewer can follow one thing across views, and check that each generated view really uses them.
Generate a solution architecture diagram from a description
- Name the solution, the people who use it, and the existing systems it must work with.
- List the components and say how they connect (API, events, files), and where each runs (cloud, on-premises, zone A or B).
- Add the non-functional targets you want shown, such as availability, recovery point and recovery time, encryption, or latency.
- Pick a 16:9 ratio for slides and proposals and click Generate. To change something, edit the prompt and generate again, then re-check the whole picture, because each generation redraws the entire image and other parts can change.
Check the draft before it goes to a customer
An AI-drawn diagram is a first draft, not a verified design. Before sending it, check that every box is a component you actually proposed, that each arrow points the way data or requests really flow, that labels are spelled the way the customer spells them, and that nothing was added that you did not ask for. Compare the numbers in badges with the signed requirements. The examples on this page are first drafts too: each caption lists the problems we found and did not fix, and your own diagrams need the same review. The generator draws generic shapes; it does not use any cloud vendor’s official icon set, so swap in vendor icons yourself if a customer requires them.
Frequently Asked Questions
Related Diagram Tools
 Diagrams
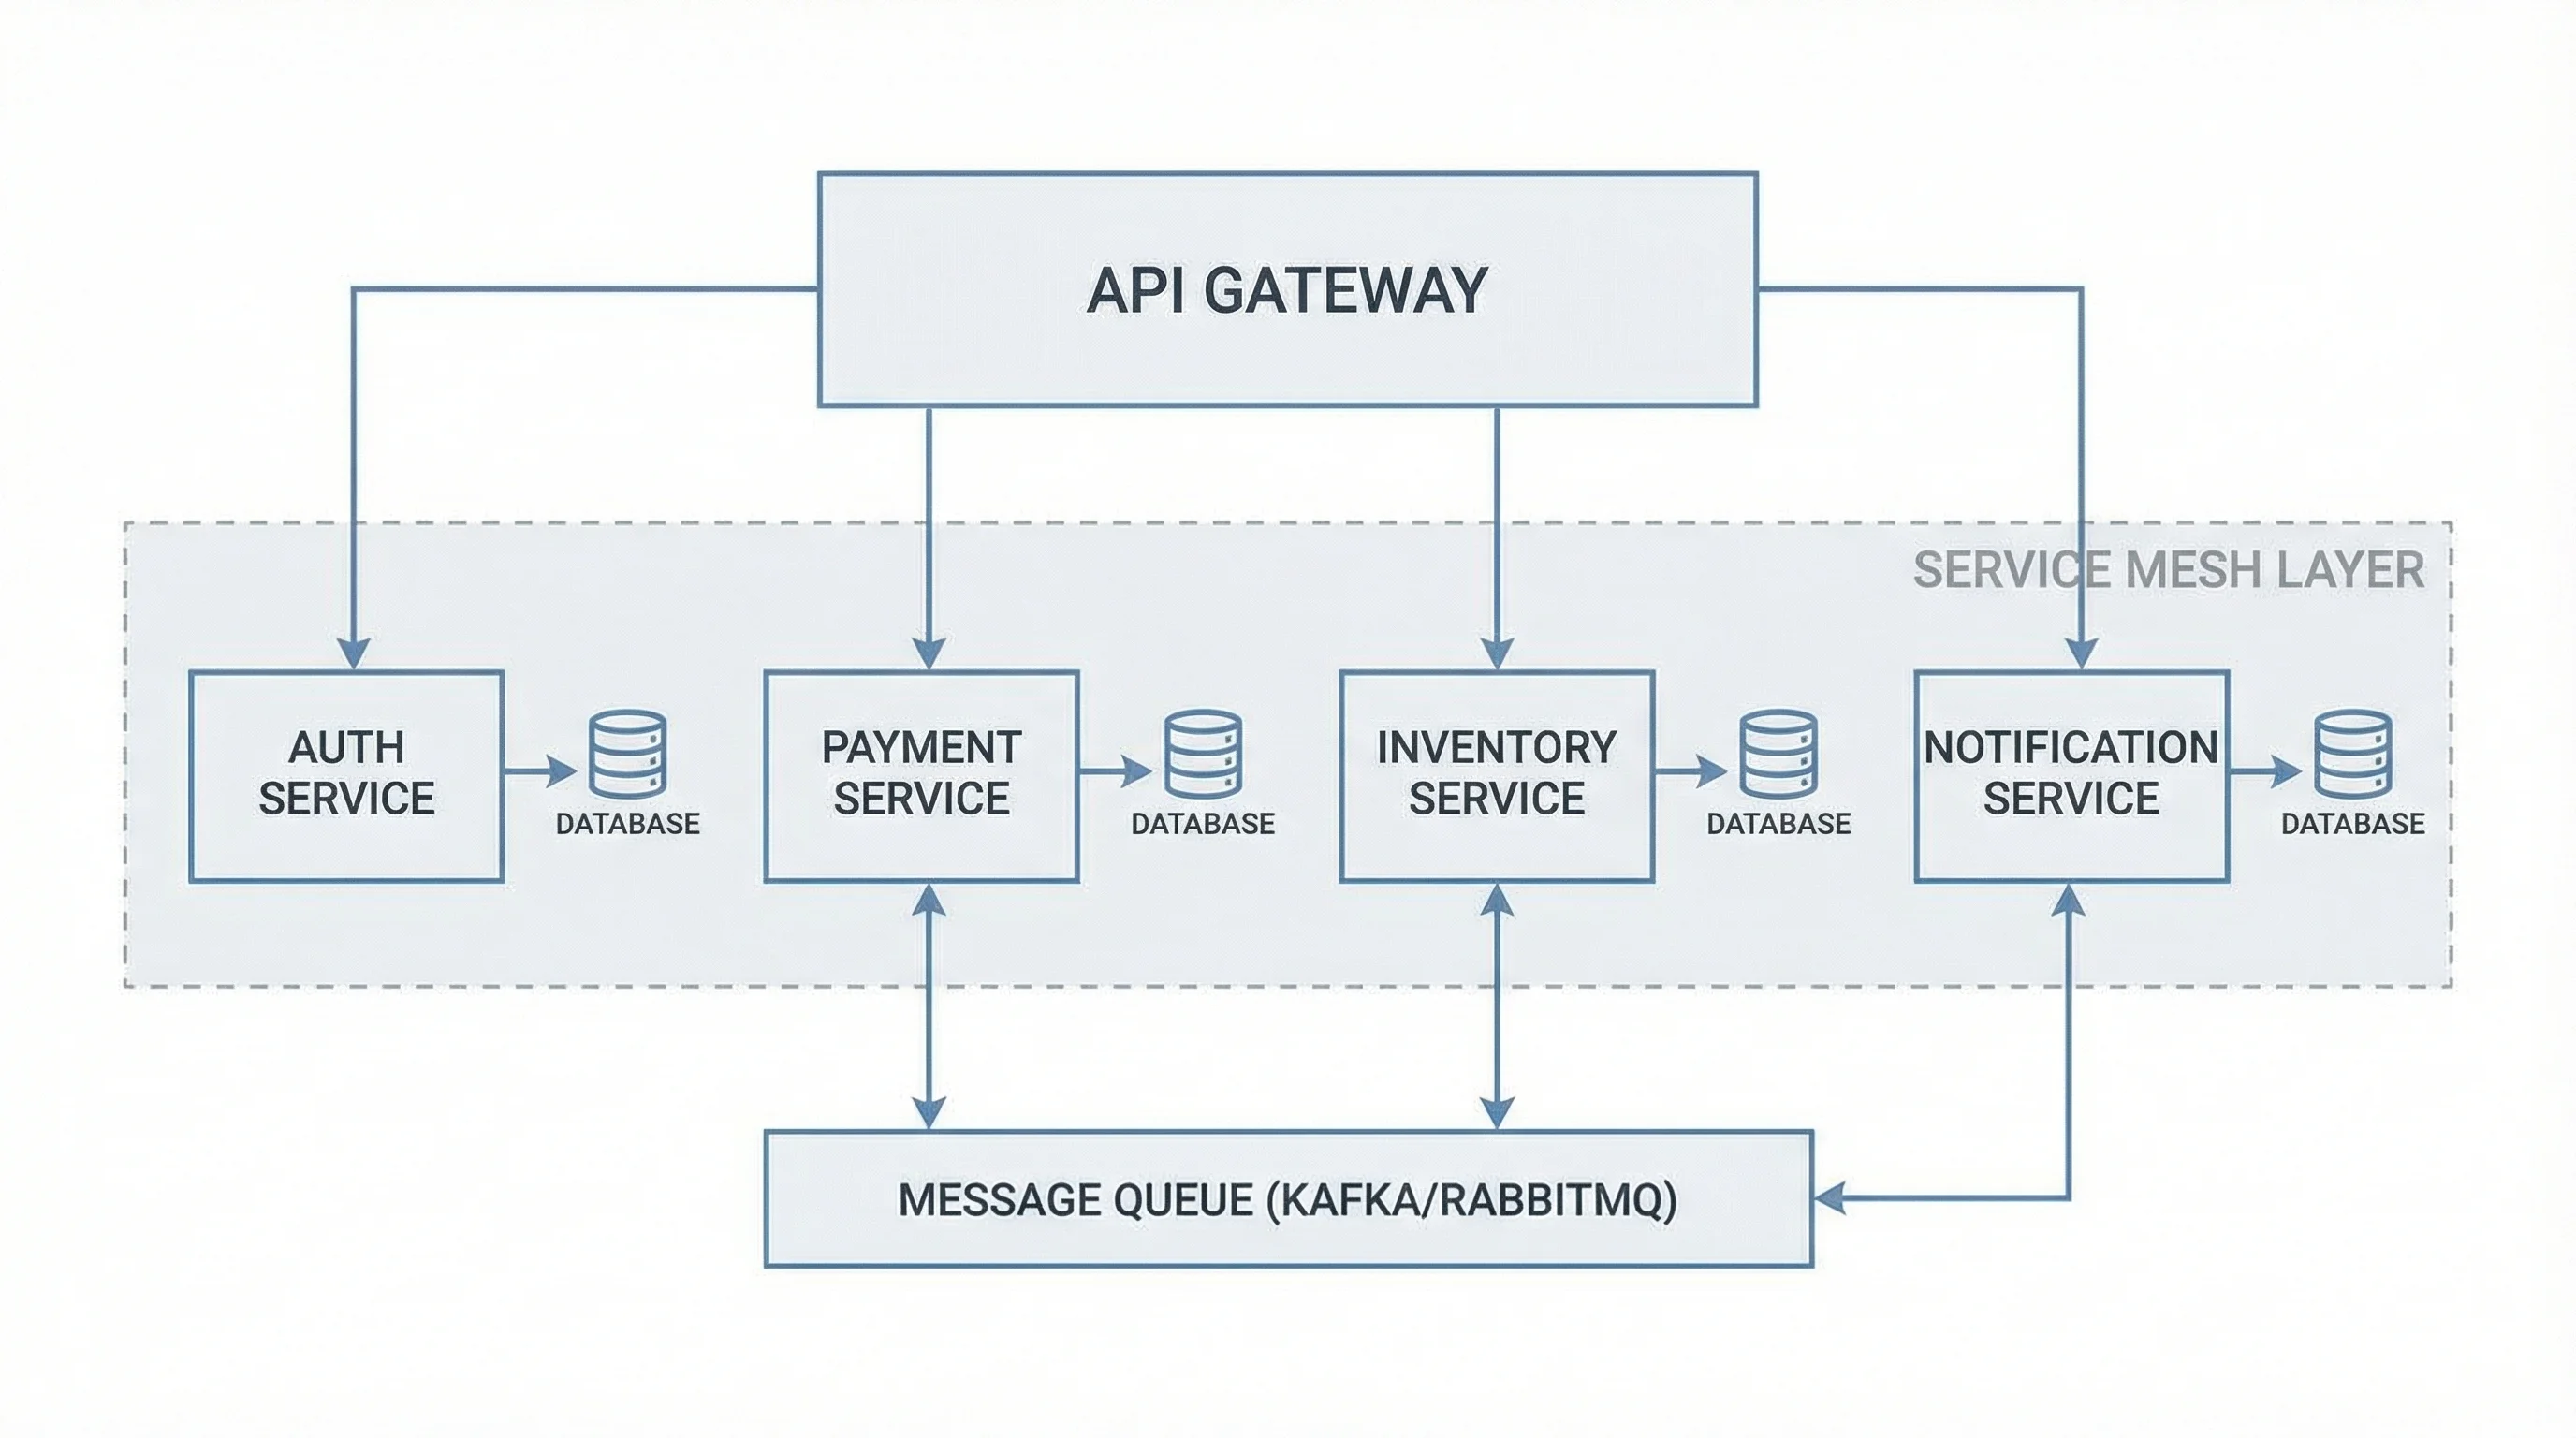
Software Architecture Diagram Generator
The developer view: services, layers, databases and queues inside one system.
 Diagrams
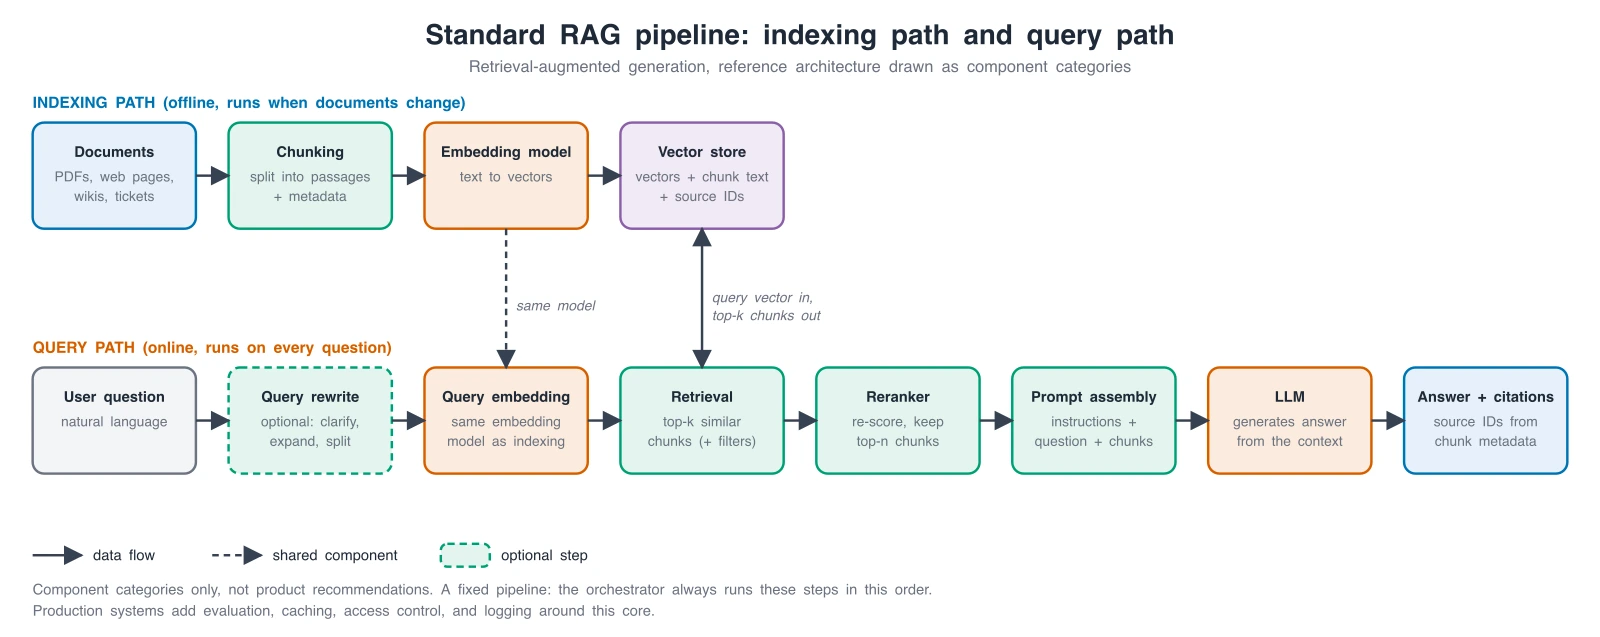
LLM App Architecture Diagram Generator
Draw the application around the model: RAG pipelines, agents, tools, and guardrails.
 Diagrams
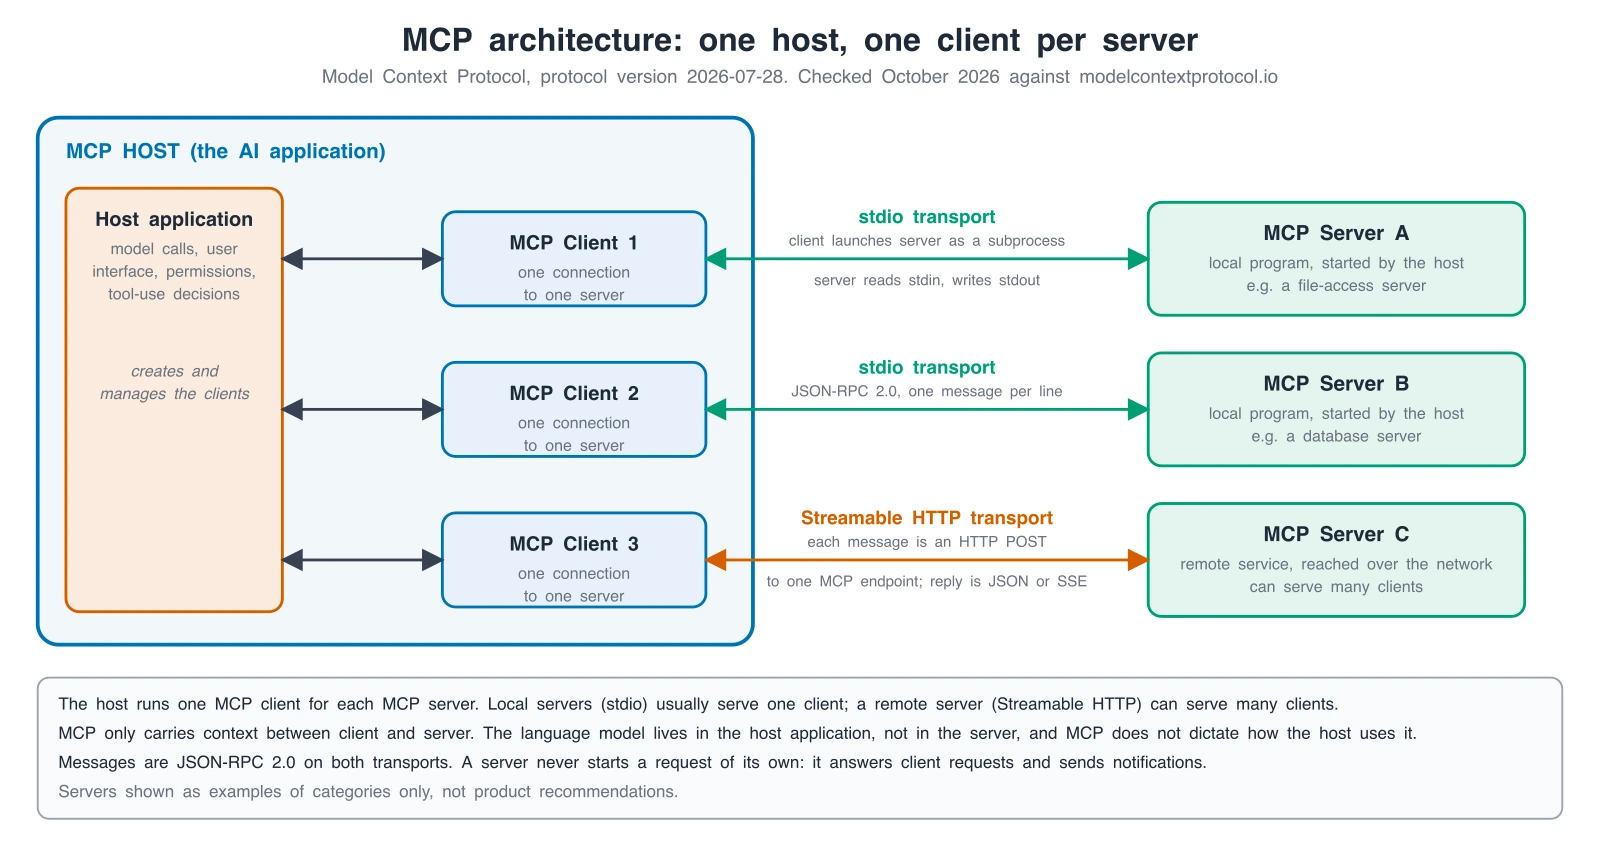
MCP Architecture Diagram Generator
Host, clients and servers over stdio and Streamable HTTP, with exact diagrams checked against the spec.
 Diagrams
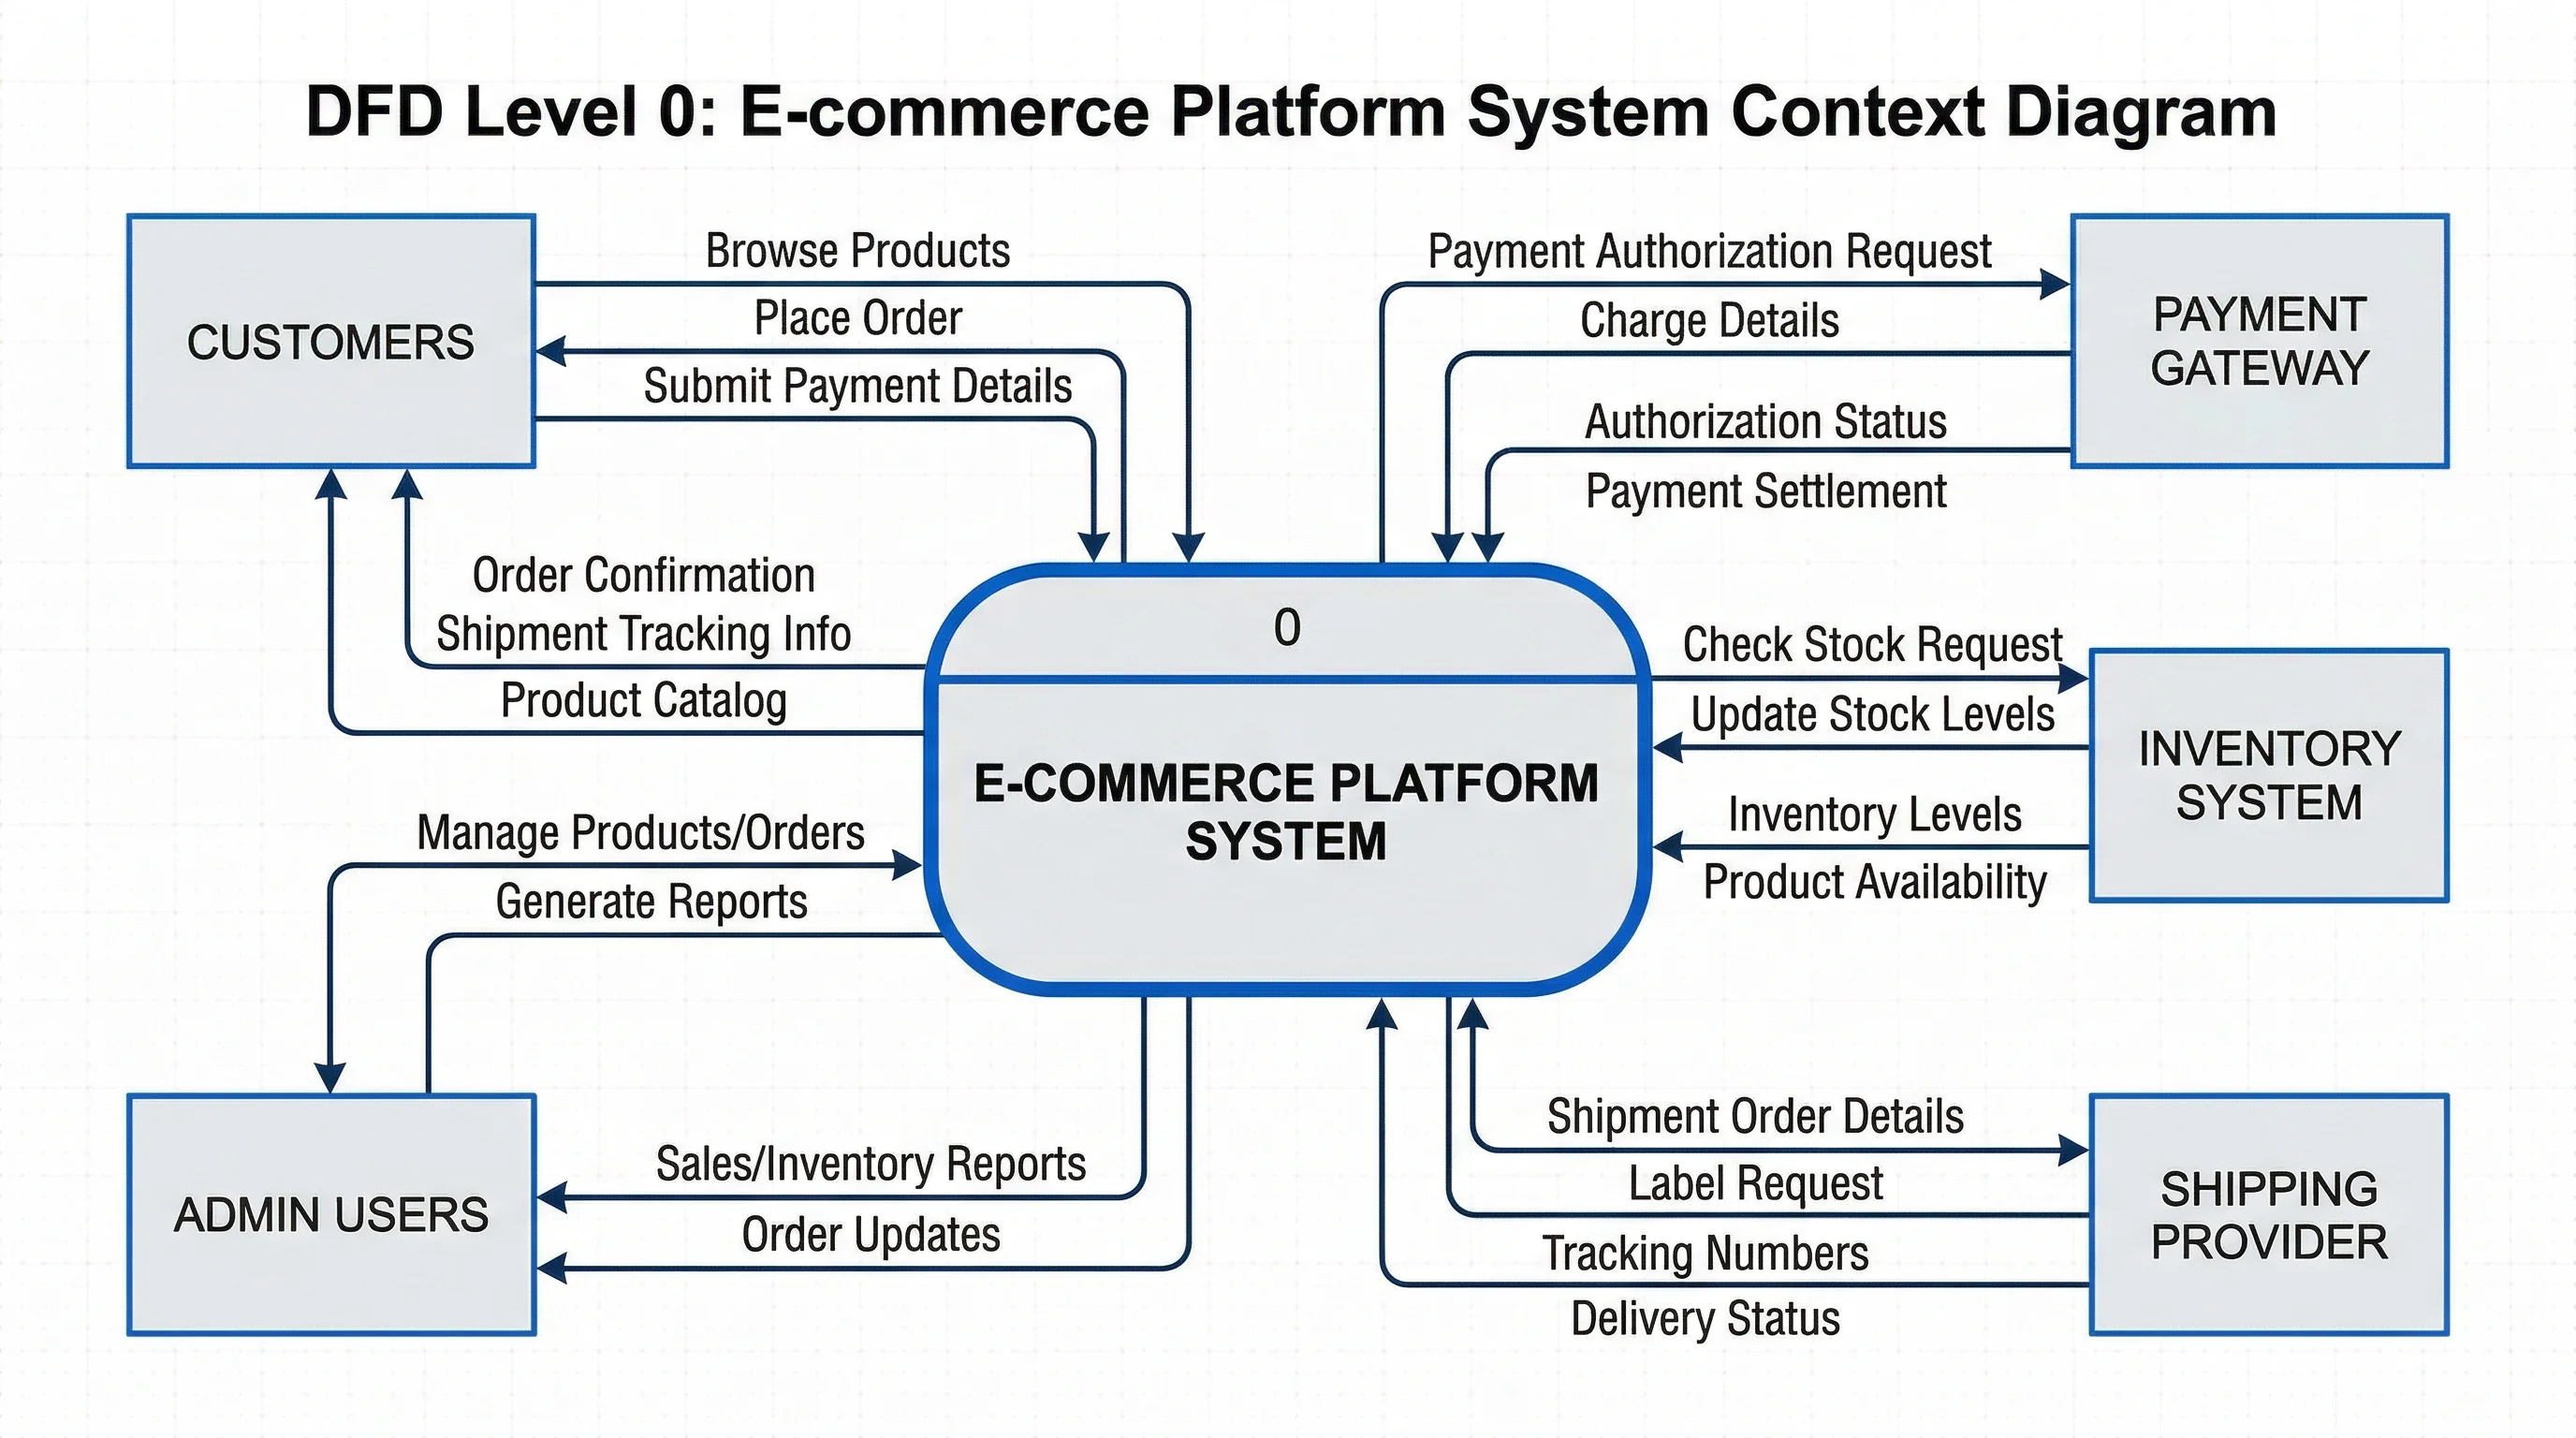
Context Diagram Generator
Show a system and the people and systems around it at the highest level.
 Diagrams
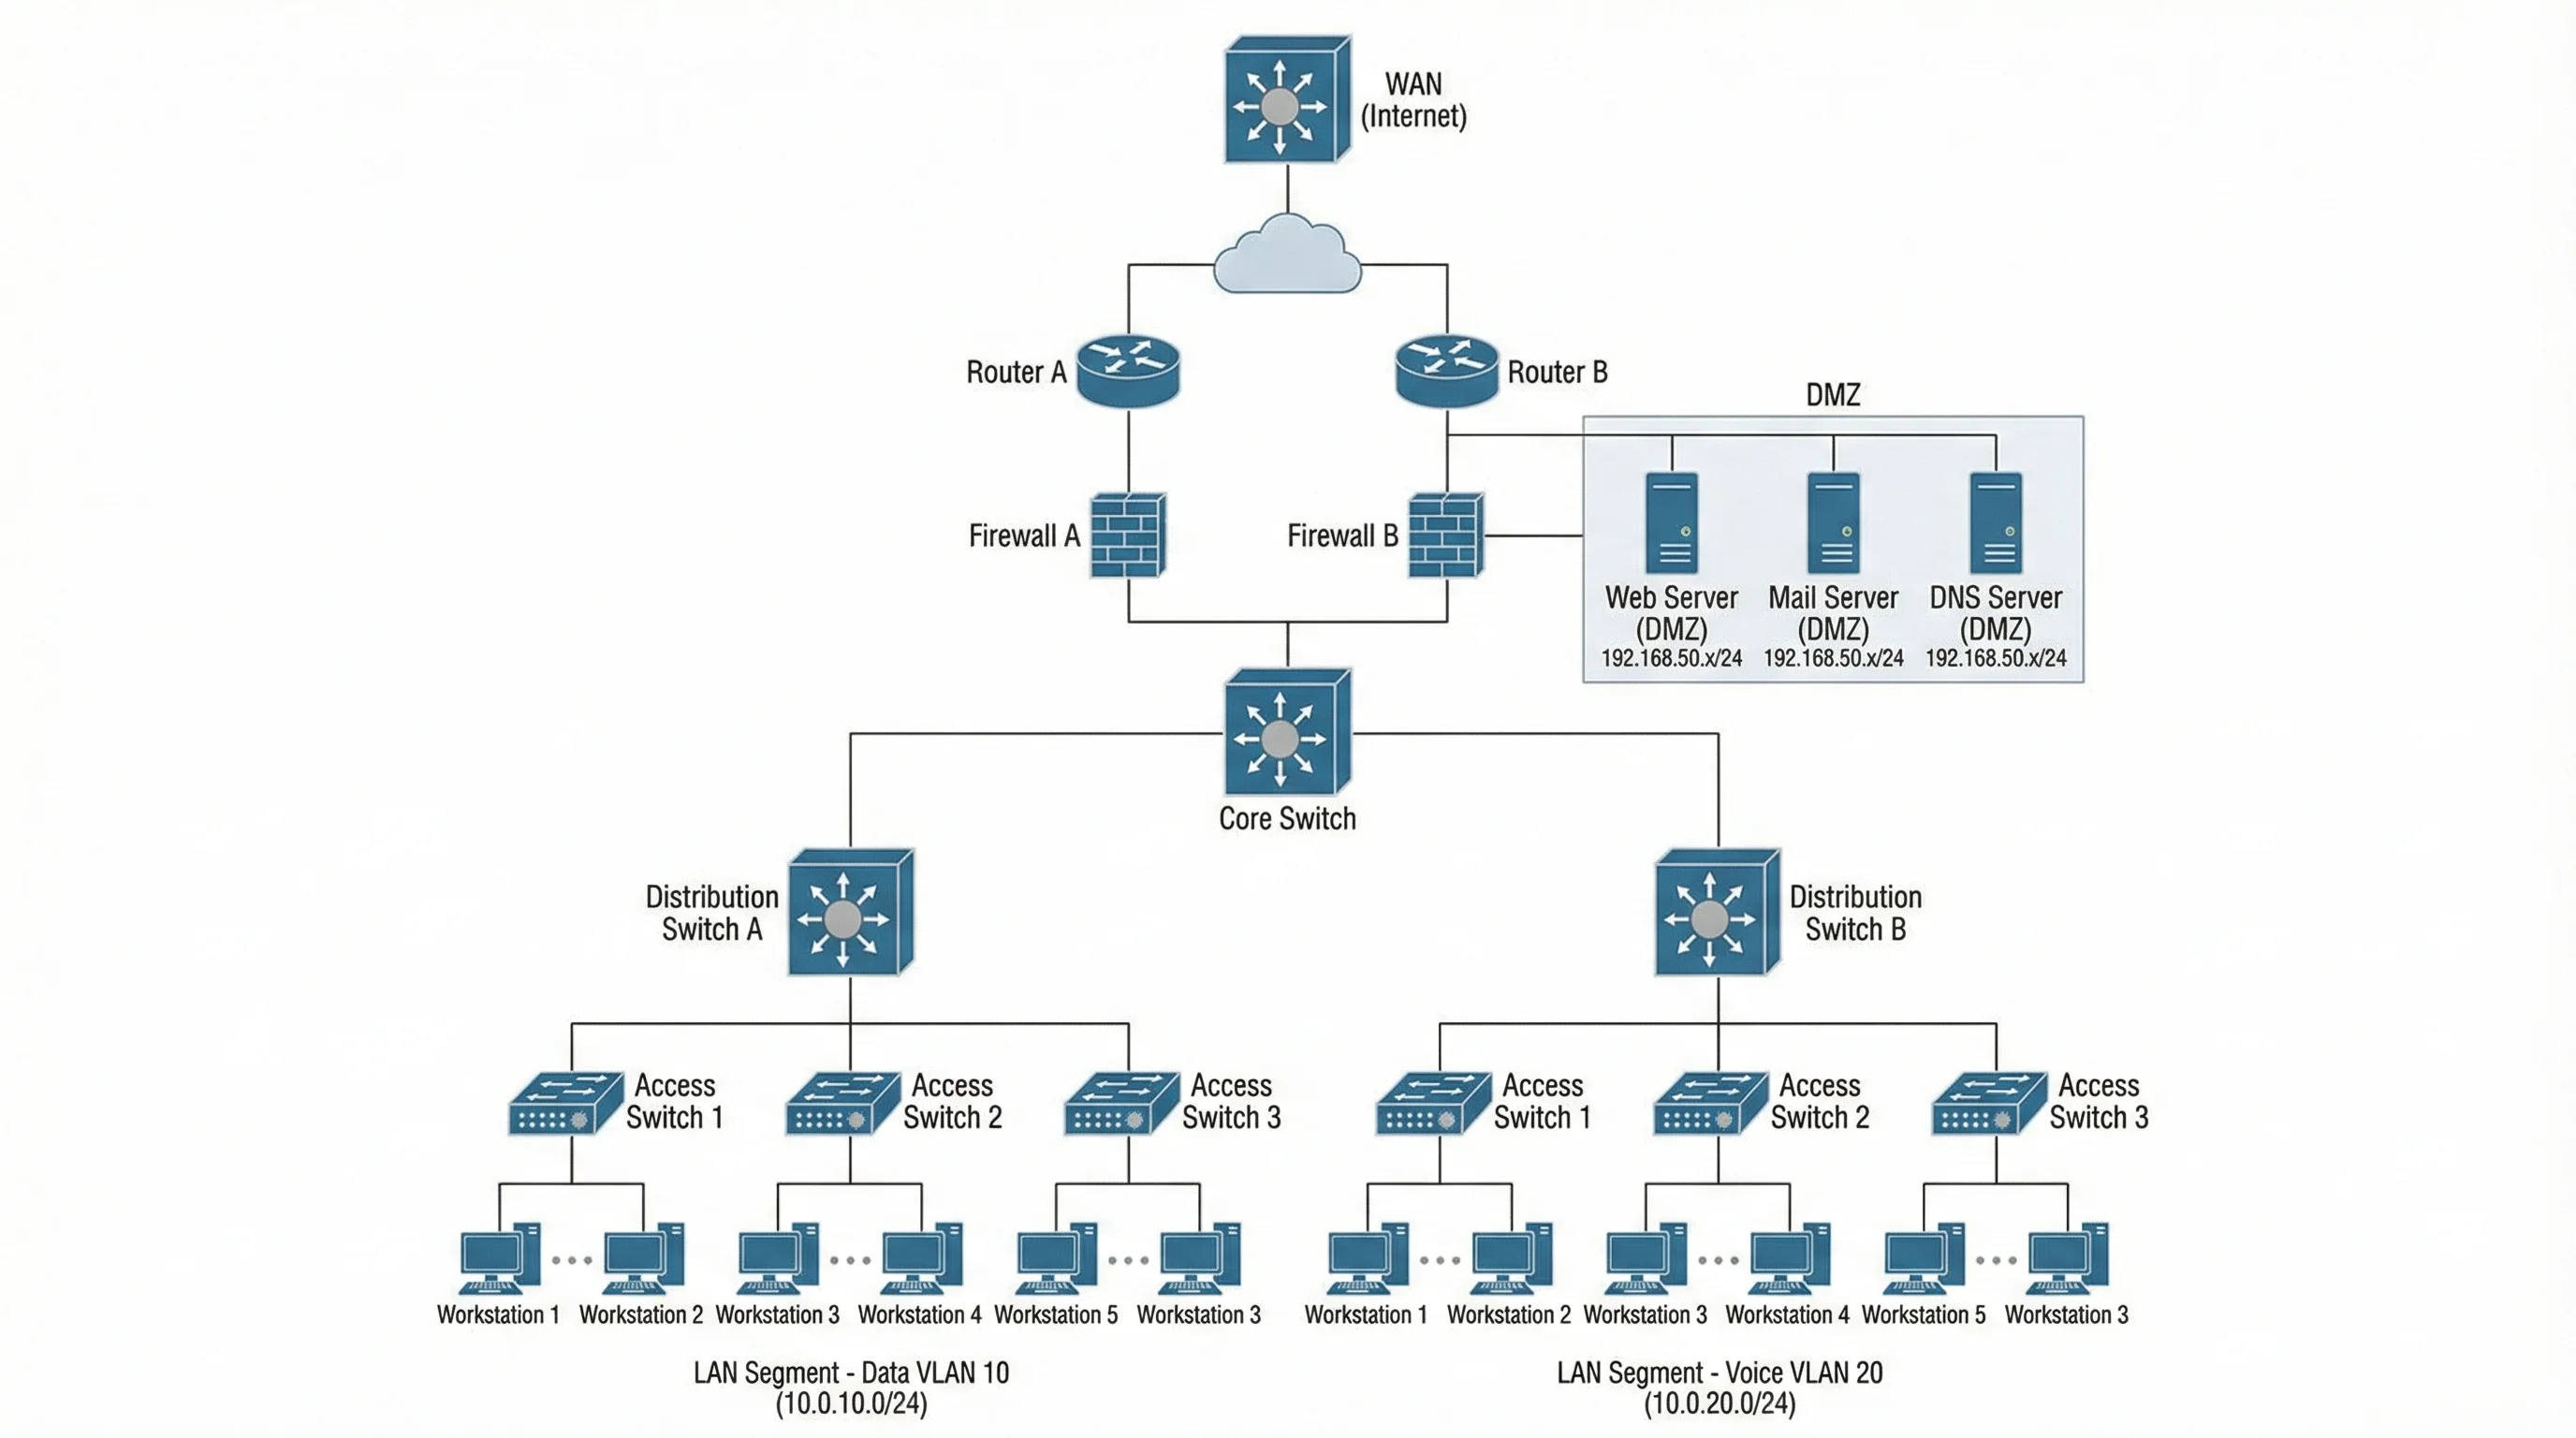
Network Diagram Generator
Map servers, routers, firewalls, and connections into a network topology diagram.
 Guides
Best AI Architecture Diagram Generators
Seven tools compared on price, editing and output, with real test diagrams.