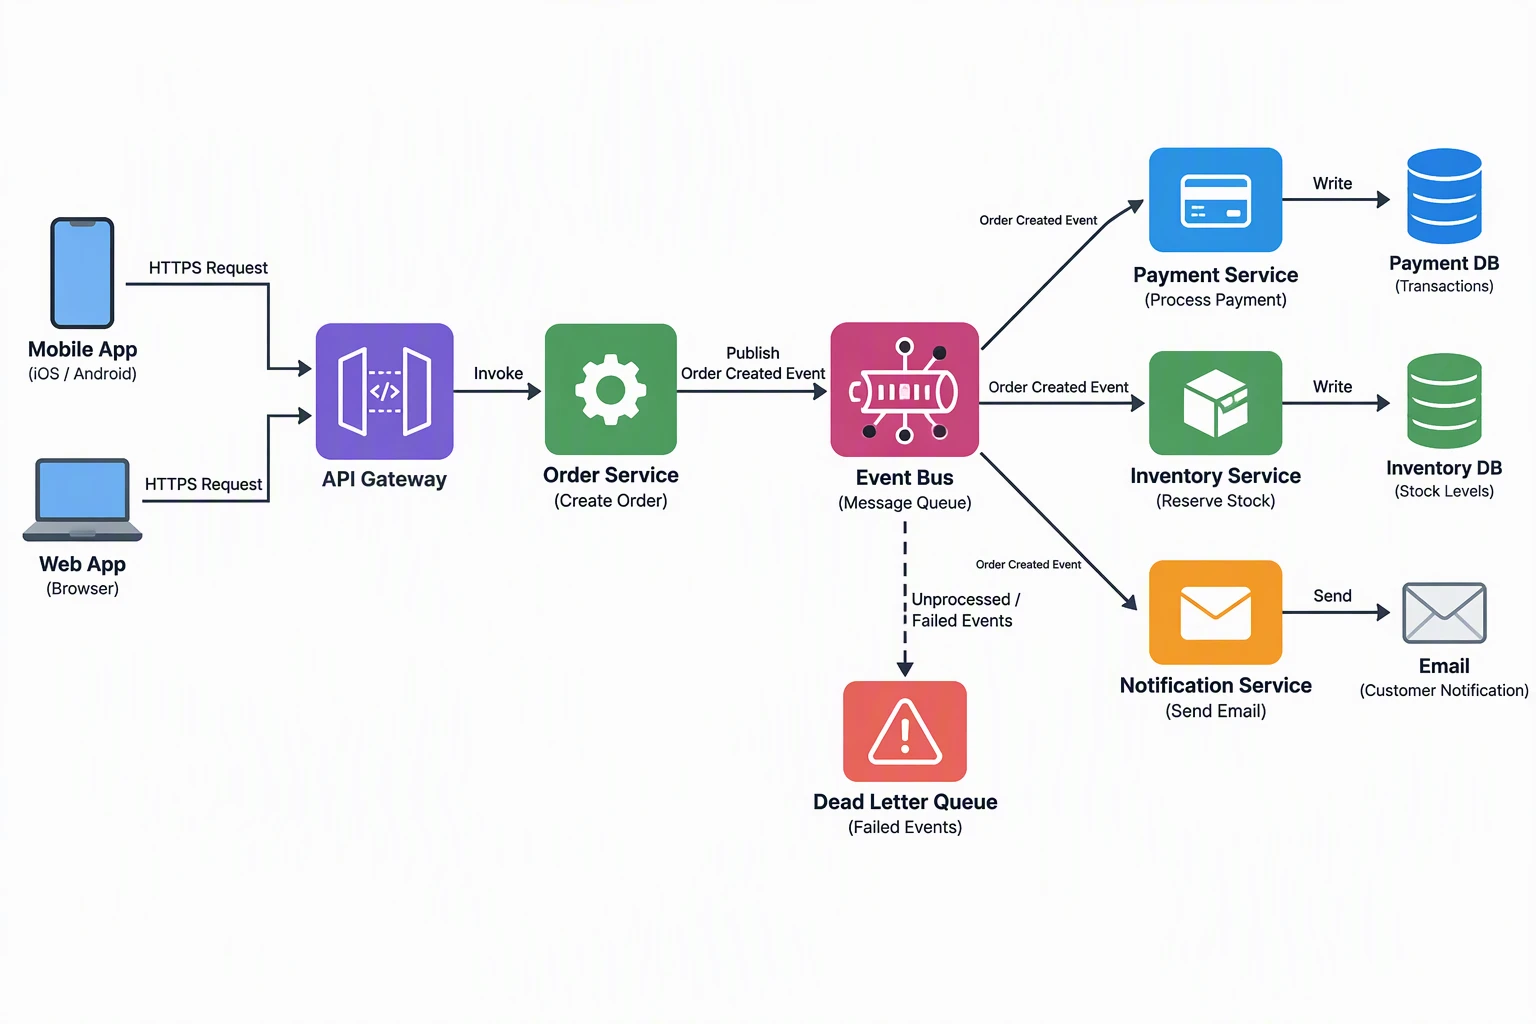
Best AI Architecture Diagram Generators: 7 Tools Compared
Compare 7 AI architecture diagram tools for software, cloud and LLM apps. Prices checked October 2026 on official pages, plus three real test diagrams.
The best AI architecture diagram generator depends on what you do with the diagram after it appears. If it has to stay editable on a shared canvas, look at Eraser, Lucidchart, Miro or draw.io. If it has to live in a repo as text, use Mermaid. If it has to match what is really deployed, Cloudcraft draws from live infrastructure data collected by Datadog instead of a prompt. A text-to-image drafter like ConceptViz is the smallest option here: it gives you a labeled picture in one pass, and you correct it by re-prompting rather than by dragging shapes.
This page covers software, cloud and AI-system architecture diagrams only. For UML, ER, flowcharts, Venn and the rest, read our broader AI diagram generators guide.
Prices and limits were checked on each vendor's own pages in October 2026. Where an official page could not be read, the table says "Not stated" and shows no number. Confirm before you buy.
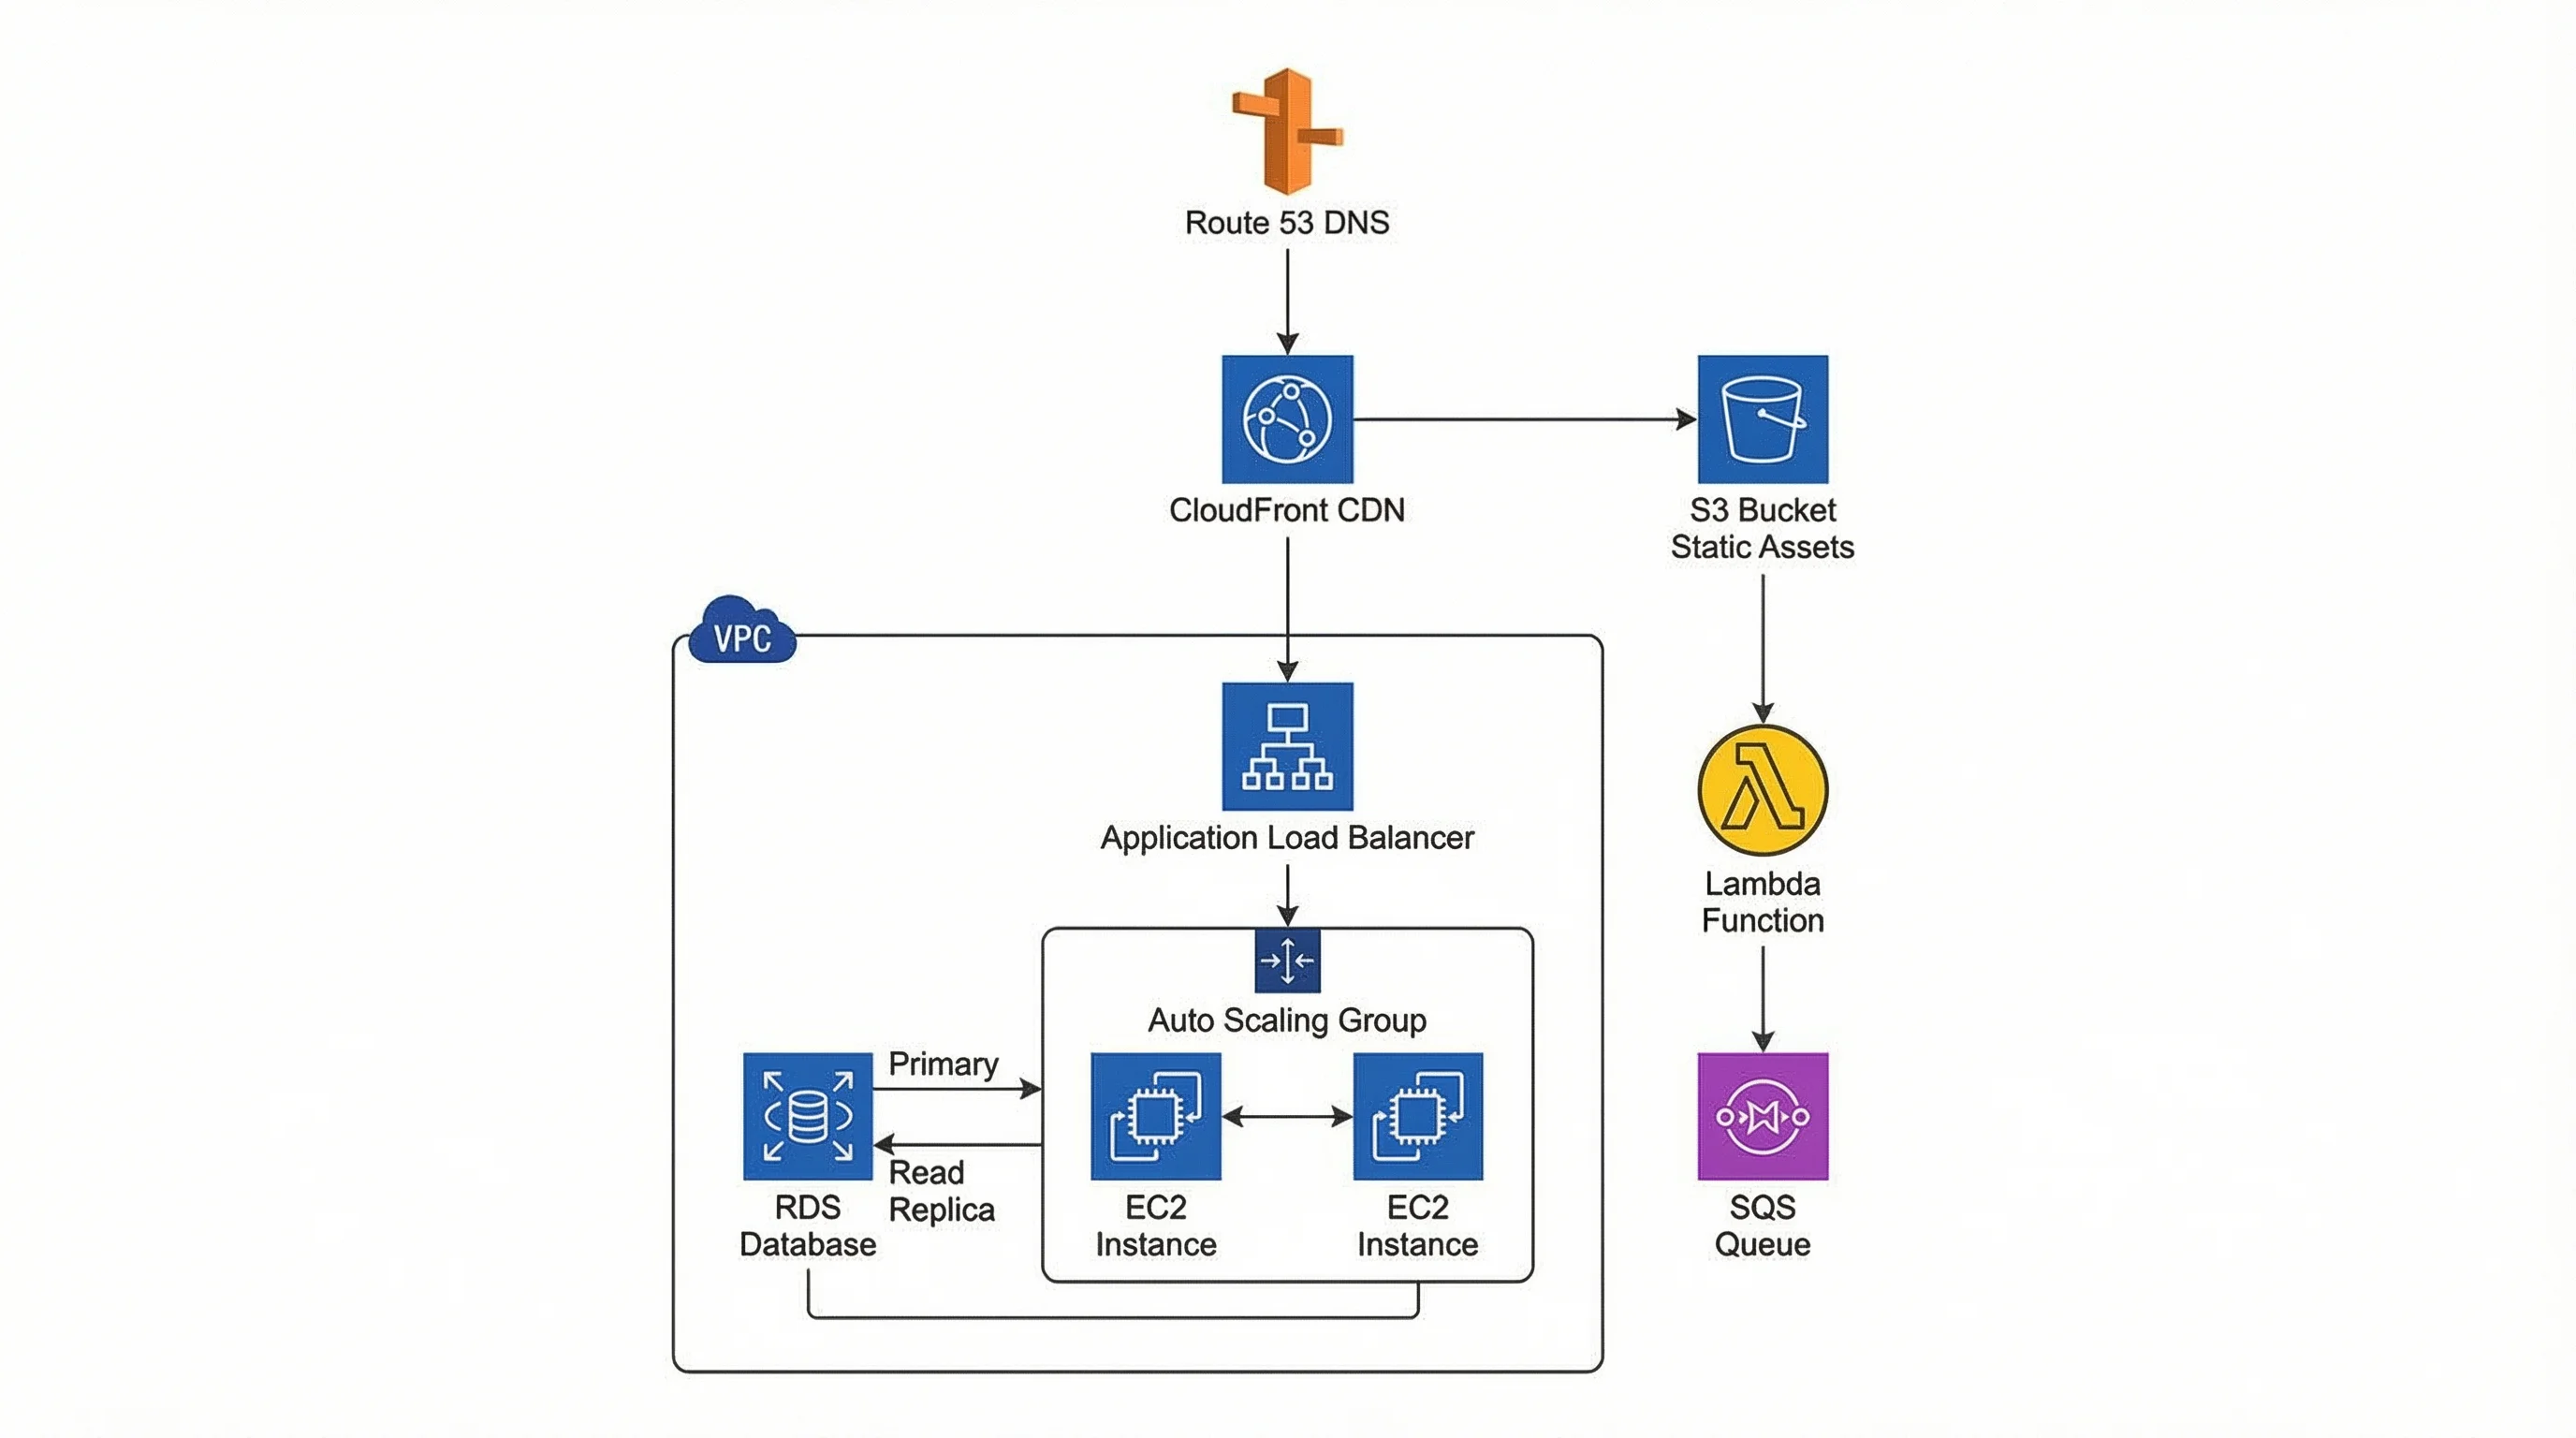
Software Architecture Diagram Generator
Describe services, databases, queues and clients in plain English and get a labeled architecture diagram image for design docs and slides.
Draft an architecture diagram →Quick picks
- Editable diagram from a prompt, with real-time team editing: Eraser, Lucidchart or Miro.
- Free, no account, with a built-in Generate tool: draw.io.
- Diagram as code that lives next to your source: Mermaid.
- Always-current AWS, Azure and GCP diagrams from a live account: Cloudcraft.
- A quick labeled picture for a doc or slide, from one sentence: ConceptViz.
How we checked
We did two different things, and the page keeps them apart.
- Competitor tools: official pages only. We read each vendor's own product, documentation and pricing pages. We did not create accounts with them or run their generators, so nothing below says how any of them performs. Where we describe a feature, the sentence says it comes from the vendor's page.
- ConceptViz: three real runs. Before writing this page we generated three architecture diagrams with ConceptViz's image generator (a three-tier web app, a cloud event-driven system and a RAG app), one pass each, with prompts we wrote ourselves. We looked at every image and list the problems we found under it.
Comparison table
The input column says how you create the diagram. The output column says what you get back. Both come from the vendor pages linked in each row.
| Tool | Input | Output | Price (checked October 2026) | AI limits stated |
|---|---|---|---|---|
| Eraser | Prompt, pasted code or documents | Editable canvas; diagram-as-code; export to PDF, PNG, SVG, MD | Free $0; Starter $15 per member per month billed annually ($20 monthly); Business $45 ($60 monthly); Enterprise custom | 3 / 40 / 250 AI credits (diagrams and outlines) on Free / Starter / Business |
| Lucidchart | Prompt, optional attached file | Editable canvas | Free US$0; Individual US$9 per month billed annually; Team US$10 per user per month billed annually | Not stated |
| Miro | Prompt, or existing board content | Editable diagram on a shared board | Free $0; Starter $8 per member per month billed yearly; Business $20 per member per month billed yearly | Free: "Limited trial"; Starter 25 and Business 50 AI credits per member per month |
| draw.io | Prompt in the Generate dialog, or pasted Mermaid text | Editable draw.io shapes | Free; Apache 2.0 licensed source code | Not stated |
| Mermaid | Prompt, document upload or Mermaid code | Diagram built from code | Basic free; Plus $10 per user per month billed annually; Premium $20 per user per month billed annually | Basic "Limited AI"; Plus 300 and Premium 2,000 AI credits per year |
| Cloudcraft | Live infrastructure data collected by Datadog (not a prompt) | Live architecture diagram | Free with any Datadog subscription; Datadog's own price Not stated | No AI generation described |
| ConceptViz | Plain-English prompt | Image (PNG); traced SVG after buying a credit pack; editable SVG and PPTX export on the Agent subscription (not tested here) | 2 trial credits at sign-up; credit packs from $4.99 (8 credits); optional subscription from $29.90 per month | About 1 credit per standard image |
Two notes. Miro's pricing page and its AI diagram page describe the free plan's AI allowance differently (the first says "Limited trial", the second gives a monthly number per team), so we show the pricing page. And we show Miro's yearly-billing prices only, because that is what the page text we read stated.
What kind of tool do you need?
Searches for "AI architecture diagram generator" mix four jobs, and picking the wrong one is the usual mistake.
| Job | What you get | Typical tools | Edit by |
|---|---|---|---|
| Prompt to editable diagram | Shapes and connectors you can move | Eraser, Lucidchart, Miro, draw.io | Dragging, or follow-up prompts |
| Diagram as code | Text that renders to a diagram | Mermaid, Eraser's diagram-as-code | Editing the text |
| Live infrastructure map | A diagram drawn from live infrastructure data collected by Datadog | Cloudcraft | Changing the infrastructure |
| Prompt to image | A finished picture | ConceptViz | Re-prompting (editable SVG export exists on the Agent subscription, which we did not test here) |
If a teammate will rearrange the boxes next week, you want one of the first two. If the diagram is documentation of what is actually deployed, the third is closer to the truth than any prompt. If you need a clean picture for a slide, a design doc or a blog post and nobody will edit it, the fourth is enough.
The tools one by one
All descriptions in this section come from the vendors' own pages, linked in each paragraph.
Eraser
Eraser's DiagramGPT page presents it as an AI diagram generator that creates diagrams from text prompts, and its architecture diagram generator page says you describe the system in plain English or paste in code. The page advises listing the components and groupings first, then how data or a request moves through them, and says follow-up prompts and manual layout changes require signing in. Eraser's pricing page lists a Free plan with 3 files and 3 AI credits, Starter at $15 per member per month billed annually, and Business at $45, plus export to PDF, PNG, SVG and MD on every plan. Its page also lists AWS, Azure, GCP, Terraform and Kubernetes generators.
Lucidchart
Lucid's pricing page lists a free plan with 3 editable documents and 75 shapes per document, Individual at US$9 per month billed annually, and Team at US$10 per user per month billed annually, and it marks Lucid AI as new. It does not state an AI usage limit, so the table says so. Lucid's AI flowchart generator page describes typing a description or attaching a file and getting a diagram on the canvas that you can edit, restyle and re-layout. That page is written about flowcharts and does not single out architecture diagrams, so for system diagrams check that the shape libraries you need are on your plan.
Miro
Miro's AI diagram generator page says you describe a process, system or concept in text and get an editable diagram on a shared board, and lists system architectures among the diagram types. It also says existing board content (sticky notes, requirements) can act as the prompt. The pricing page shows a Free plan with 3 boards, Starter at $8 per member per month billed yearly with 25 AI credits per member per month, and Business at $20 with 50, and says Business includes 4,700+ shapes for technical systems, including Mermaid, UML and AWS. It fits teams that already run workshops and design reviews on Miro boards.
draw.io
draw.io's home page says it is free, needs no sign-up, and has Apache 2.0 licensed source code. Its documentation describes a Generate tool (the sparkle button, or Arrange > Insert > Generate) that sends a text query to AI generators and previews a diagram you can add to the canvas and edit like any other. The same page says to start the query with the diagram type because each generator is good at only a small subset of diagrams, and warns that AI tools may not return sensible results. A separate Mermaid page explains pasting Mermaid text and converting it into native draw.io shapes. It is the free choice in this list.
Mermaid
Mermaid is the commercial product from the team behind the open-source Mermaid.js library. Its home page describes prompting inside a canvas, dropping in a document, or writing code, and generating diagrams from Claude, VS Code and Cursor through an MCP server. The pricing page lists Basic (free, 3 diagrams, limited AI), Plus at $10 per user per month billed annually with 300 AI credits per year, and Premium at $20 with 2,000 AI credits per year. Note that these AI allowances are per year, not per month. It suits teams who want diagrams versioned as text beside the code.
Cloudcraft
Cloudcraft is a different kind of tool. Its home page describes live AWS, Azure, Google Cloud, Oracle Cloud and VMware vSphere diagrams that update as infrastructure changes, with alerts, logs, security findings and cost overlaid. Its pricing page says it is free with any Datadog subscription; the price of that subscription is not on the page, so we show "Not stated". We found no prompt-based generation described on these pages, so we list it for the case where the real answer to "show me our architecture" is "read it from live infrastructure data collected by Datadog".
Where ConceptViz fits, and where it does not
ConceptViz's software architecture diagram generator turns a plain-English description into a labeled image of the system. It is for design docs, slides, blog posts and early sketches. It is not an editable canvas: you cannot drag a box, and the shapes are not diagram objects. You change a diagram by editing the prompt and generating again. Downloads are a PNG image, or a traced SVG after buying a credit pack, and a traced SVG is a vector copy of the picture, not an editable architecture file. There is a separate route: per our facts sheet, an Agent subscription can export editable SVG (Standard, Pro and Max, 2 credits each) and PPTX (Pro and Max only, 4 credits each), and image credit packs do not include Agent SVG or PPTX export. We did not test that route for this article, so we cannot say how editable an architecture diagram comes out.
New accounts get 2 image credits, valid for 7 days, with no card required. One-time credit packs start at $4.99 for 8 credits, and an optional subscription starts at $29.90 per month. A standard image costs about 1 credit.
Two sibling pages cover narrower cases: the RAG and LLM app architecture diagram generator and the MCP architecture diagram generator, which also carry exact reference diagrams for those two topics.
What three real runs looked like
We wrote three prompts and ran each once, with no retries and no editing. Each prompt was sent with a short style suffix: "Wide landscape composition, clean technical diagram style on a white background. Keep a generous white margin so all labels sit fully inside the frame. Do not crop text." We then checked every label and arrow by eye. This tests how well the image generator follows a structural description. It is not a test of the tool's page, and it is three samples, not a benchmark.
Test 1: Three-tier web application
Prompt: "Software architecture diagram of a three-tier web application. Left to right: Browser (Presentation tier), Load Balancer, two Web Server instances, then Application tier with API Service and Auth Service, then Data tier with PostgreSQL Primary, PostgreSQL Replica and Redis Cache. Arrows show request flow from Browser to Load Balancer to Web Servers to API Service to Database, with response arrows returning. Three labeled tier boundaries: Presentation, Application, Data."
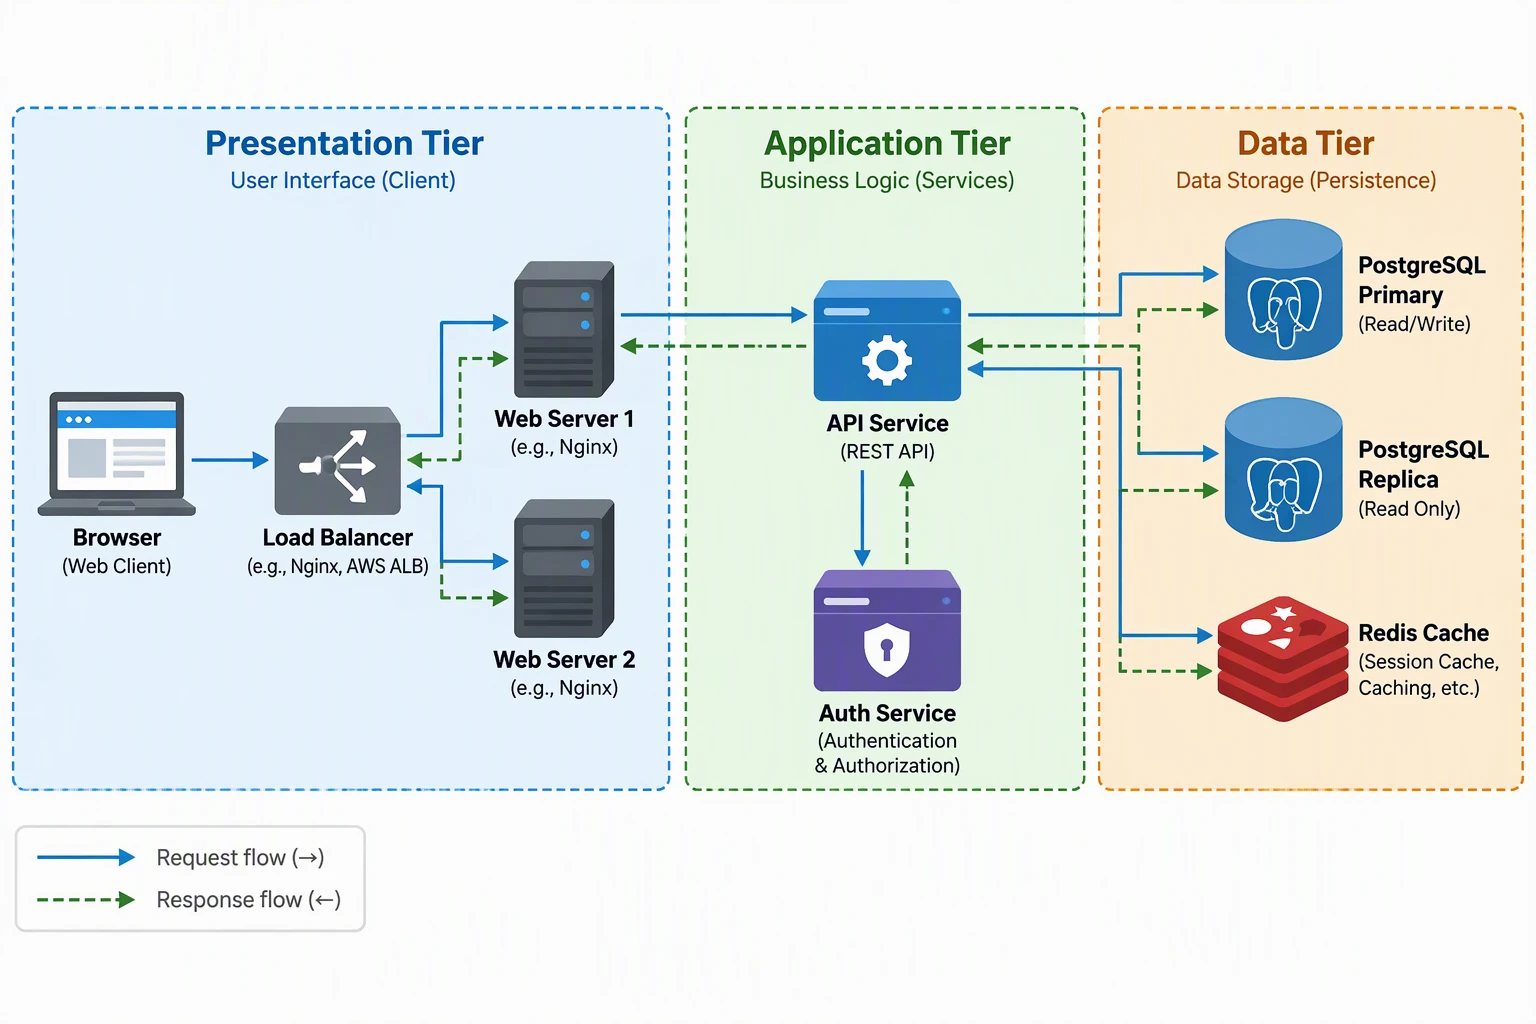
Generated from the prompt above. Several arrows are wrong, so do not reuse it as is. Correct: every named component is present and spelled correctly, the three tier boundaries are labeled, and the request path from browser to load balancer to web server to API service to the data stores reads left to right. Problems: the legend labels the green dashed arrow "Response flow" with a left-pointing arrow symbol, but the legend's own arrow points right, and the green arrows that enter the database boxes point right too, so response direction is drawn inconsistently. A blue request arrowhead also points back into the API Service from the data tier side, and the green dashed line between the Load Balancer and Web Server 1 has an arrowhead at both ends. Web Server 2 has no connection to the API Service, and the Browser has no return arrow. The load balancer and web servers sit inside the Presentation box because of how we ordered the prompt. The image also added example product names (Nginx, AWS ALB) and database logos that we did not ask for. Fix these before using it.
Test 2: Event-driven system on the cloud
Prompt: "Cloud event-driven architecture diagram. Left to right: Mobile App and Web App send requests to API Gateway, which invokes an Order Service that publishes events to an Event Bus (Message Queue). The Event Bus fans out to three subscribers: Payment Service, Inventory Service, Notification Service. Payment Service and Inventory Service write to their own databases, Notification Service sends Email. A Dead Letter Queue is attached to the Event Bus. Arrows show event direction."
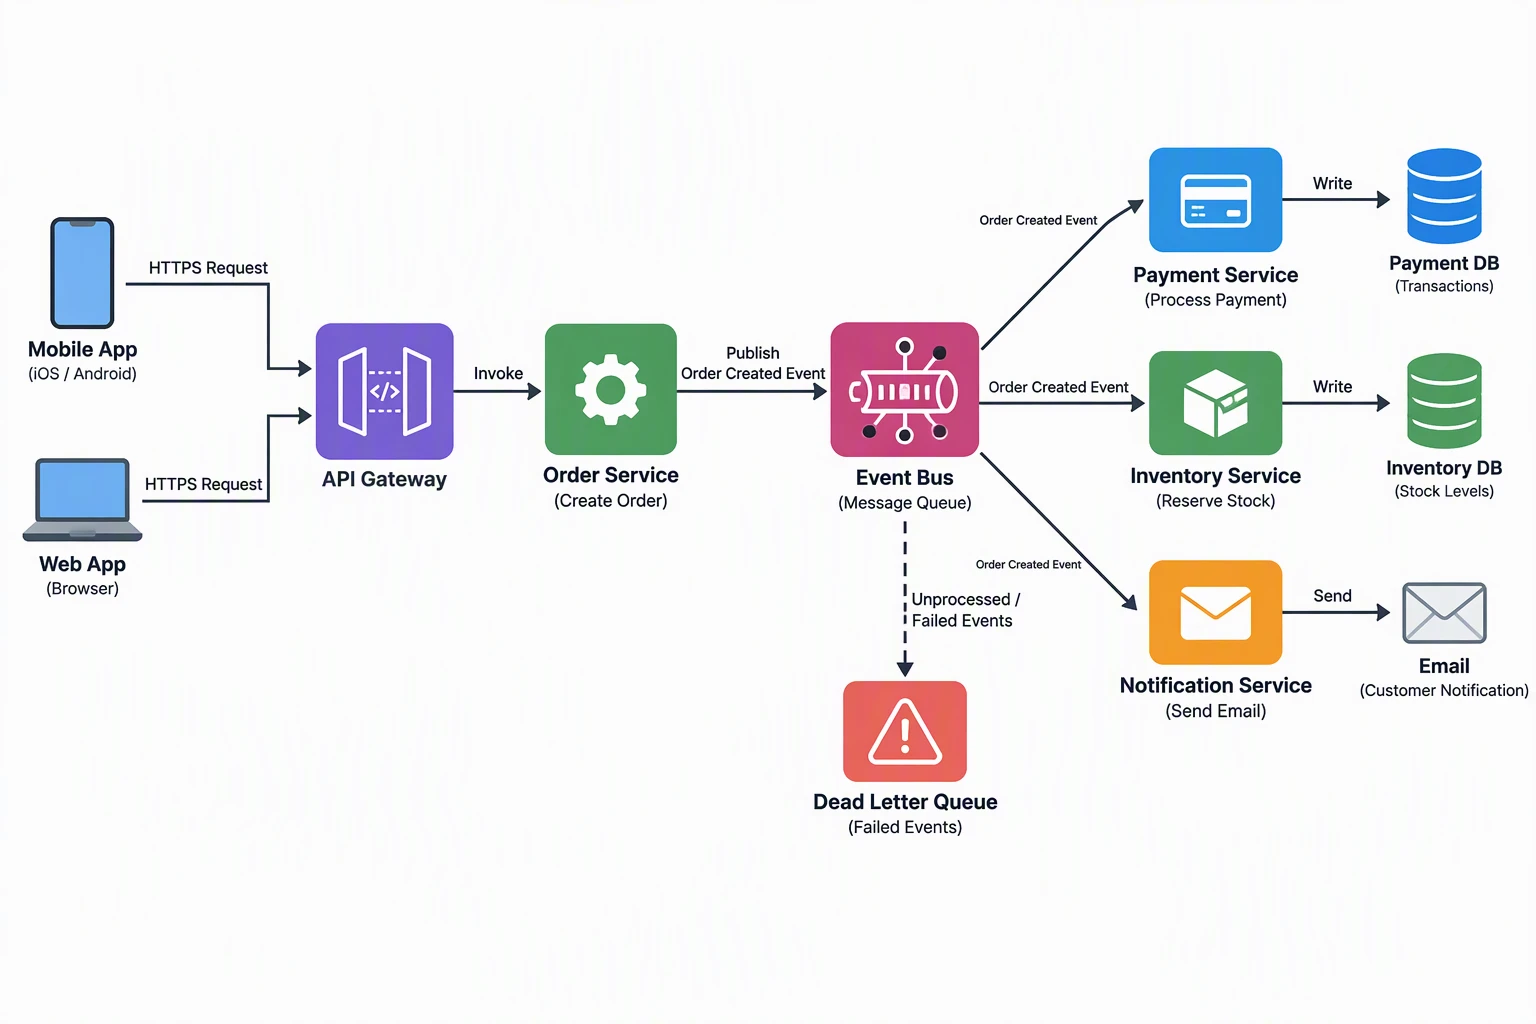
Generated from the prompt above. This was the cleanest of the three. Correct: all components are present, the apps feed the gateway, the gateway invokes the Order Service, the Order Service publishes to the Event Bus, the bus fans out to the three subscribers, each subscriber's output (database or email) is on its right, and the Dead Letter Queue hangs off the bus with a "failed events" arrow. Problems: the three fan-out arrows carry the same invented label, "Order Created Event", in small type that is hard to read at slide size, and the diagram adds an event name we never specified. Nothing returns to the clients, which matches the prompt but would need an acknowledgement arrow in a real design.
Test 3: RAG application
Prompt: "RAG LLM application architecture diagram. Two flows. Indexing flow: Documents, Chunking, Embedding Model, Vector Database. Query flow: User, Chat UI, API Server, Query Embedding, Vector Database retrieval of top-k chunks, Prompt Builder combining the question and retrieved context, LLM, Answer returned to the user. Also show a small Cache and an Observability box. Arrows show data flow direction."
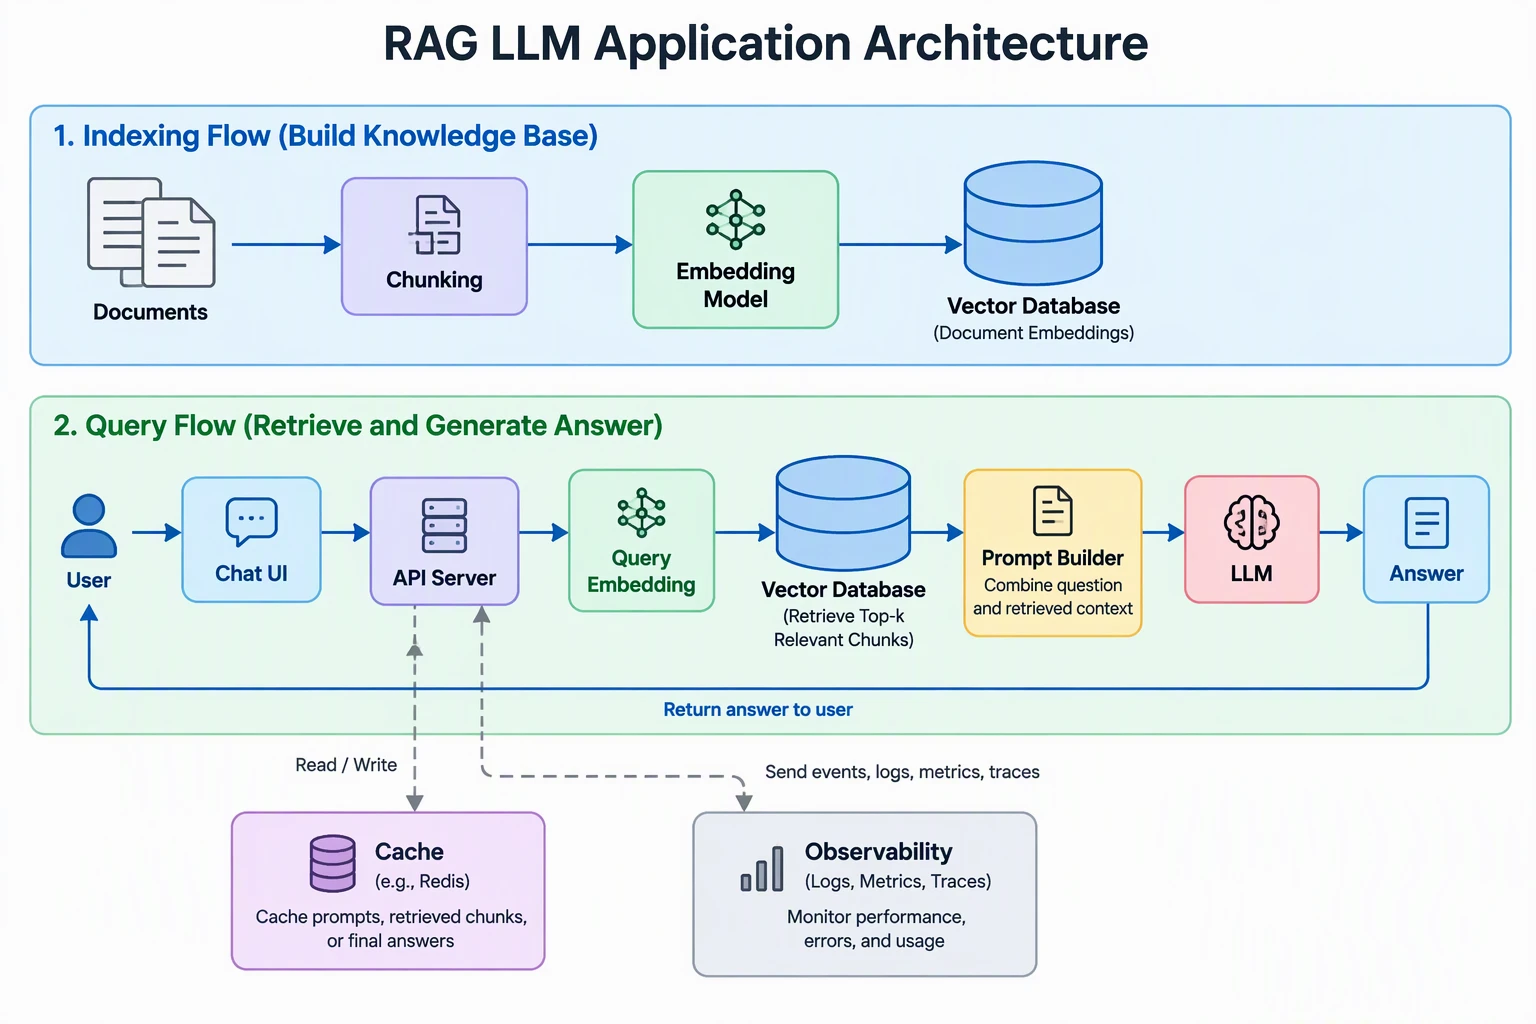
Generated from the prompt above. Correct: both flows are present in labeled bands, the indexing chain and the query chain read left to right, and the answer loops back to the user. Problems: the Vector Database is drawn twice with nothing connecting the two, so a reader cannot tell the indexing flow writes to the same store the query flow reads; the user's question never gets its own arrow into the Prompt Builder (only the retrieval chain does, even though the label says "combine question and retrieved context"); the Answer arrow goes straight to the User and skips the Chat UI and API Server; and Cache and Observability connect only to the API Server. The image also added a title we did not ask for.
What the runs say. On three structured prompts, component names and the main left-to-right flow came out right every time, and the errors were in secondary arrows: direction conventions, a missing connection, a duplicated store. That is evidence about drafting a picture quickly, not a promise for large systems, and it is why we tell readers to check every arrow against the real design. If the diagram has to stay editable, be reviewed in a canvas by a team, or be generated from code or from your cloud account, use one of the tools above instead.
How to choose
| If you are... | Start with | Why |
|---|---|---|
| A team that edits diagrams together | Eraser, Lucidchart or Miro | Editable canvas with AI generation, per the vendors' pages |
| Looking for a free editor | draw.io | Free, no sign-up, built-in Generate tool |
| Keeping diagrams in a repository | Mermaid | Diagram as code |
| Documenting a live AWS, Azure or GCP environment | Cloudcraft | Draws from live infrastructure data collected by Datadog |
| Writing a design doc or slide and need a picture today | A text-to-image drafter such as ConceptViz | One sentence in, a labeled image out |
Whichever you choose, treat the first output as a draft. Check every arrow for direction, every box for a real component, and every data store for whether it is one store or two. AI or not, that check is yours.
Frequently asked questions
What is the best AI architecture diagram generator?
It depends on what happens next. For an editable diagram on a shared canvas, Eraser, Lucidchart, Miro and draw.io all describe prompt-based generation on their own pages. For diagrams stored as text, Mermaid. For a diagram drawn from a live cloud account, Cloudcraft. For a quick labeled image from a sentence, a text-to-image tool such as ConceptViz.
Is there a free AI architecture diagram generator?
Several have a free tier. Eraser's free plan lists 3 AI credits, Lucidchart and Miro have free plans, and Mermaid's Basic plan has limited AI. draw.io is free with no sign-up and has a Generate tool. ConceptViz gives new accounts 2 image credits valid for 7 days. Limits change, so check each pricing page.
Can AI generate a software architecture diagram from text?
Yes. You describe the components and how data or requests flow between them, and the tool draws the diagram. Eraser's own guidance suggests listing the components and groupings first and then the flow. In our three ConceptViz runs, component names and the main flow were right, and the mistakes were in secondary arrows, so check every connection.
Can I edit an AI-generated architecture diagram?
In Eraser, Lucidchart, Miro and draw.io, the vendors' pages describe the output as an editable diagram. Mermaid output comes from code you can edit. ConceptViz produces an image, so you change it by editing the prompt and generating again; a traced SVG, available after buying a credit pack, is a vector copy of the picture, not an editable architecture file. An Agent subscription can export editable SVG (2 credits each) and PPTX (Pro and Max, 4 credits each); we did not test that route here.
Can AI draw a RAG or LLM application architecture?
Yes, and it is a common request. Name the indexing steps and the query steps separately, and say where the question and the retrieved context meet. In our test the vector database was drawn twice with no link between the copies, so check that a shared store is drawn once.
What is the difference between a diagram generator and Cloudcraft-style live diagrams?
A generator draws what you describe. Cloudcraft's pages describe turning the infrastructure data Datadog already collects into a live diagram that updates as infrastructure changes, so it shows what is deployed rather than what a prompt said.
How is this guide different from your general AI diagram generators guide?
This page covers only software, cloud and AI-system architecture diagrams. The general AI diagram generators guide covers UML, ER, flowcharts, Venn diagrams and more.
RAG & LLM App Architecture Diagram Generator
Generate a RAG or AI agent architecture diagram from a text prompt, with exact reference pipelines for retrieval, memory and tools.
Try the RAG diagram generator →MCP Architecture Diagram Generator
Host, clients and servers, with exact diagrams checked against the spec.
Categories
More Posts
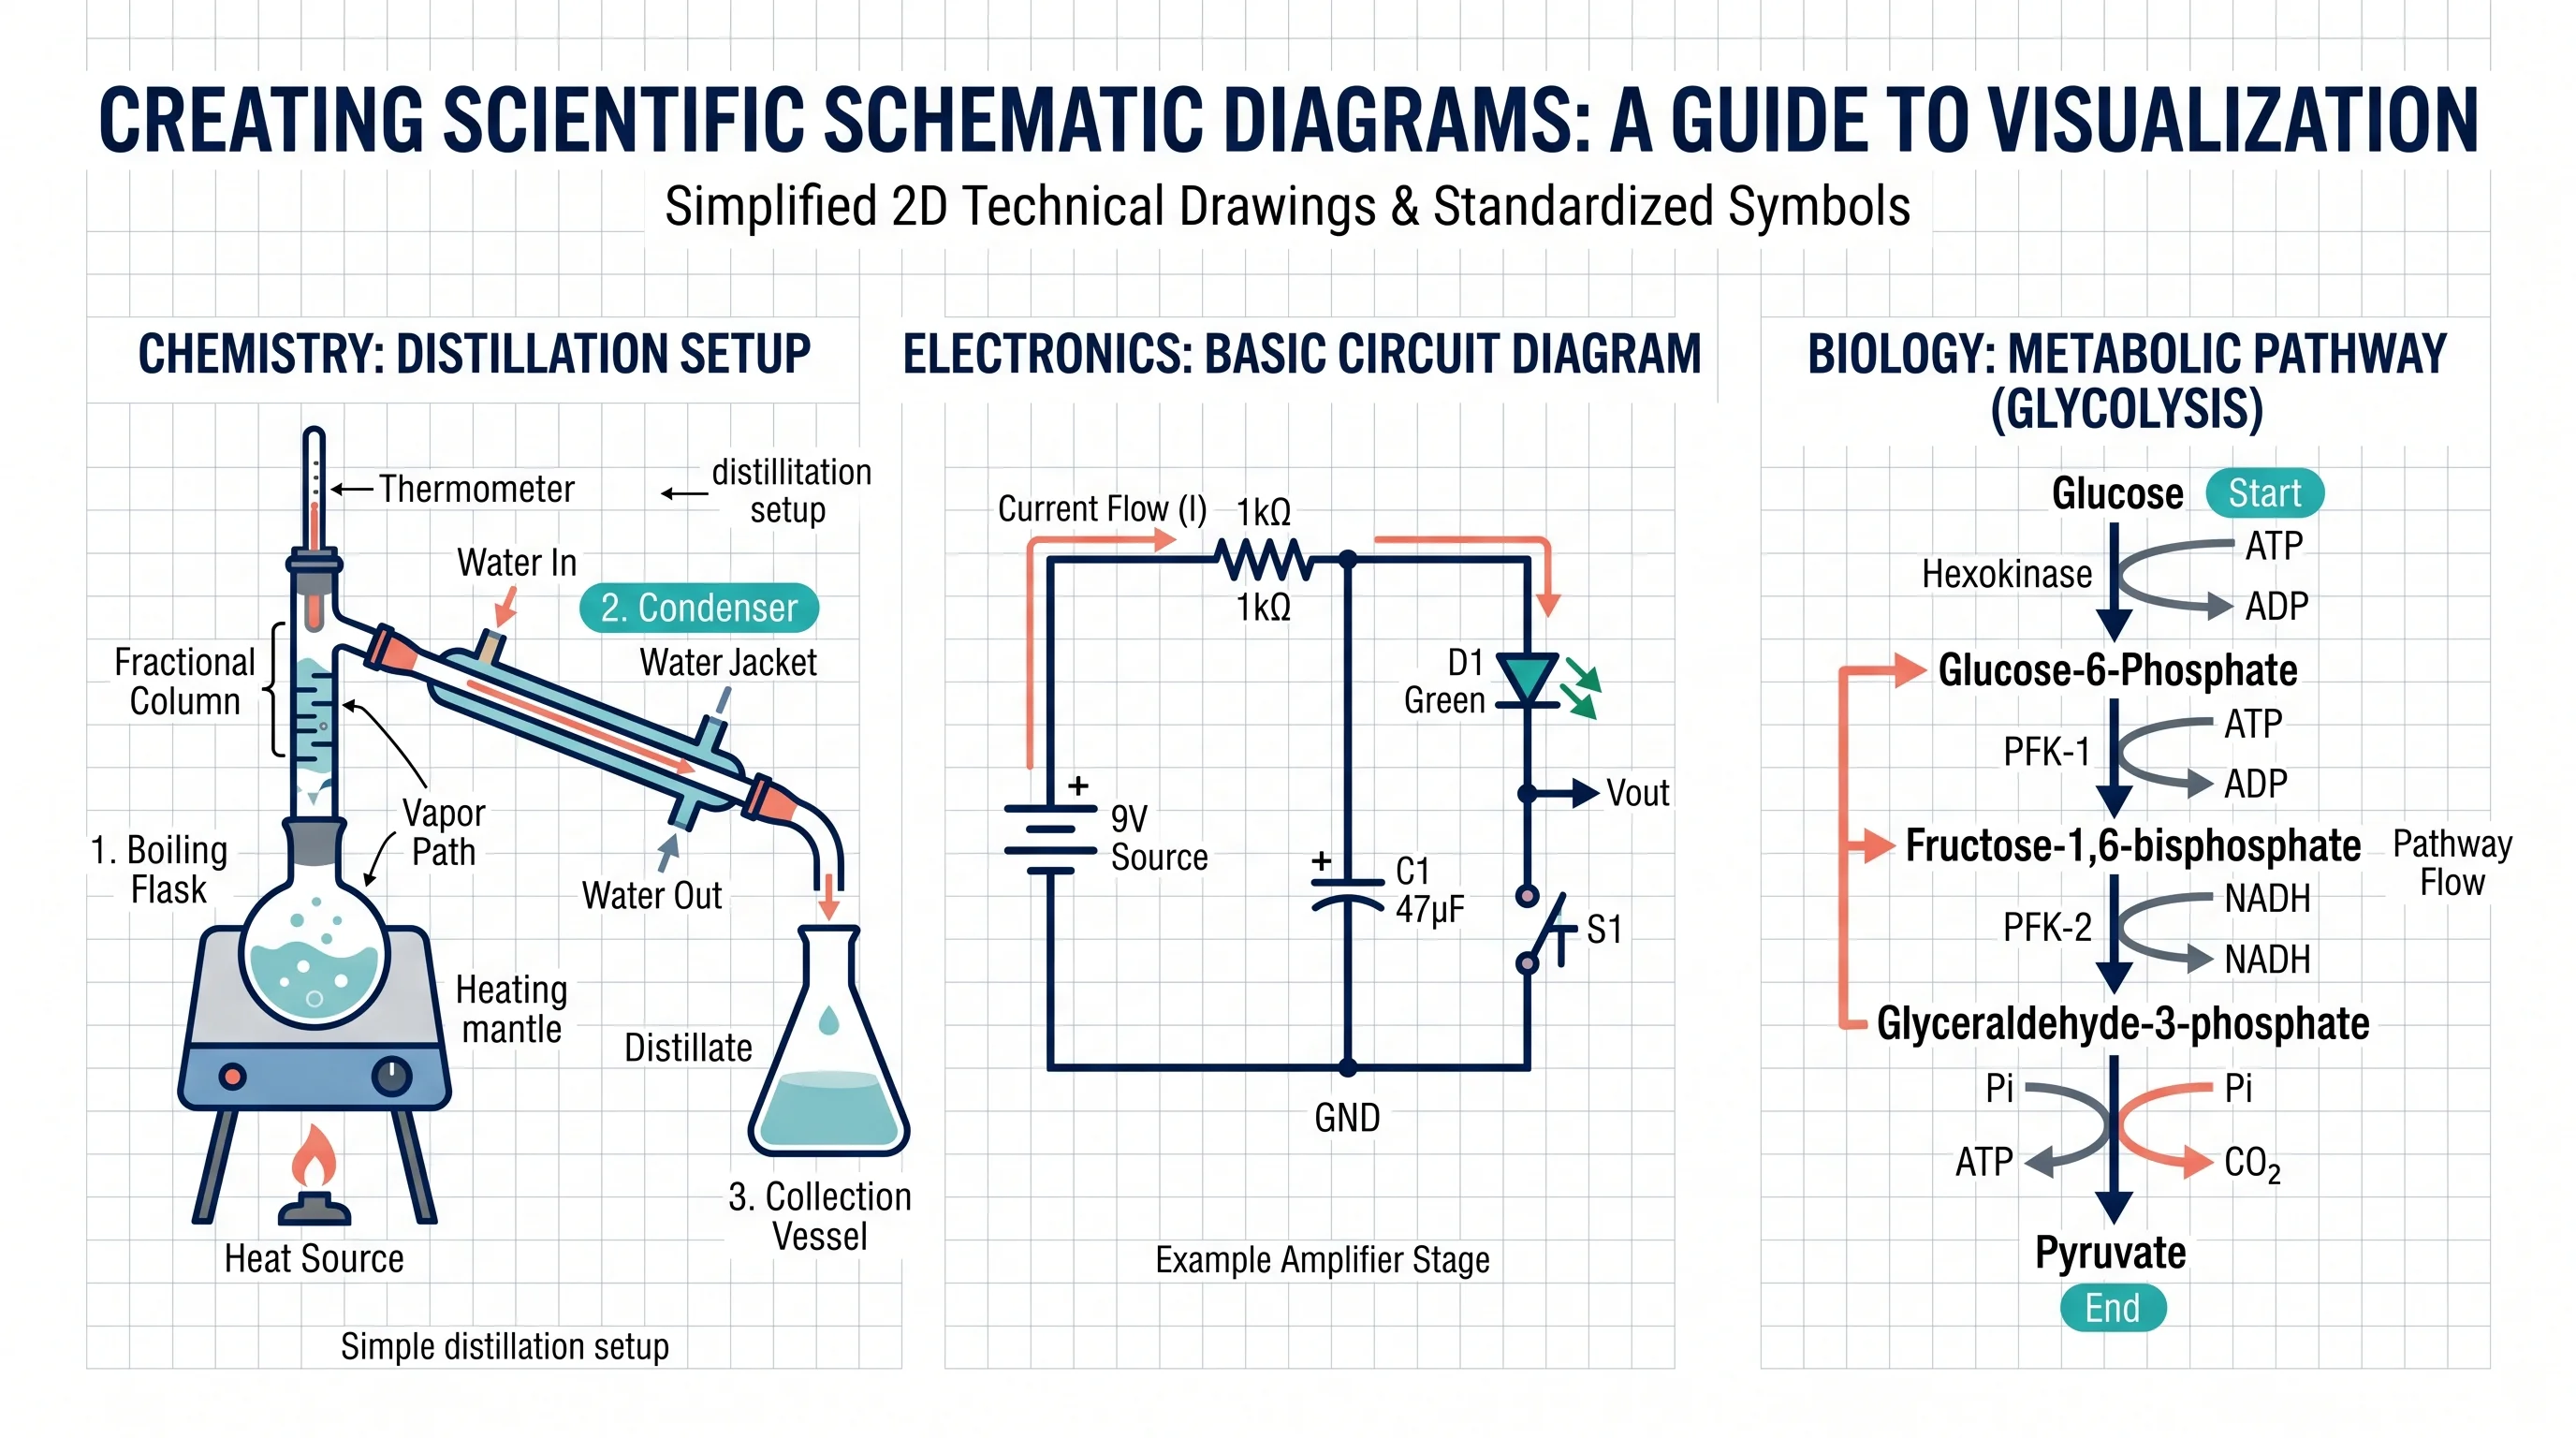
How to Make a Schematic Diagram: Step-by-Step Guide for Scientists and Students
Learn how to make a schematic diagram for science, lab experiments, and research. A step-by-step guide to rules, symbols, software tools, and examples.

Column Chart Maker Guide: When to Use Column Charts and How to Make One
Learn when to use a column chart, how it differs from a bar chart, and how to make clean grouped, stacked, and spreadsheet-ready column charts.
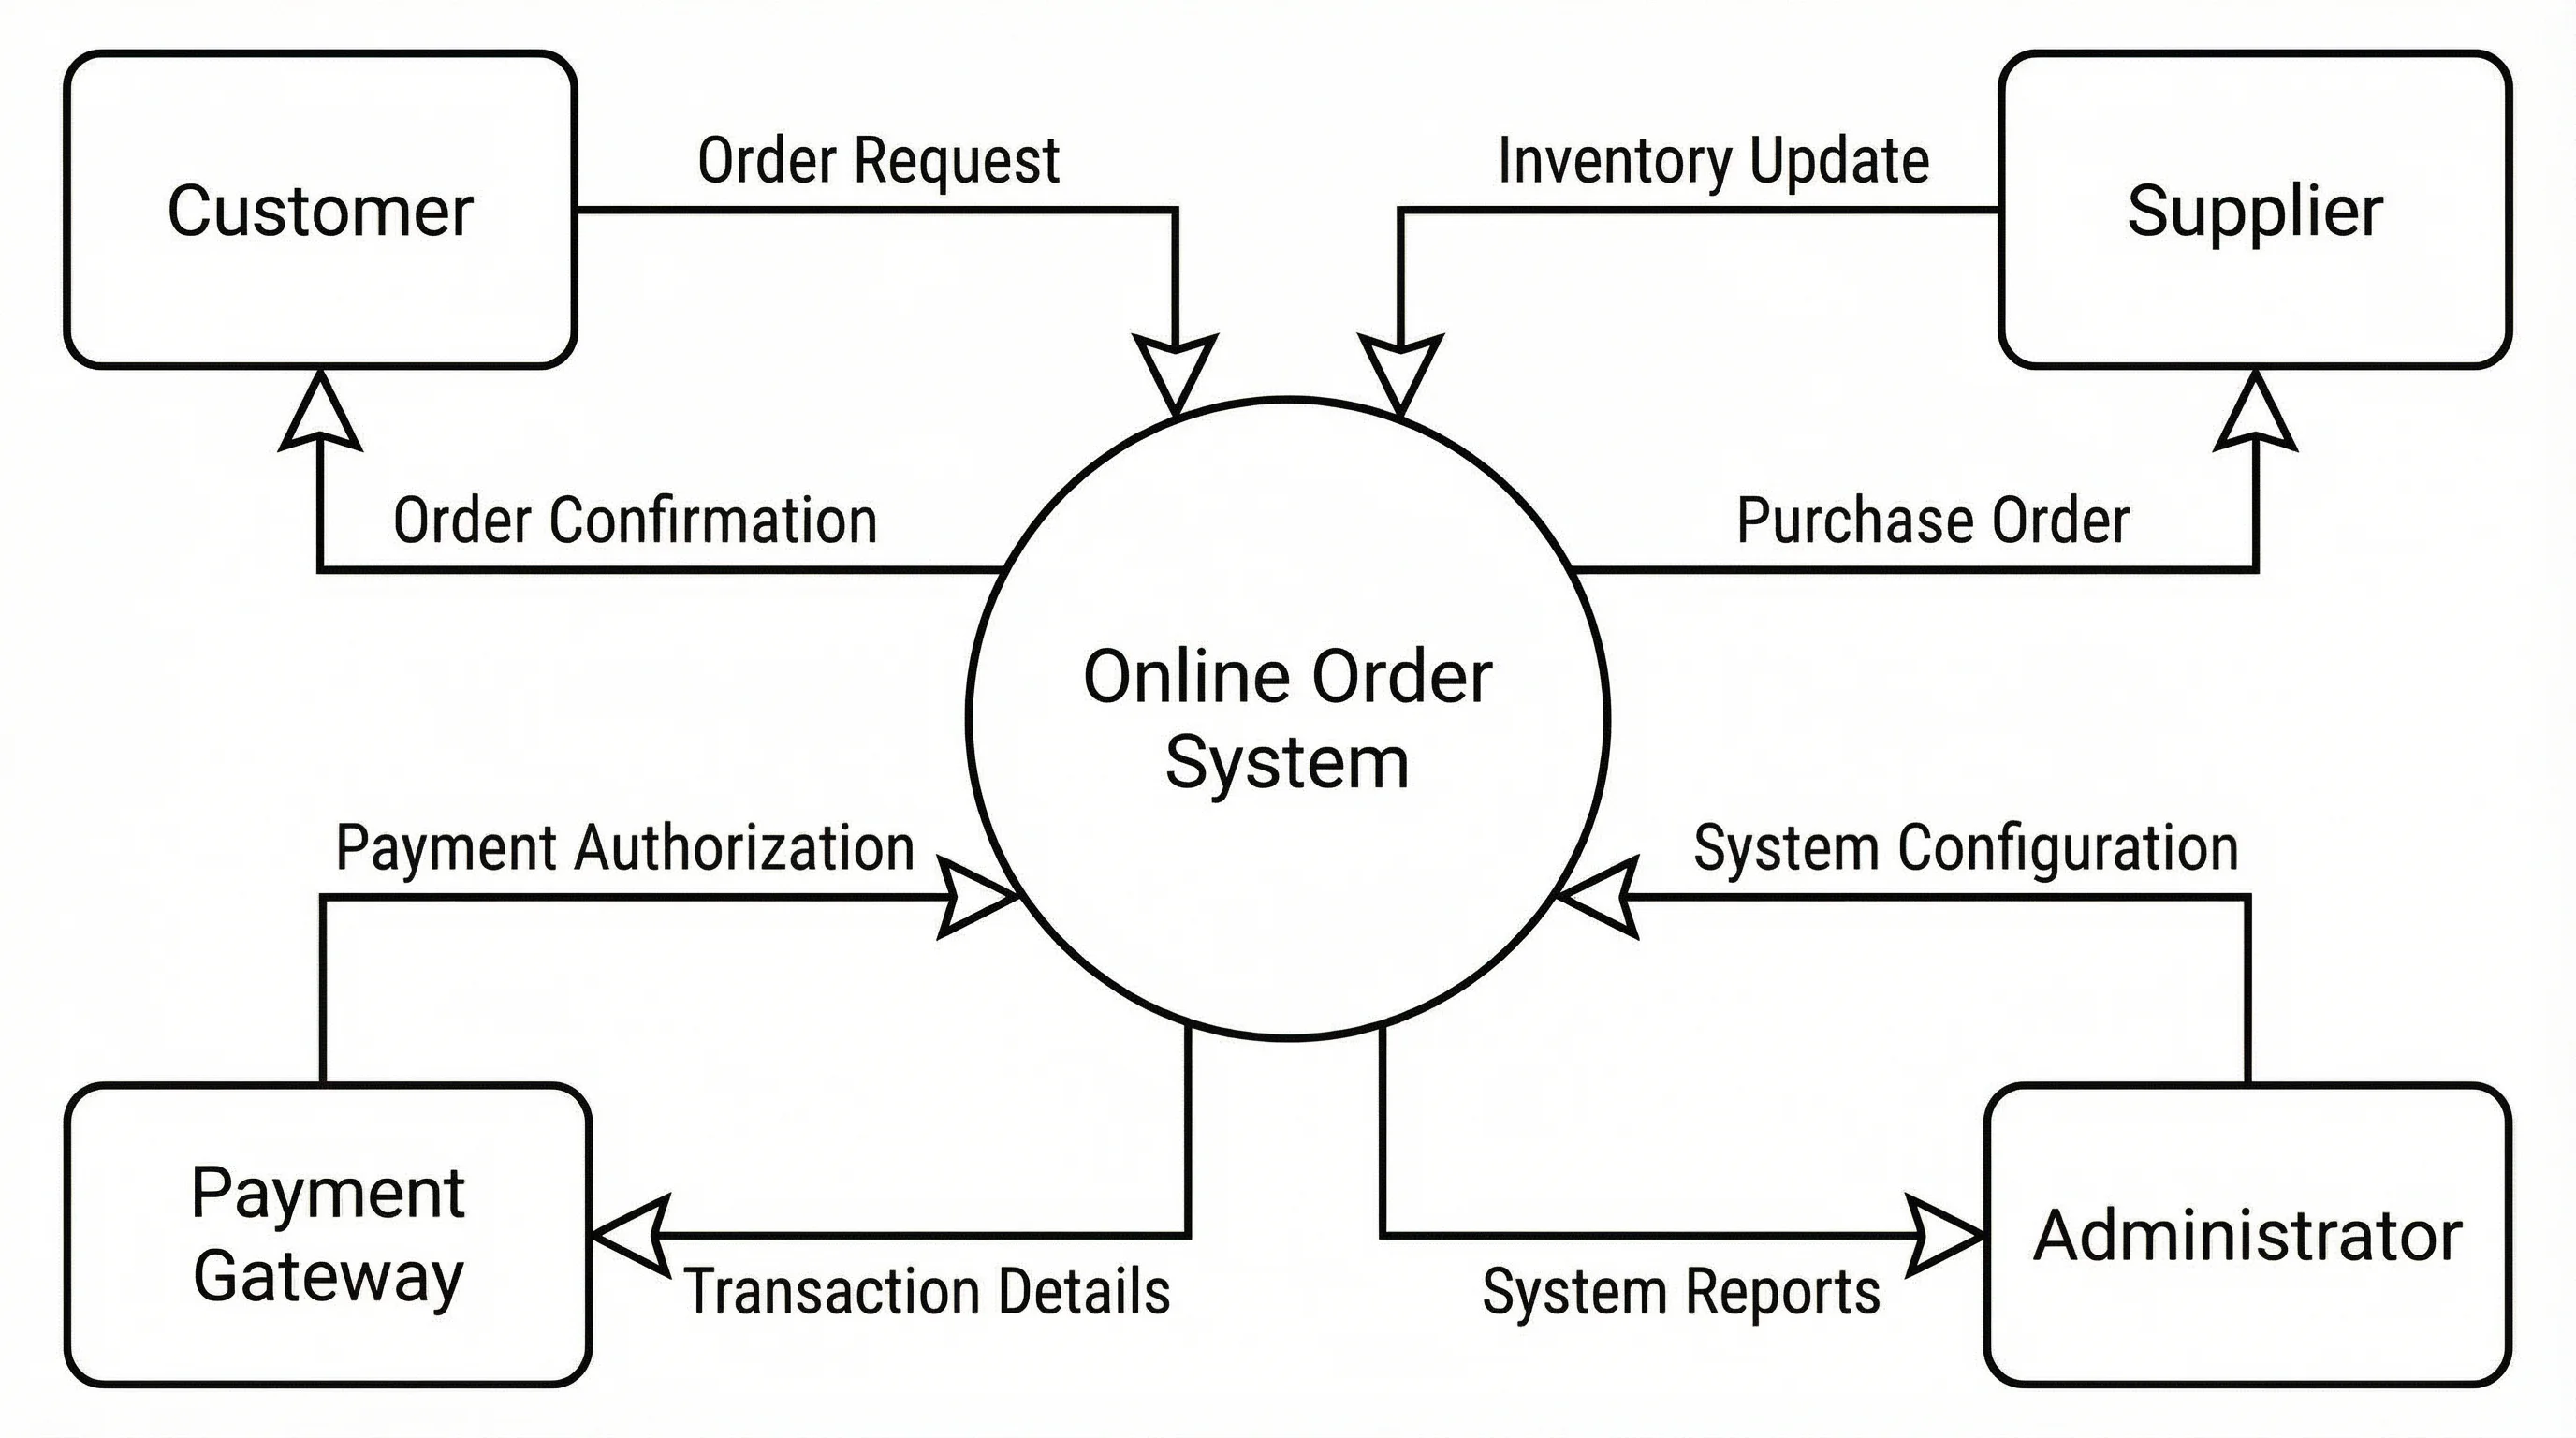
How to Create a Data Flow Diagram: DFD Levels, Symbols & Examples (2026)
Step-by-step guide to creating data flow diagrams (DFDs). Learn Level 0, 1 & 2 DFDs with real examples, standard symbols, and common mistakes to avoid.