Software Architecture Diagram Generator for System Design
Generate a clear system architecture diagram from a plain-English description. This architecture diagram generator maps services, APIs, databases, queues, clients, and load balancers — covering C4, layered, and microservices views for software design and documentation.
Software Architecture Diagram Generator
Free to try ·
Your architecture diagram will appear here
Describe your system and click Generate
Software Architecture Diagram Examples
Microservices, MVC, client–server, cloud, event-driven, and layered system views
Microservices Architecture
Independent services behind an API gateway, each owning its database, connected by a message queue.
MVC Pattern Diagram
The Model–View–Controller pattern, with labeled arrows for input, updates, and rendering.
Client–Server Architecture
Clients reach a load balancer, then app servers, a cache layer, and a primary–replica database cluster.
Cloud (AWS) Architecture
A cloud deployment view — DNS, CDN, load balancing, compute, managed databases, storage, and queues.
Event-Driven Architecture
Producers publish to an event bus and consumers subscribe — services stay loosely coupled and async.
Layered (N-Tier) Architecture
Presentation, business logic, data access, and database layers, each depending only on the one below.
What is a software architecture diagram?
A software architecture diagram is a high-level map of a system: it shows the major building blocks — clients, services, APIs, databases, queues — and how they connect. Unlike a class diagram or a flowchart, an architecture diagram answers structural questions: what runs where, what talks to what, and where data lives. A good system architecture diagram lets a new engineer, a reviewer, or a stakeholder understand the shape of the software in under a minute, without reading the code. This generator turns a plain-English description of your system into exactly that kind of labeled, boxes-and-arrows diagram.
The building blocks of a system architecture diagram
- Clients: the web app, mobile app, or external systems that initiate requests into your platform.
- API gateway / load balancer: the entry point that routes, balances, and protects traffic before it reaches your services.
- Services: the application components that hold business logic — a monolith, or many microservices each owning a responsibility.
- Databases & data stores: relational databases, NoSQL stores, caches, and object storage where state and files live.
- Queues & event buses: message queues and brokers (Kafka, RabbitMQ, SQS) that let services communicate asynchronously.
- External integrations: third-party APIs, identity providers, and payment processors drawn at the system boundary.
Common architecture views: C4, layered, and microservices
There is no single "correct" diagram — you choose the view that fits your audience. The C4 model works in zoom levels: a context diagram shows your system and the people and systems around it, a container diagram breaks it into deployable units (web app, API, database), and a component diagram opens one container up. A layered (N-tier) view stacks presentation, business logic, and data layers to show separation of concerns. A microservices view shows independent services, each with its own data store, connected through an API gateway and message bus. This tool can render any of these — just describe the level of detail and the style you need.
Generate a diagram from a plain-English description
- Describe your system in the box: name the components, services, and data stores, and say how they talk (REST, gRPC, events).
- Mention the view you want — context, container, microservices, layered, or a cloud deployment on AWS, GCP, or Azure.
- Pick an aspect ratio (16:9 reads well in slides and docs) and click Generate to get a clean, labeled diagram.
- Refine by re-prompting — add a cache, split a service, or call out a load balancer until the structure matches your design.
Using diagrams for software design and documentation
Architecture diagrams earn their keep in three places. In design, a quick diagram makes trade-offs visible before you write code, so a design review can argue about the picture instead of guessing. In documentation, an architecture diagram in the README or wiki is the single fastest way to onboard a new engineer and keep tribal knowledge out of people’s heads. In communication, a clean system diagram lets you explain the platform to a manager, a client, or a security reviewer without dragging them through the codebase. Generating the diagram from text means it is cheap to keep current as the system evolves.
Microservices, event-driven, and cloud architectures
Modern systems rarely fit one neat box, and the generator handles the common modern shapes. A microservices diagram shows small, independently deployed services, each with its own database, fronted by an API gateway. An event-driven diagram puts a message broker at the center, with producers publishing events and consumers reacting asynchronously — ideal for showing loose coupling. A cloud deployment diagram maps your design onto managed services: DNS, CDN, load balancers, auto-scaling compute, managed databases with replicas, object storage, serverless functions, and queues. Describe the pattern you are using and the tool draws the components and data-flow arrows to match.
Frequently Asked Questions
Related Diagram Tools
 Diagrams
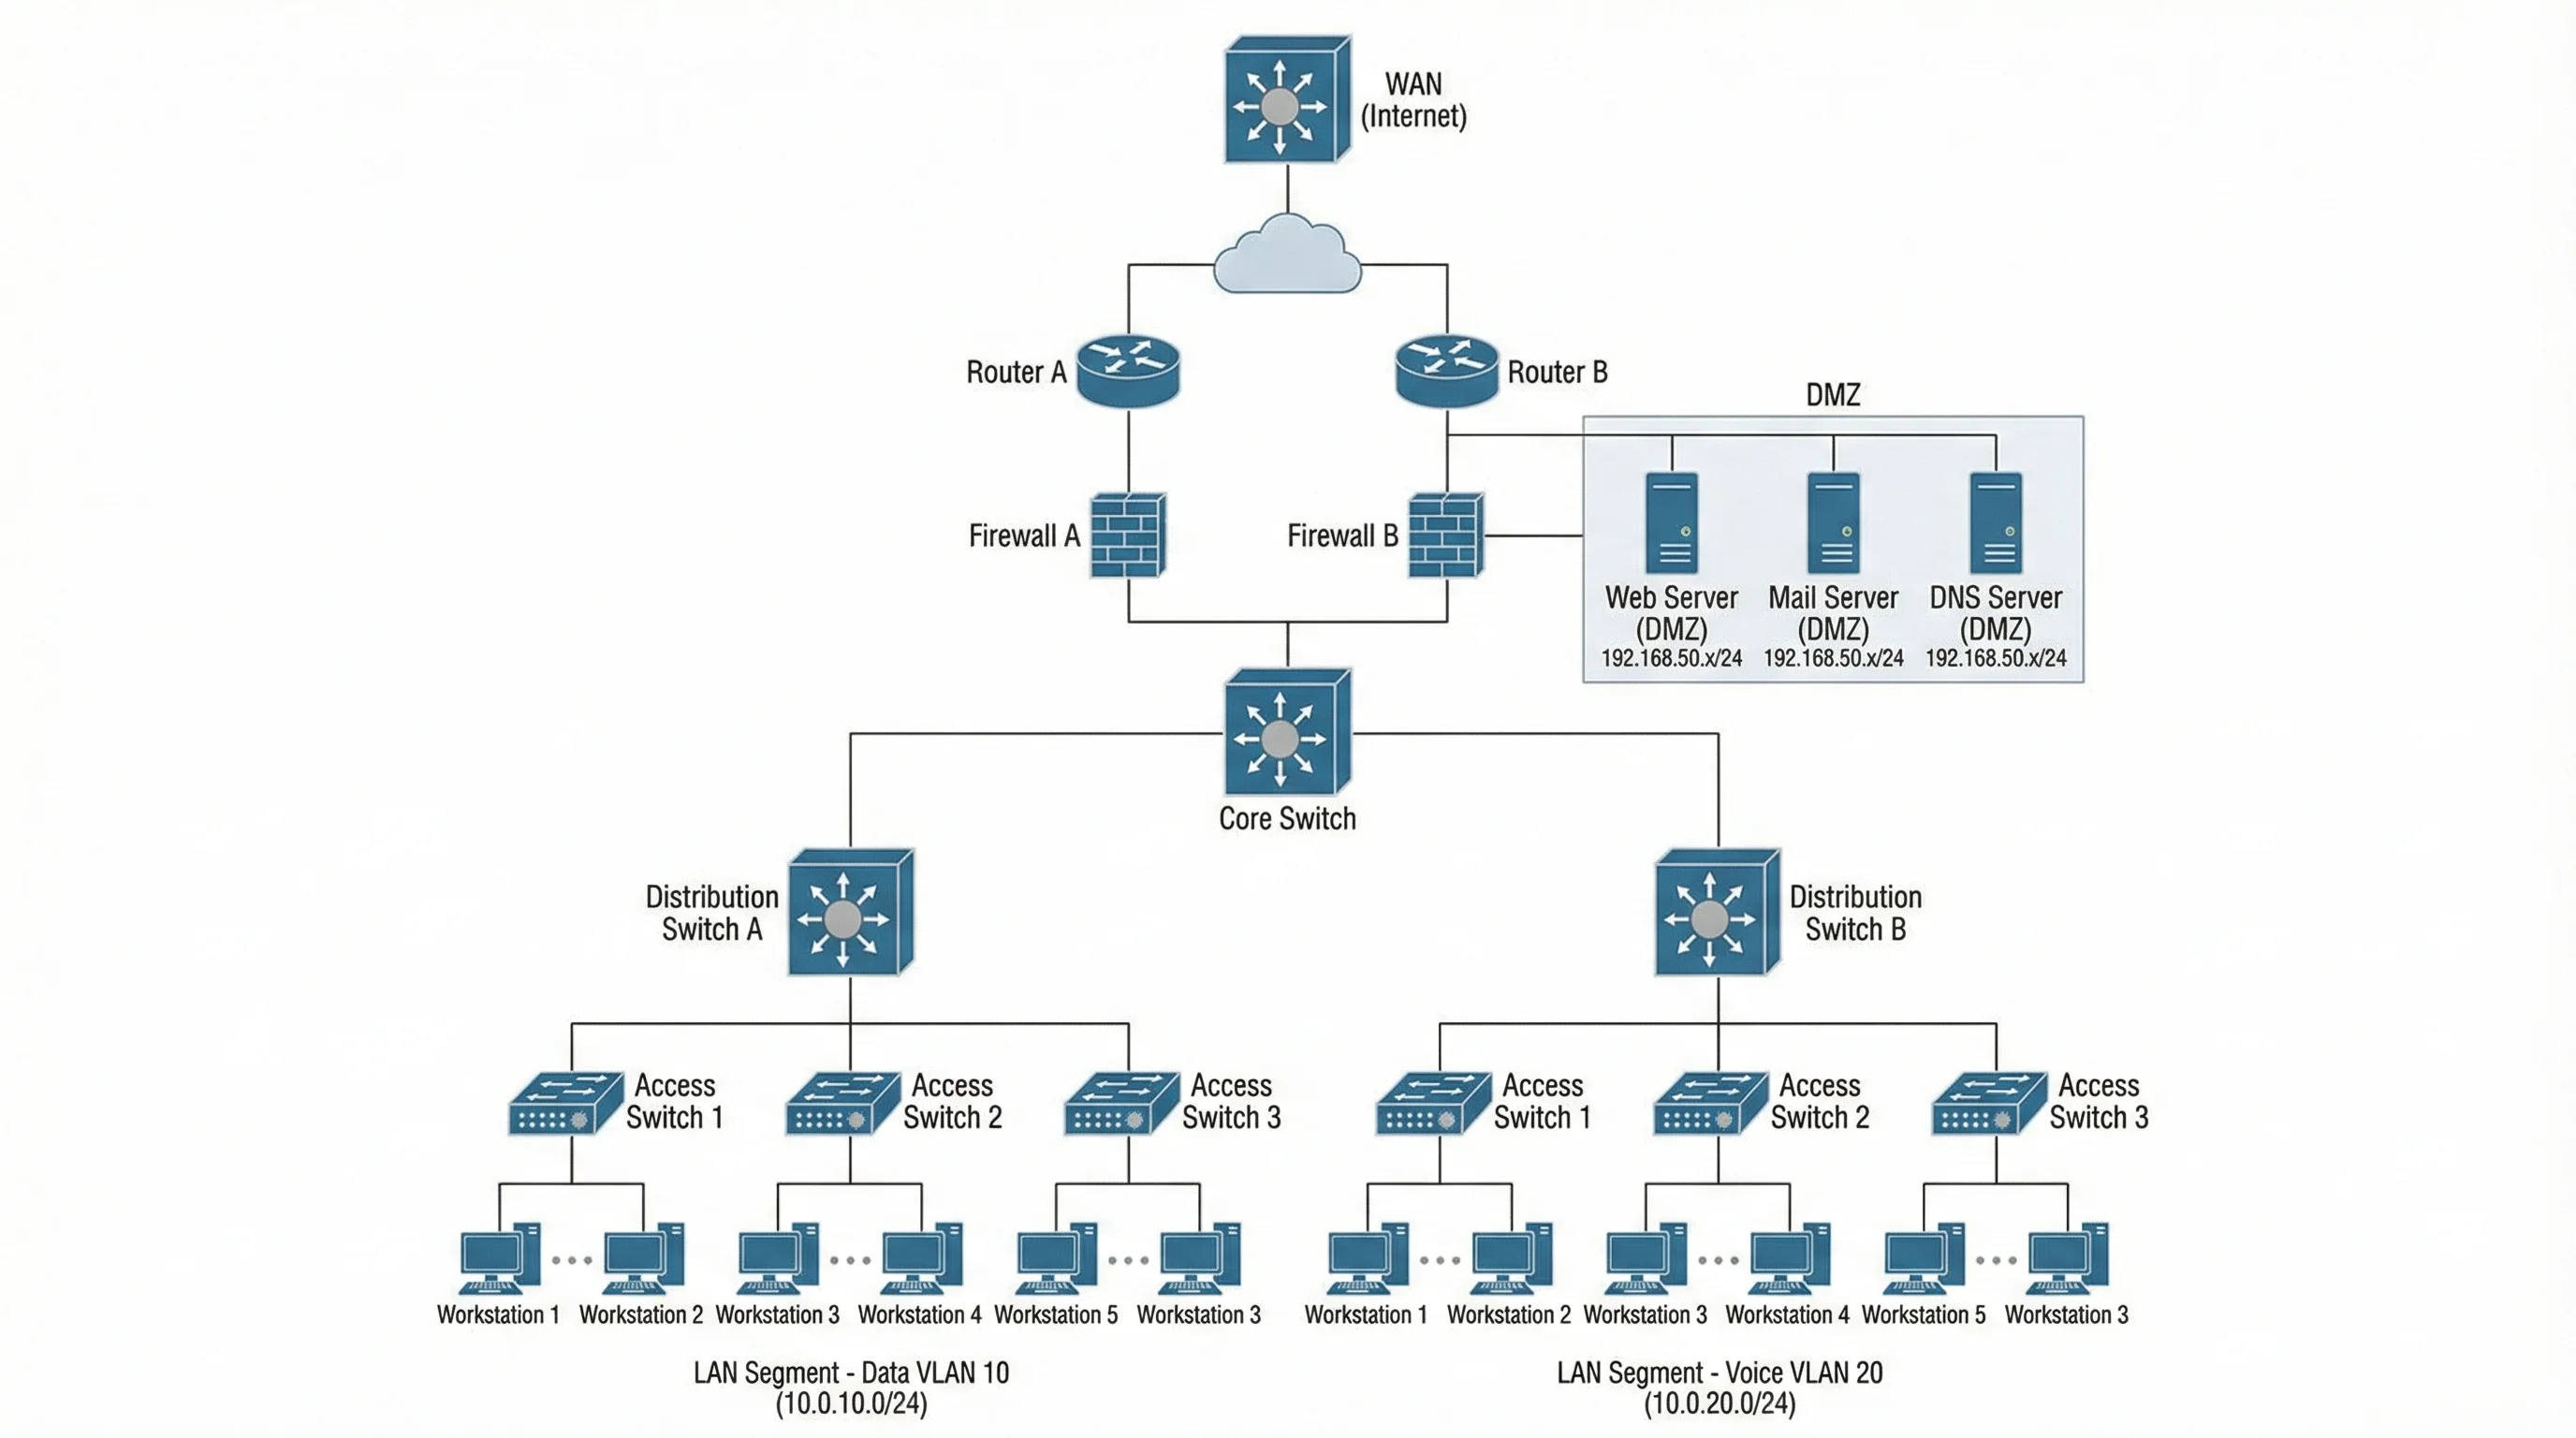
Network Diagram Generator
Map servers, routers, firewalls, and connections into a clear network topology diagram.
 Diagrams
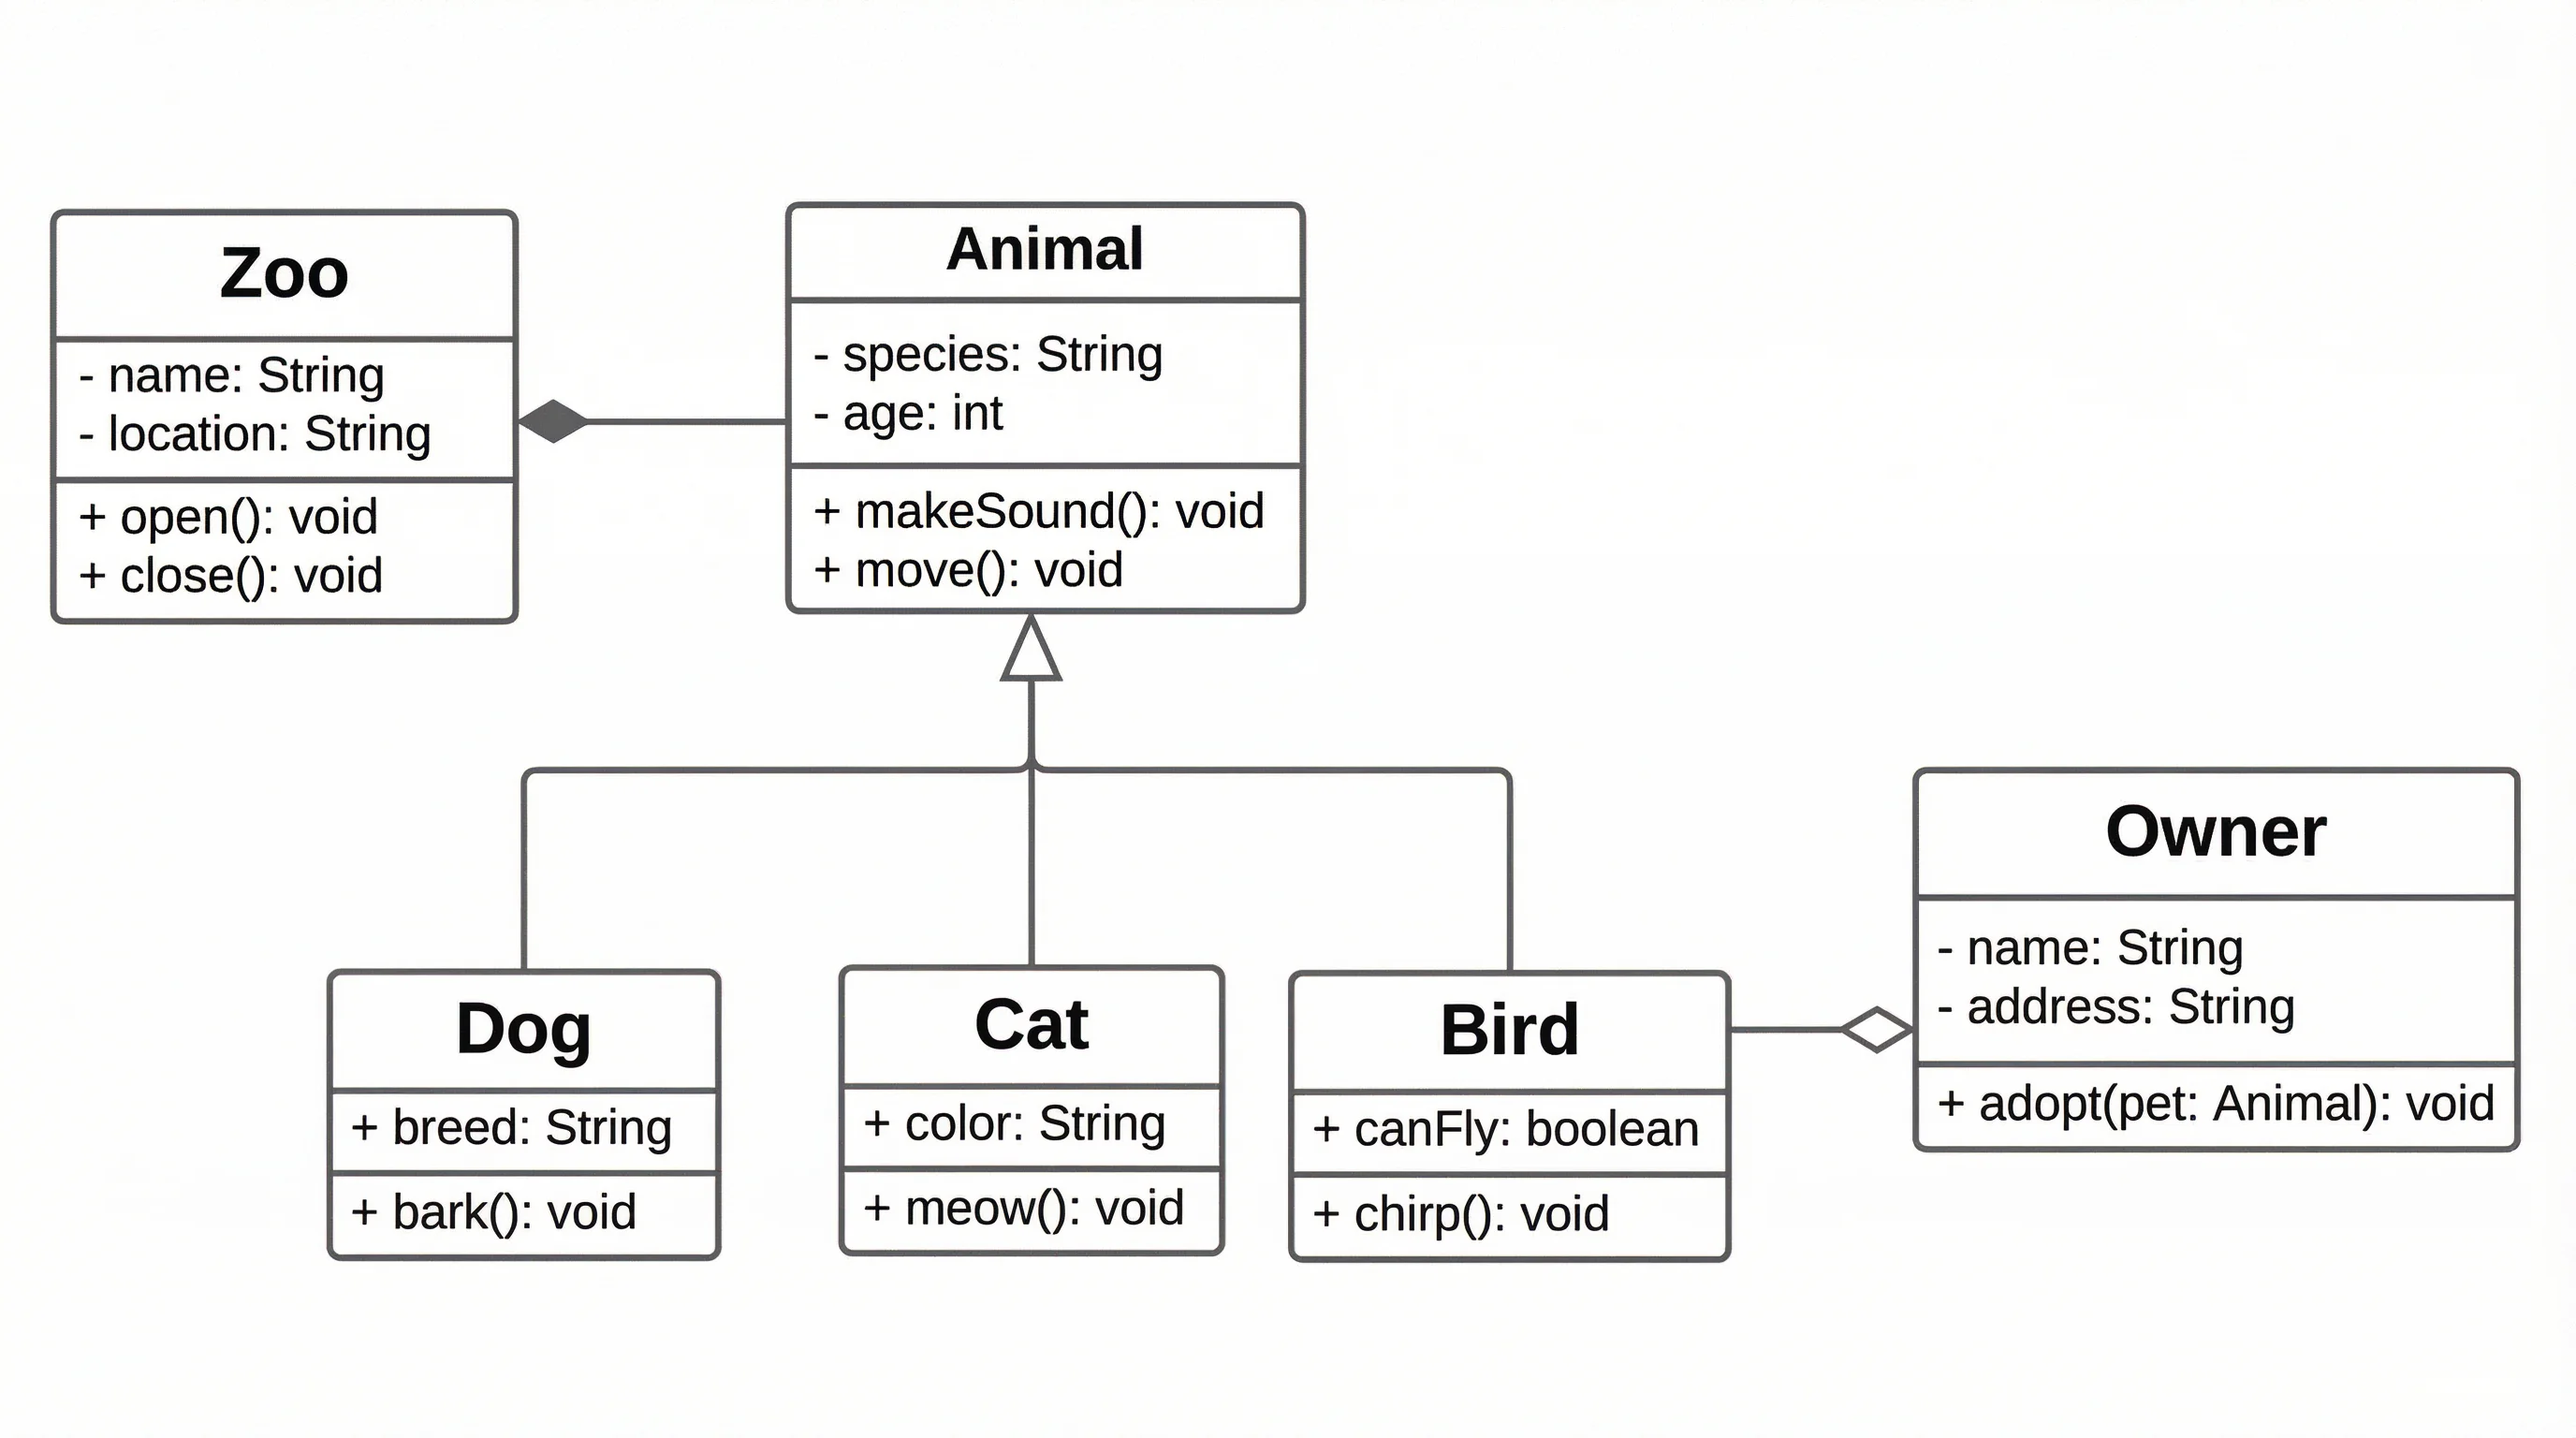
UML Diagram Generator
Create class, sequence, and component UML diagrams to model software structure and behavior.
 Diagrams
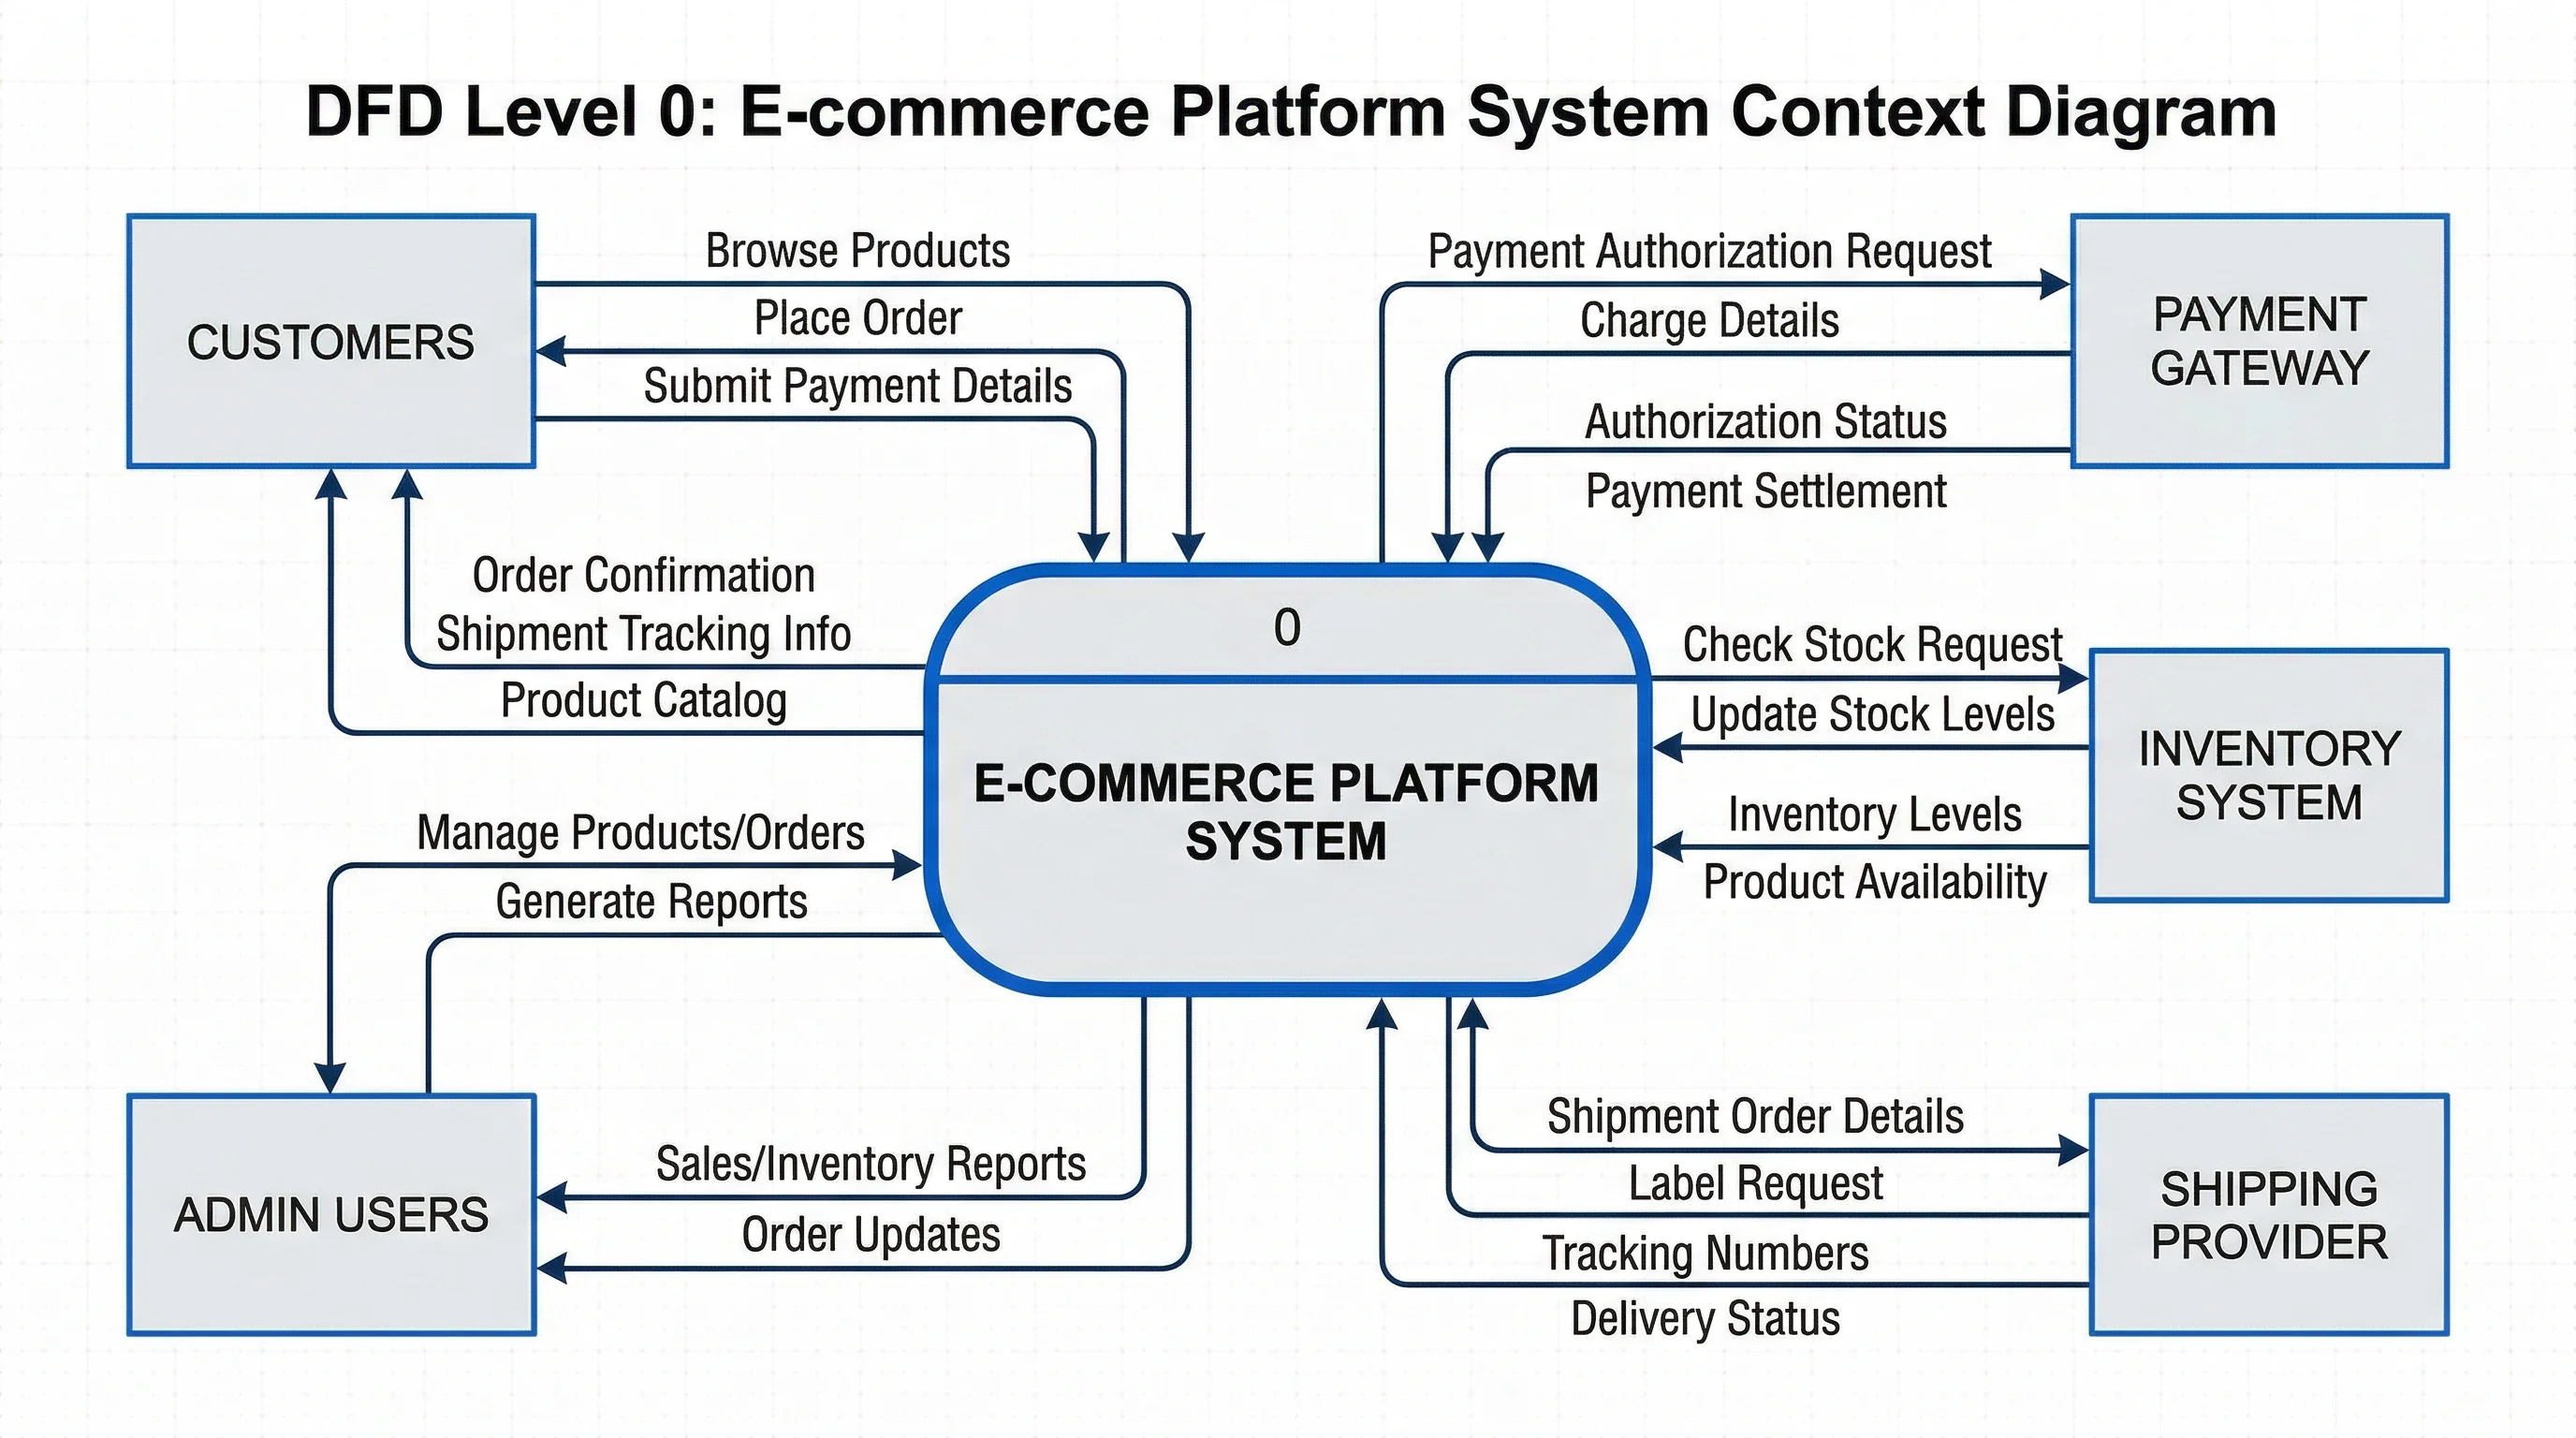
Context Diagram Generator
Draw a C4-style context diagram showing your system and the users and systems around it.
 Diagrams
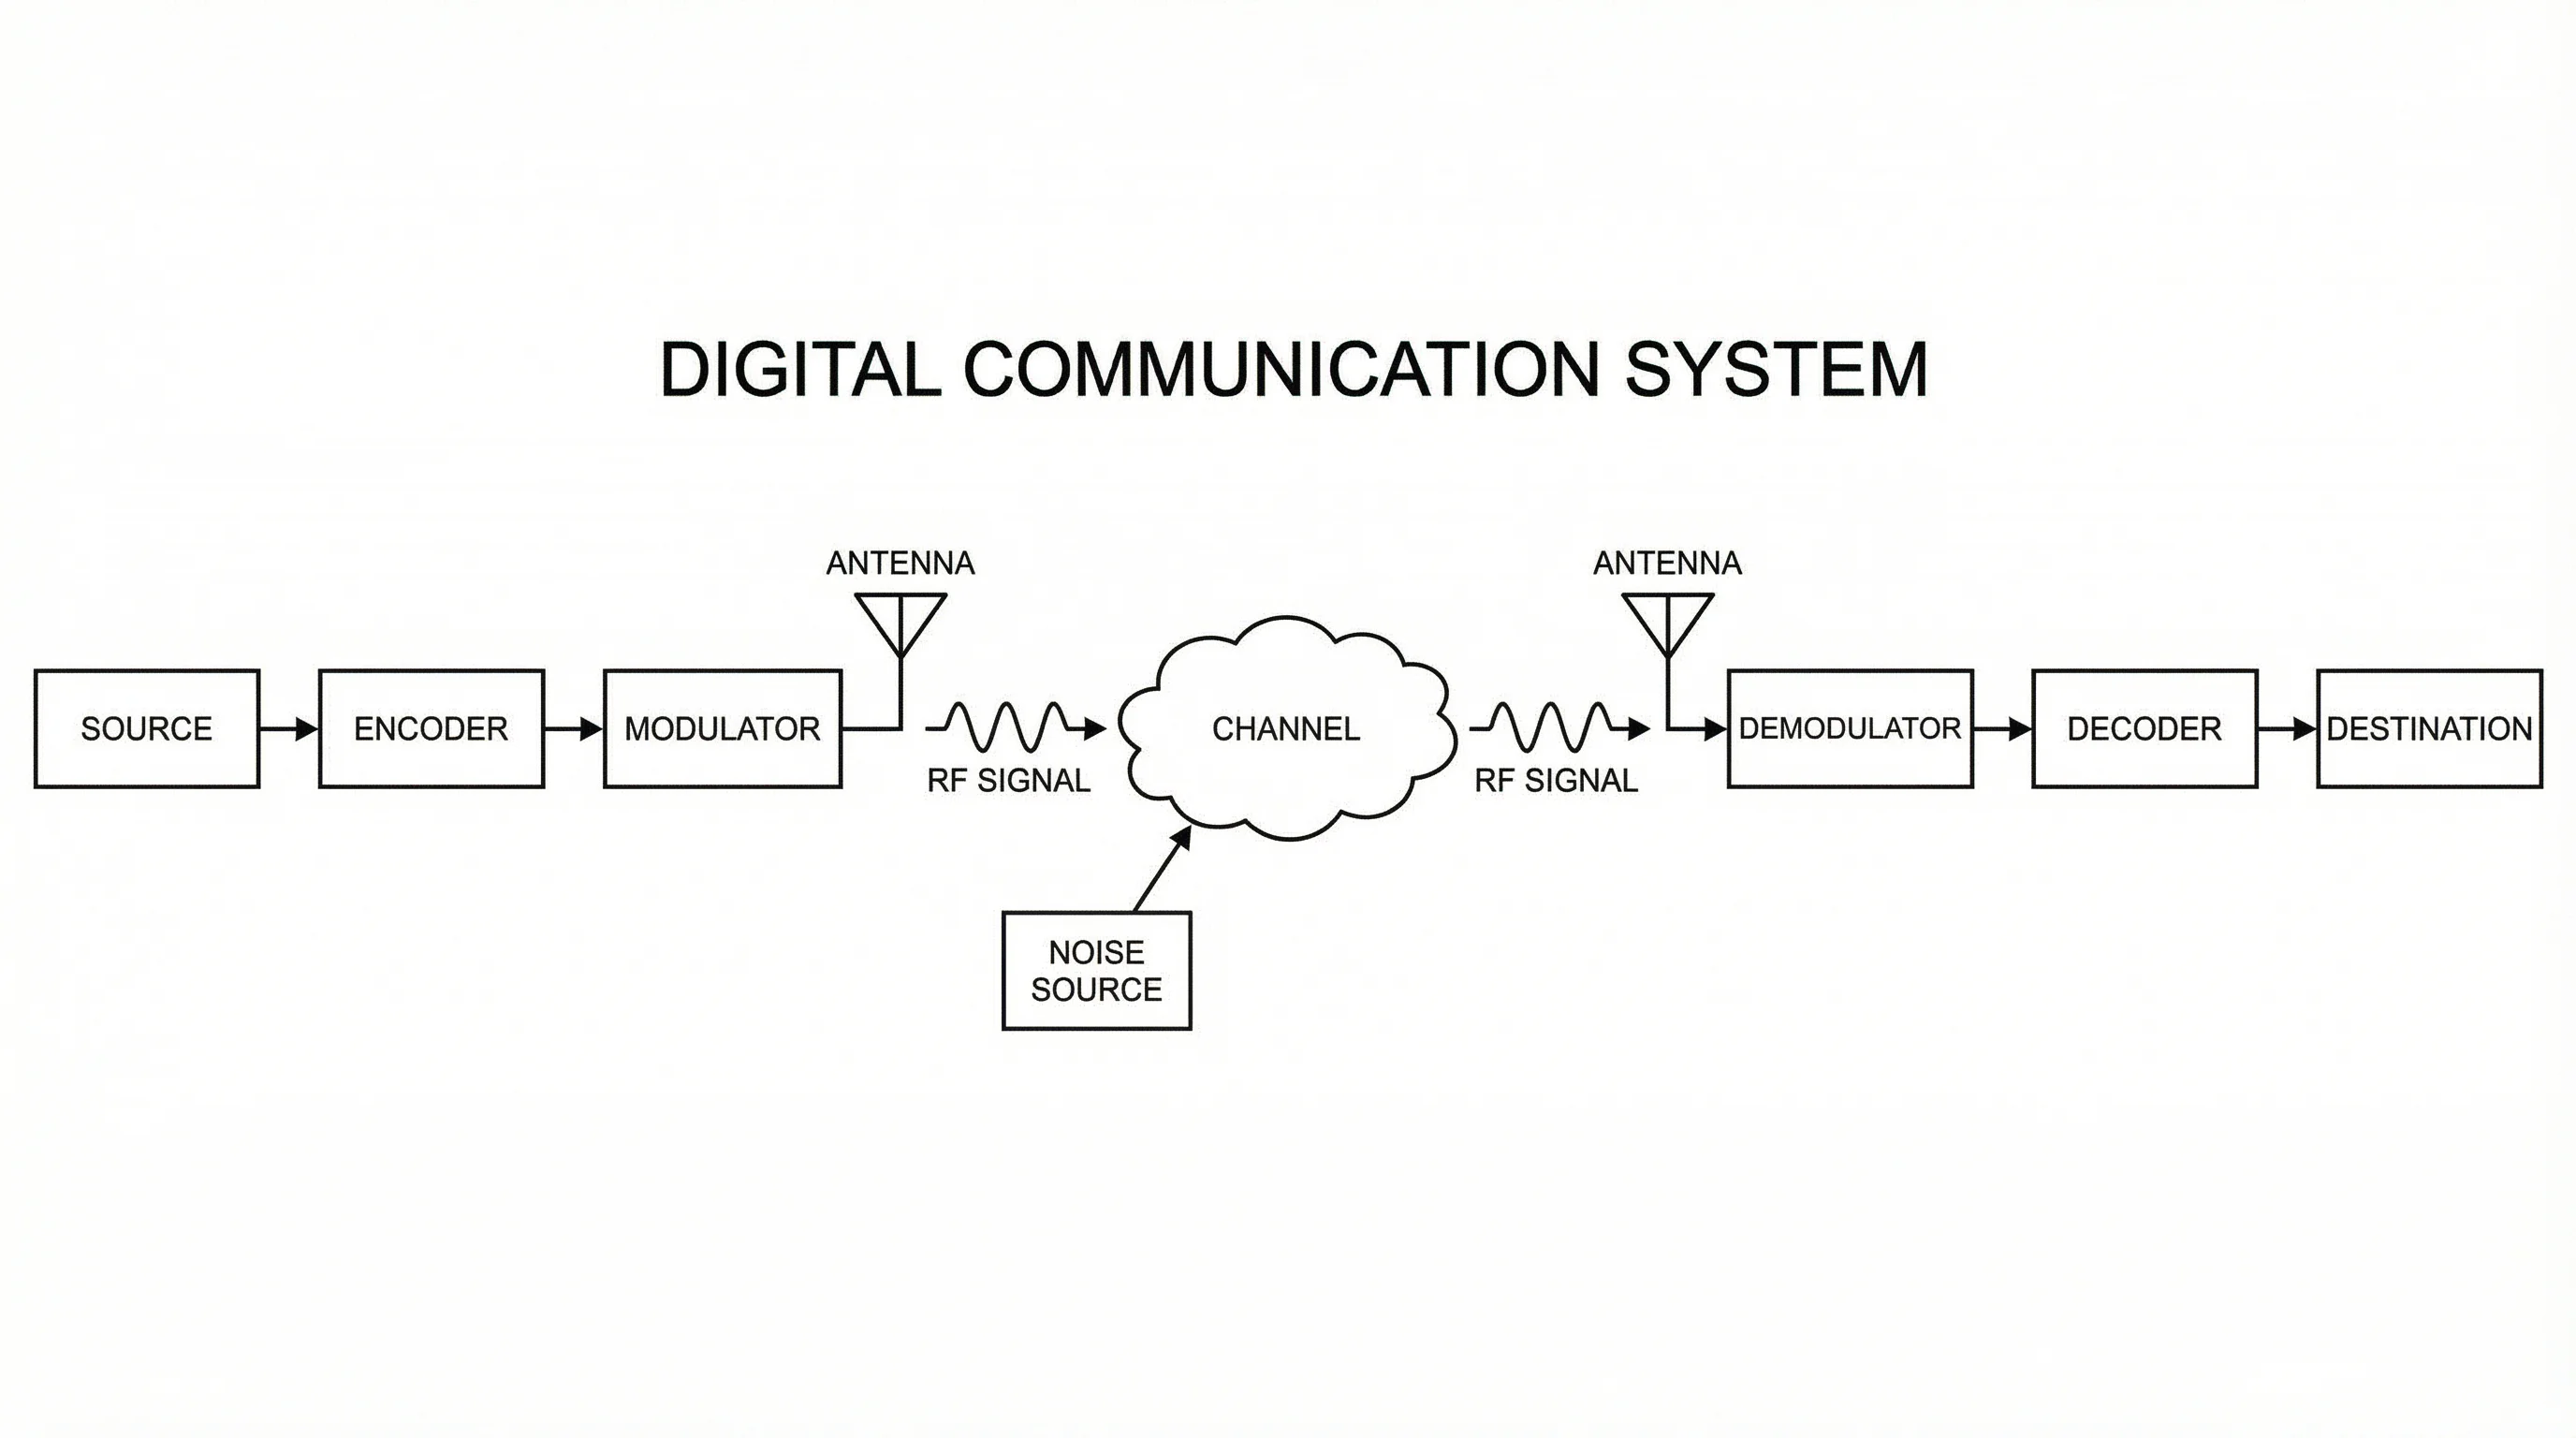
Block Diagram Generator
Turn a system into labeled functional blocks with inputs, outputs, and signal flow.