Network Diagram Generator for Topologies & IT Docs
Create a network diagram online, free. Describe your topology — routers, switches, firewalls, servers, the cloud, and endpoints — and AI draws a clean, labeled diagram with standard device icons for IT documentation, network design, and cloud architecture.
Network Diagram Generator
Free to try ·
Your network diagram will appear here
Describe your network and click Generate
Network Diagram Examples
Topologies, cloud architectures, and IT documentation diagrams from a description
Enterprise Network Topology
A physical topology of a corporate LAN — core switch, distribution and access layers, firewall, and DMZ, all with standard device icons.
Cloud Architecture Diagram
An AWS-style diagram with a load balancer, auto-scaling web tier, app servers, and an RDS database across public and private subnets.
Home Network Setup
A simple home topology — modem to router to endpoints — with wired and wireless links drawn differently.
Data Center Spine-Leaf
A modern spine-leaf fabric — spine switches feeding leaf switches, racked servers, and storage — built for east-west traffic.
Wireless Coverage Plan
A Wi-Fi planning diagram — access points, overlapping coverage zones, PoE switches, and a controller laid over a floor plan.
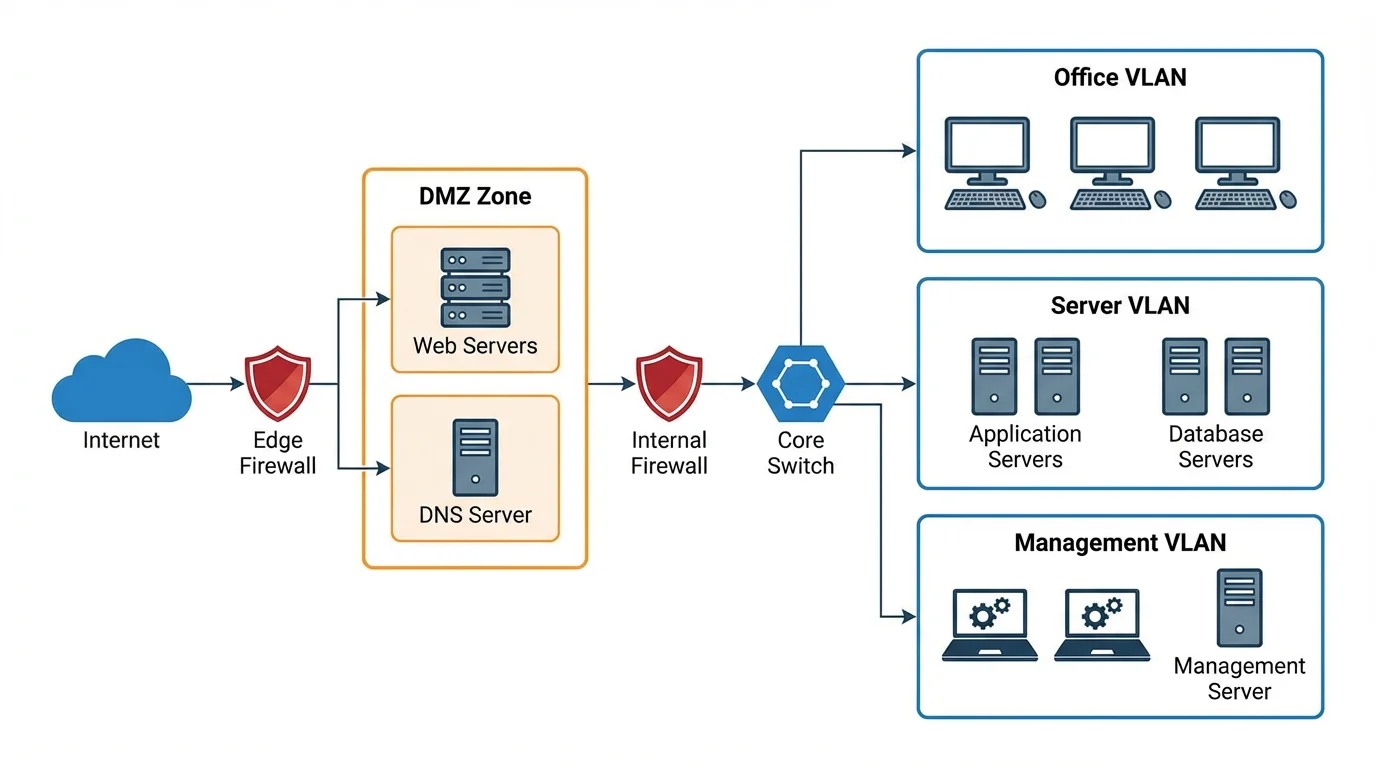
Security Architecture
A defense-in-depth layout — perimeter and internal firewalls, a DMZ, IDS/IPS, and a VPN gateway separating trust zones.
What is a network (topology) diagram?
A network diagram is a map of how the devices in a network connect to each other. It shows nodes — routers, switches, firewalls, servers, the cloud, and endpoints like laptops and phones — and the links between them, so you can see how data moves and where each device sits. The arrangement of those connections is called the network topology. A good diagram turns an abstract setup into something you can read at a glance: where the internet enters, what the firewall protects, which switch feeds which segment, and how the whole thing fits together. This generator draws that map for you from a plain-English description, using the standard networking icons people expect to see.
Common network topologies
- Star: every device connects to one central node, usually a switch. It is the most common LAN layout — easy to manage, and one cable failing only affects one device.
- Mesh: nodes connect to many other nodes, giving multiple paths and high redundancy. Common in WANs, wireless backhaul, and critical links where uptime matters.
- Bus: all devices share a single backbone cable. It is simple and cheap but largely legacy, since the whole segment fails if the backbone breaks.
- Ring: each device connects to two neighbors to form a loop, so data travels around the ring. Used in some fiber and metro networks for fault tolerance.
- Tree / hierarchical: a layered design with core, distribution, and access tiers. It is the standard for enterprise and campus networks because it scales cleanly.
Devices, nodes, and their icons
Network diagrams use a shared visual language so anyone can read them. A router (the icon with circular arrows) moves traffic between networks and out to the internet; a switch (a flat box with arrows) connects devices inside a LAN; a firewall (a brick-wall shape) filters traffic between zones. A server is drawn as a tower or rack, the internet or a hosted service is a cloud, and endpoints are laptops, desktops, phones, and printers. Load balancers, wireless access points, VPN gateways, and storage arrays have their own conventional symbols too. Just describe the devices in plain language — "core switch", "perimeter firewall", "two web servers behind a load balancer" — and the tool places the right icons and connects them.
Logical vs physical network diagrams
There are two ways to draw the same network. A physical diagram shows the actual hardware and cabling — which port connects to which device, where the racks and access points are, and how things are wired. It answers "what is plugged into what." A logical diagram ignores the cabling and shows how the network behaves — IP subnets, VLANs, routing, and the flow of traffic between zones. It answers "how does data move." Most teams keep both: a physical view for installation and troubleshooting, and a logical view for design and security reviews. Because this generator works from your description, you can ask for either — say "show subnets and VLANs" for a logical view, or "show the cabling and switch ports" for a physical one.
Using network diagrams for IT documentation
A current network diagram is one of the most useful documents an IT team can keep. It speeds up troubleshooting because you can trace a path instead of guessing, it makes onboarding new staff far easier, and it is often required for security audits and compliance frameworks. Diagrams also drive design discussions — planning a new office, migrating to the cloud, or segmenting a network for zero-trust all start with a picture everyone can mark up. Keeping the diagram alongside your runbooks and asset inventory means changes get reviewed against reality rather than memory, which is exactly why network documentation is a recurring task rather than a one-off.
How the describe-and-generate workflow works
- Describe your network in plain English: list the devices, how they connect, and any segments or zones (for example, "ISP to firewall to core switch, then three floor switches, plus a DMZ with two web servers").
- Pick an aspect ratio — 16:9 works well for slides and documentation, 1:1 for embedding inline.
- Generate the diagram. The AI lays out the nodes, draws the connections, and applies standard networking icons and labels.
- Refine by editing your description — add a VPN gateway, split out a guest Wi-Fi VLAN, or label the subnets — and regenerate until it matches your environment.
Frequently Asked Questions
Related Diagram Tools
 Diagrams
Text to Diagram Generator
Turn a plain-English description into a clean diagram — flows, topologies, and more.
 Diagrams
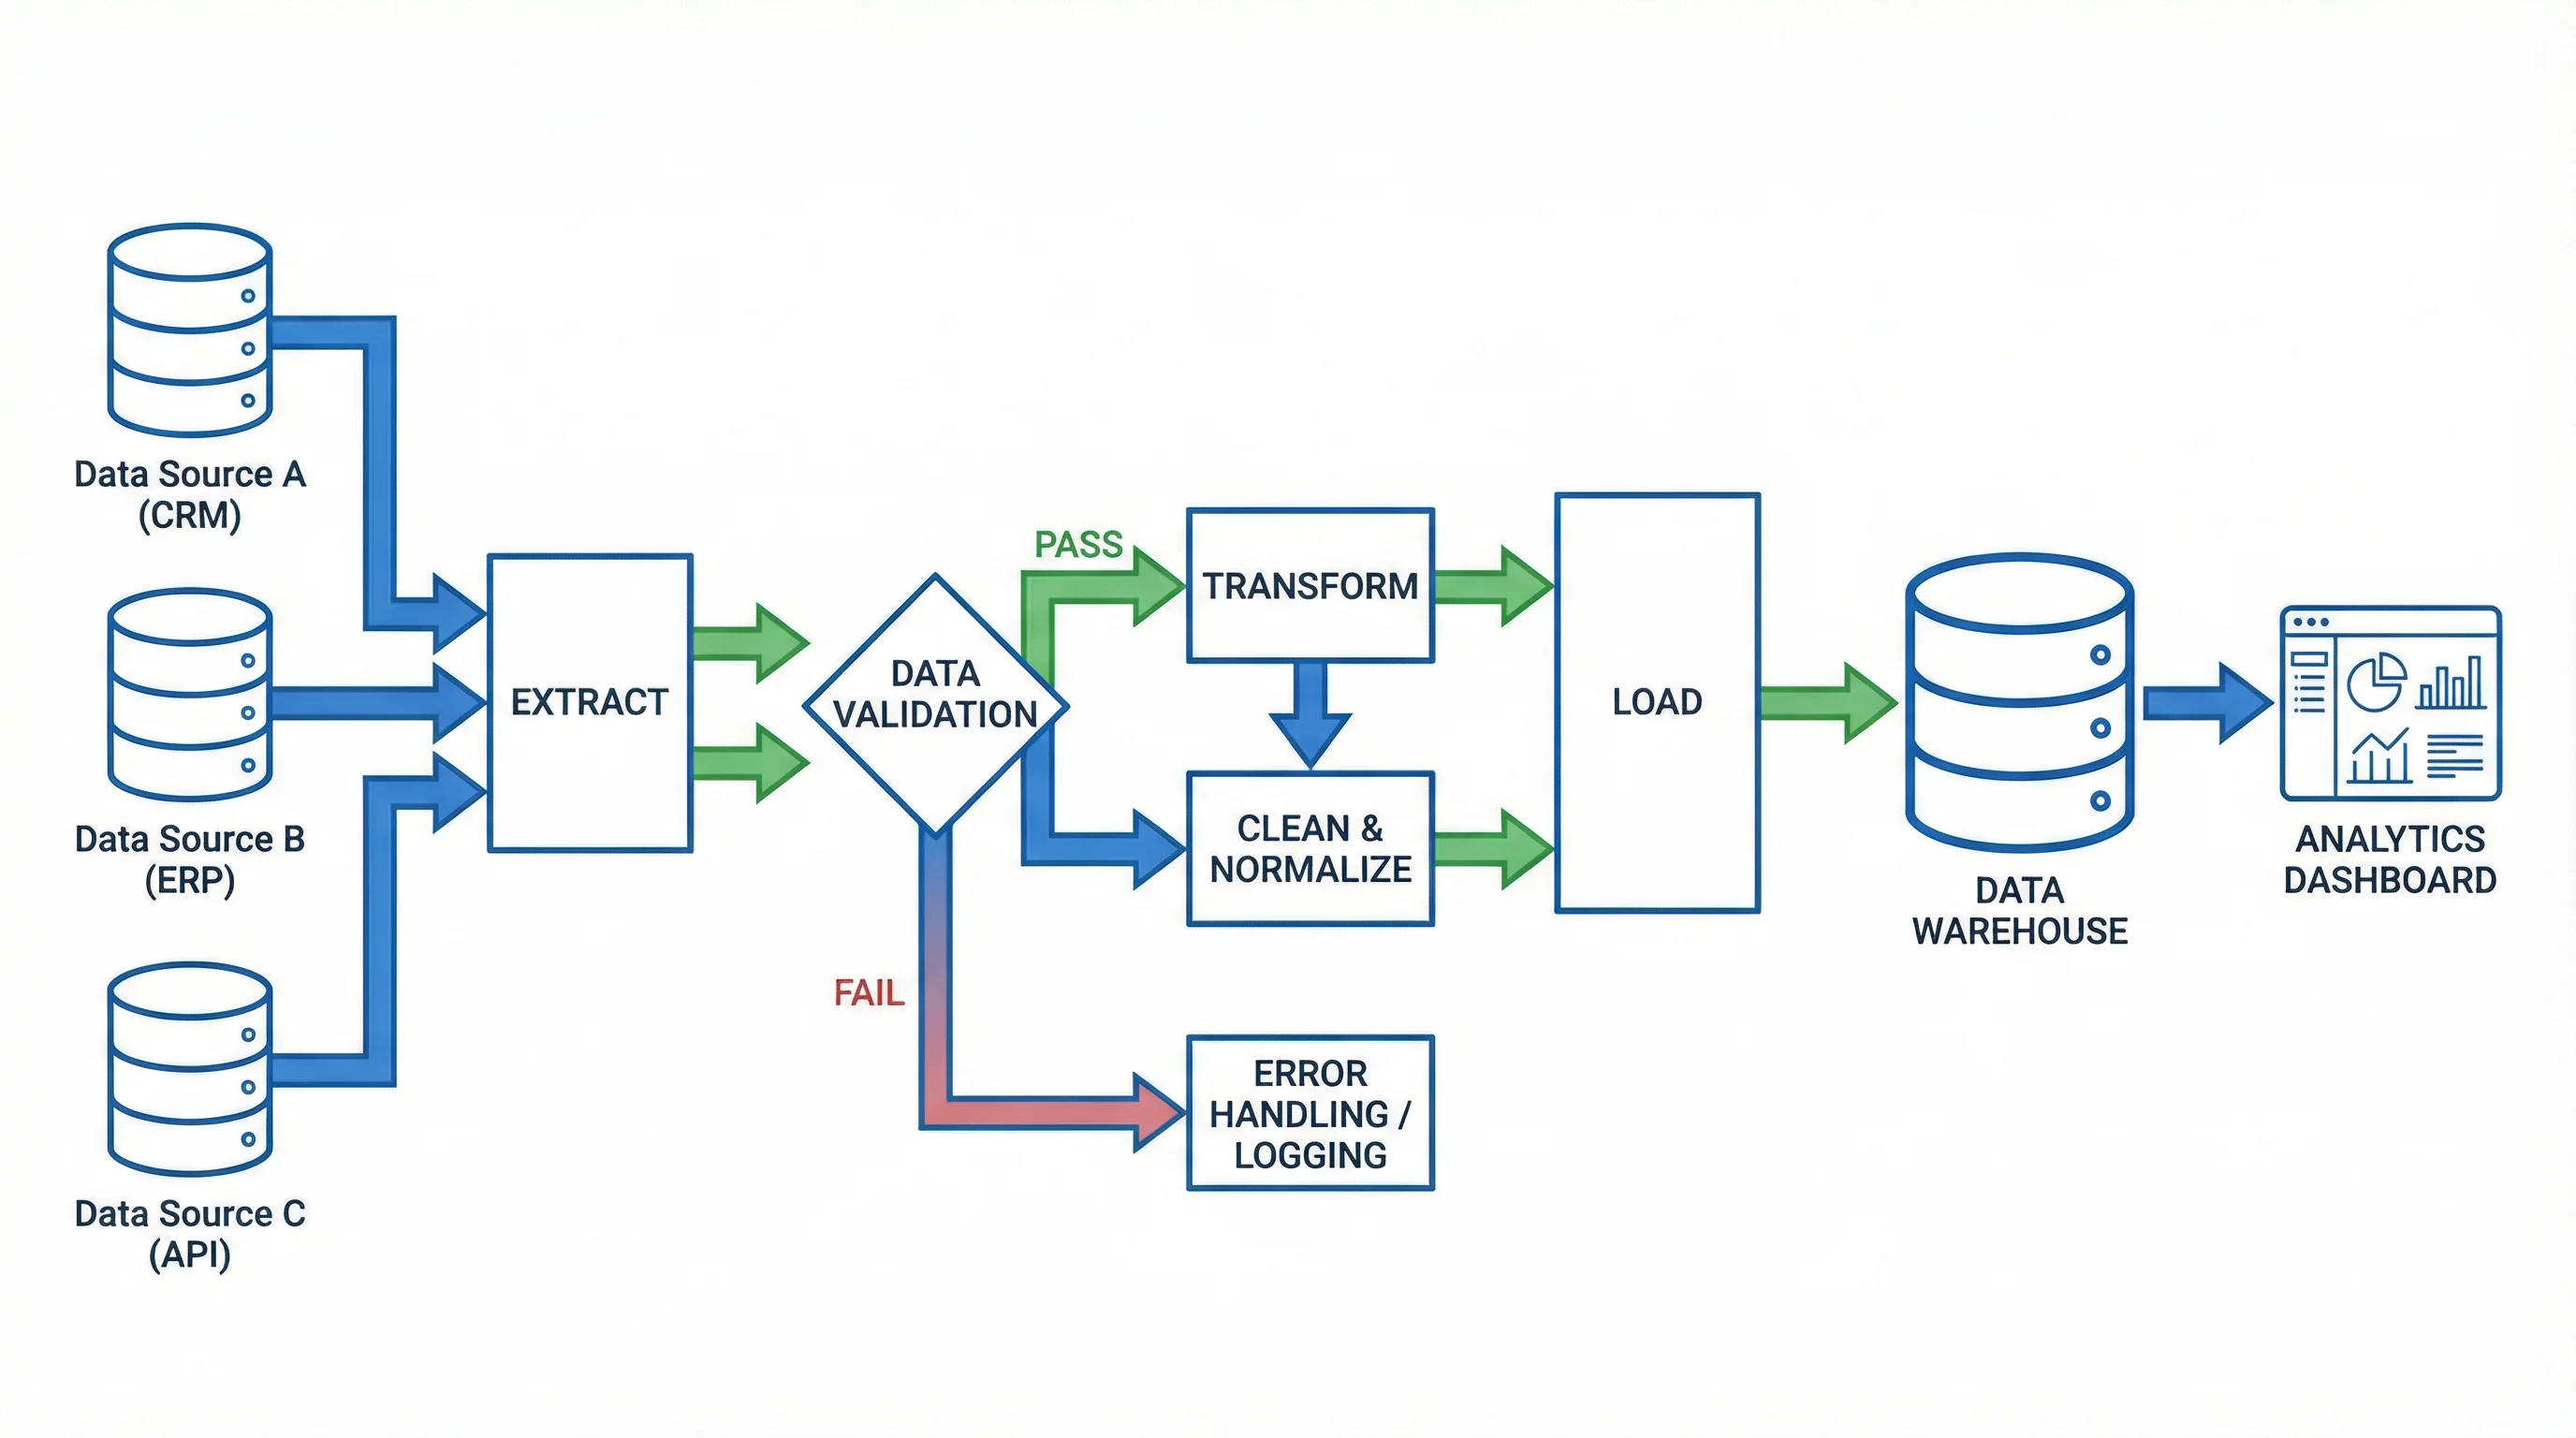
AI Flowchart Generator
Generate flowcharts for processes and pipelines with labeled steps and decisions.
 Research
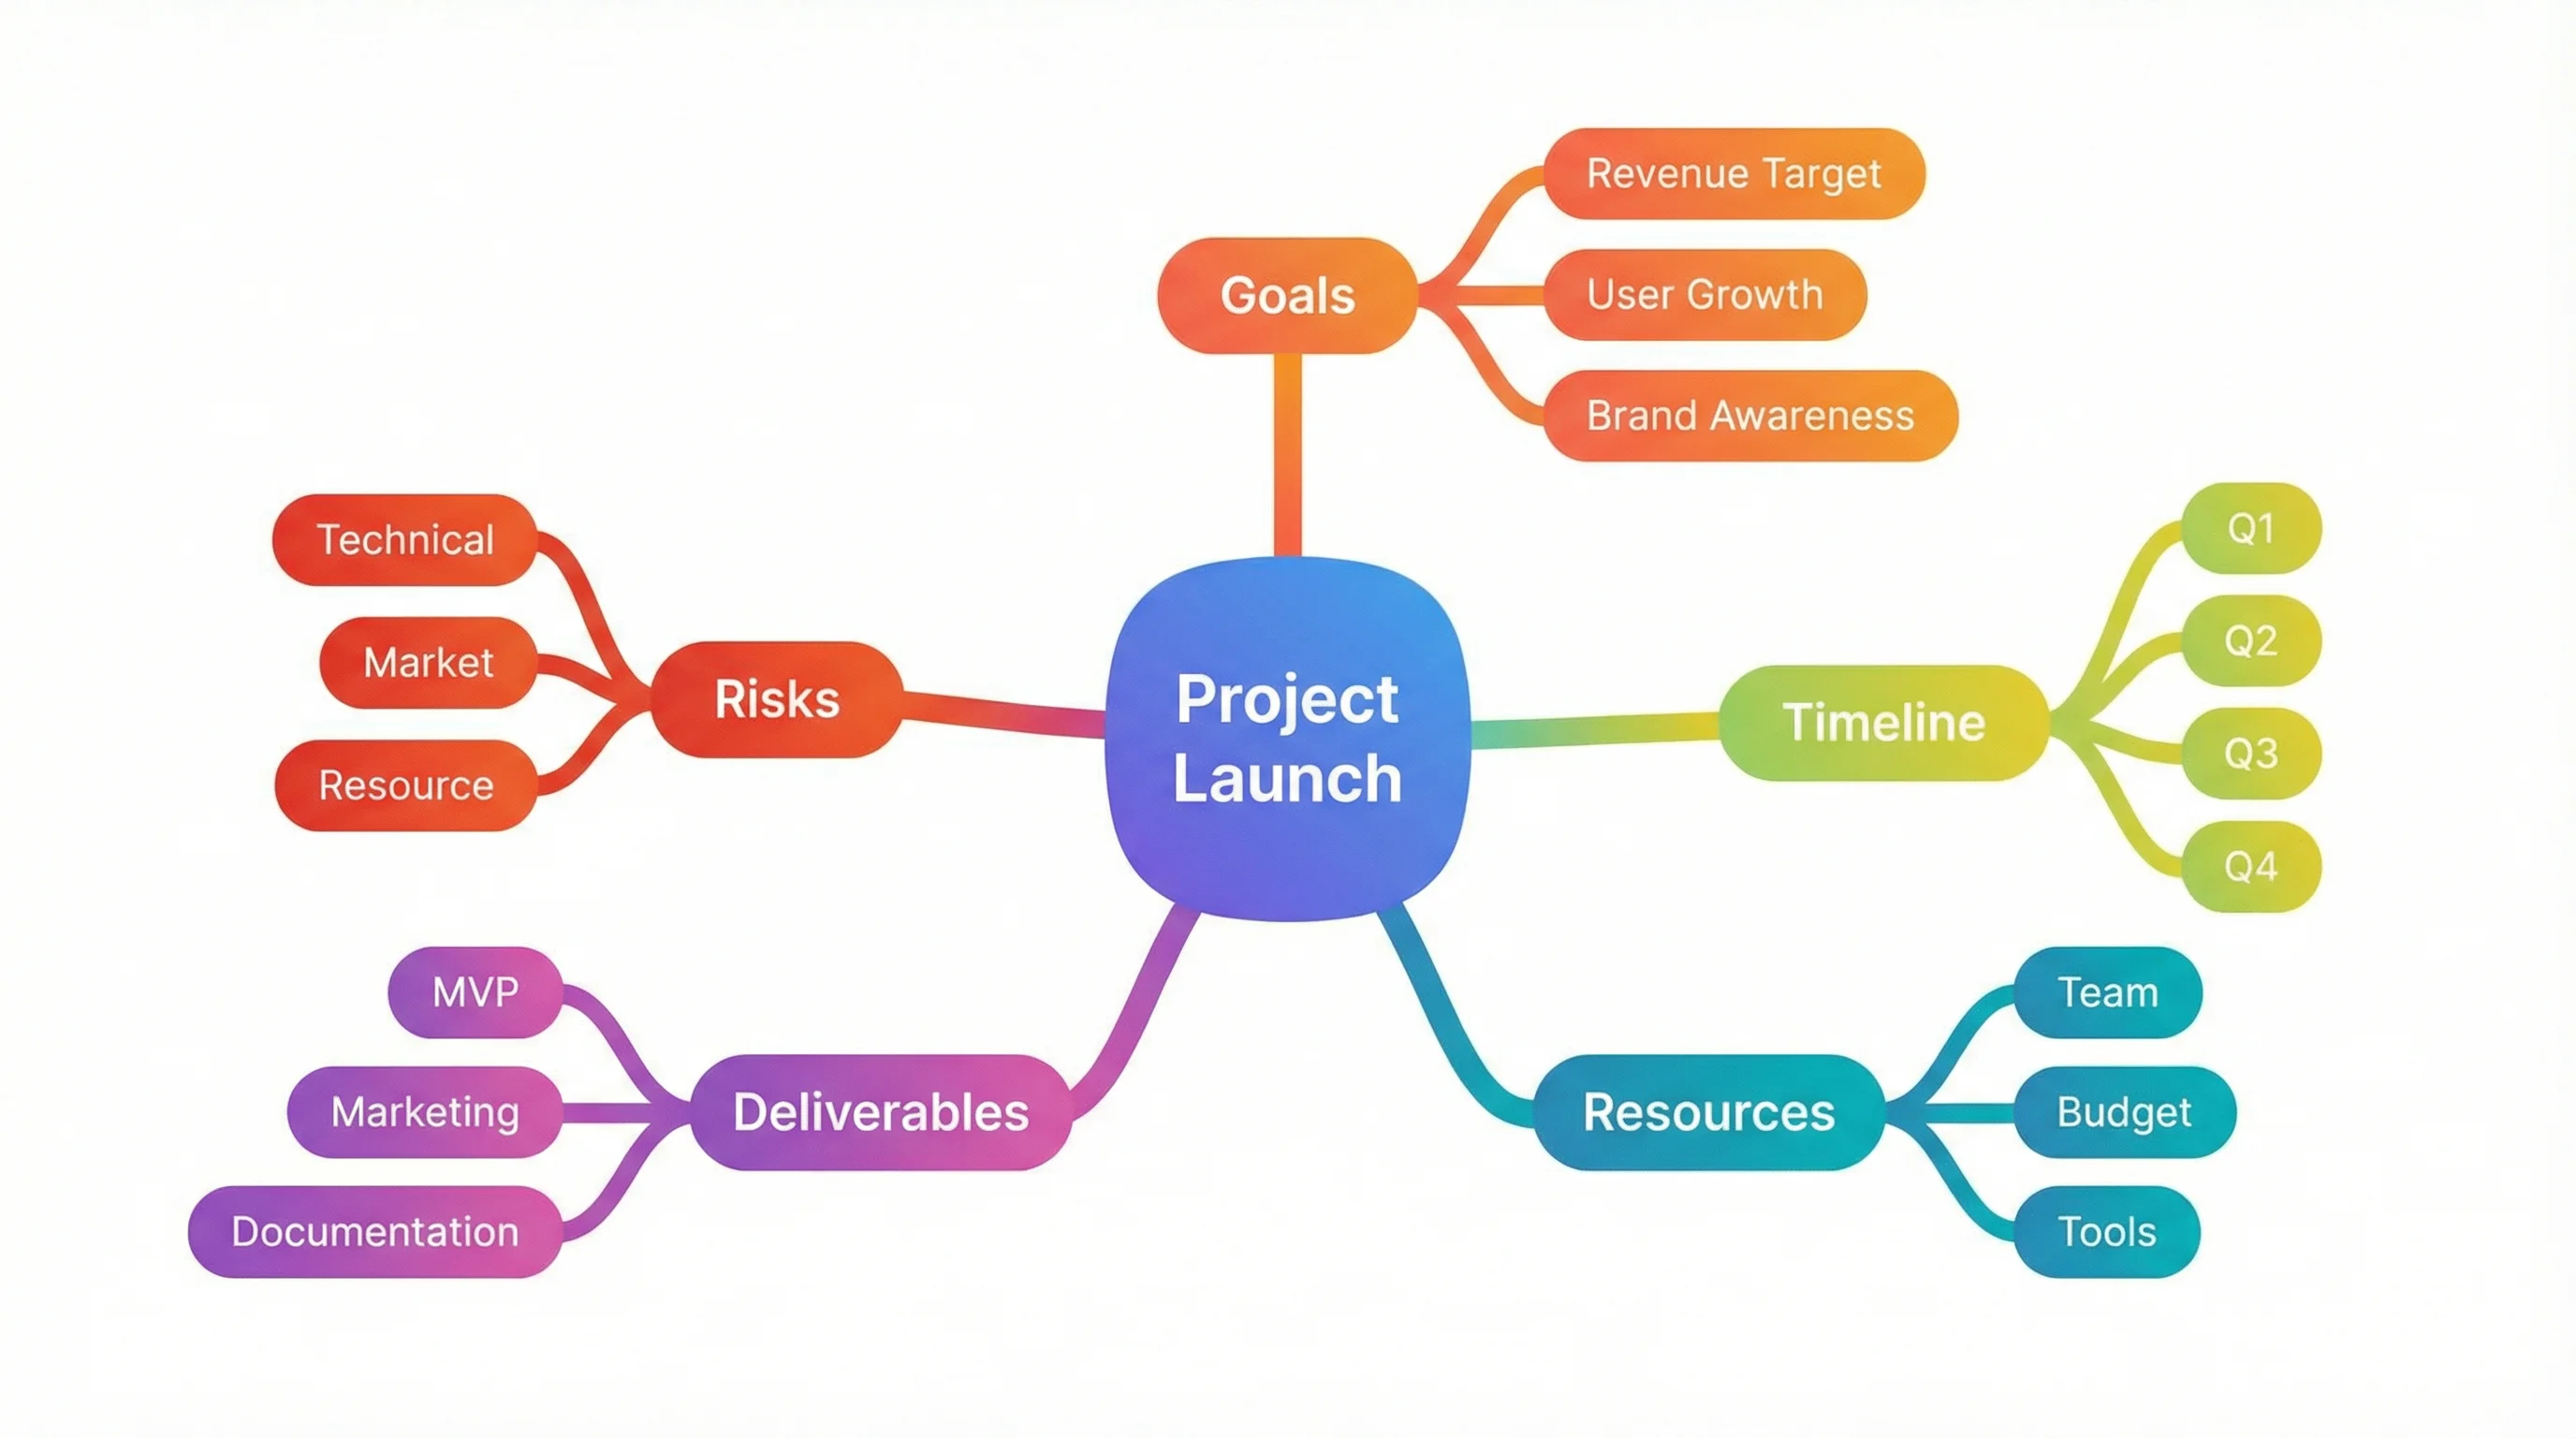
Mind Map Generator
Organize a topic into a structured mind map with branches and sub-branches.