Context Diagram Generator for Level 0 DFDs
Draw a context diagram (Level 0 DFD) online. Describe your system and the AI maps the single central process, external entities, labeled data flows, and the system boundary — download as PNG.
AI Context Diagram Generator
Free to try ·
Your context diagram will appear here
Describe the central system, external entities, and data flows
Context Diagram Examples
Level 0 DFDs across e-commerce, healthcare, banking, education, and more
E-Commerce System
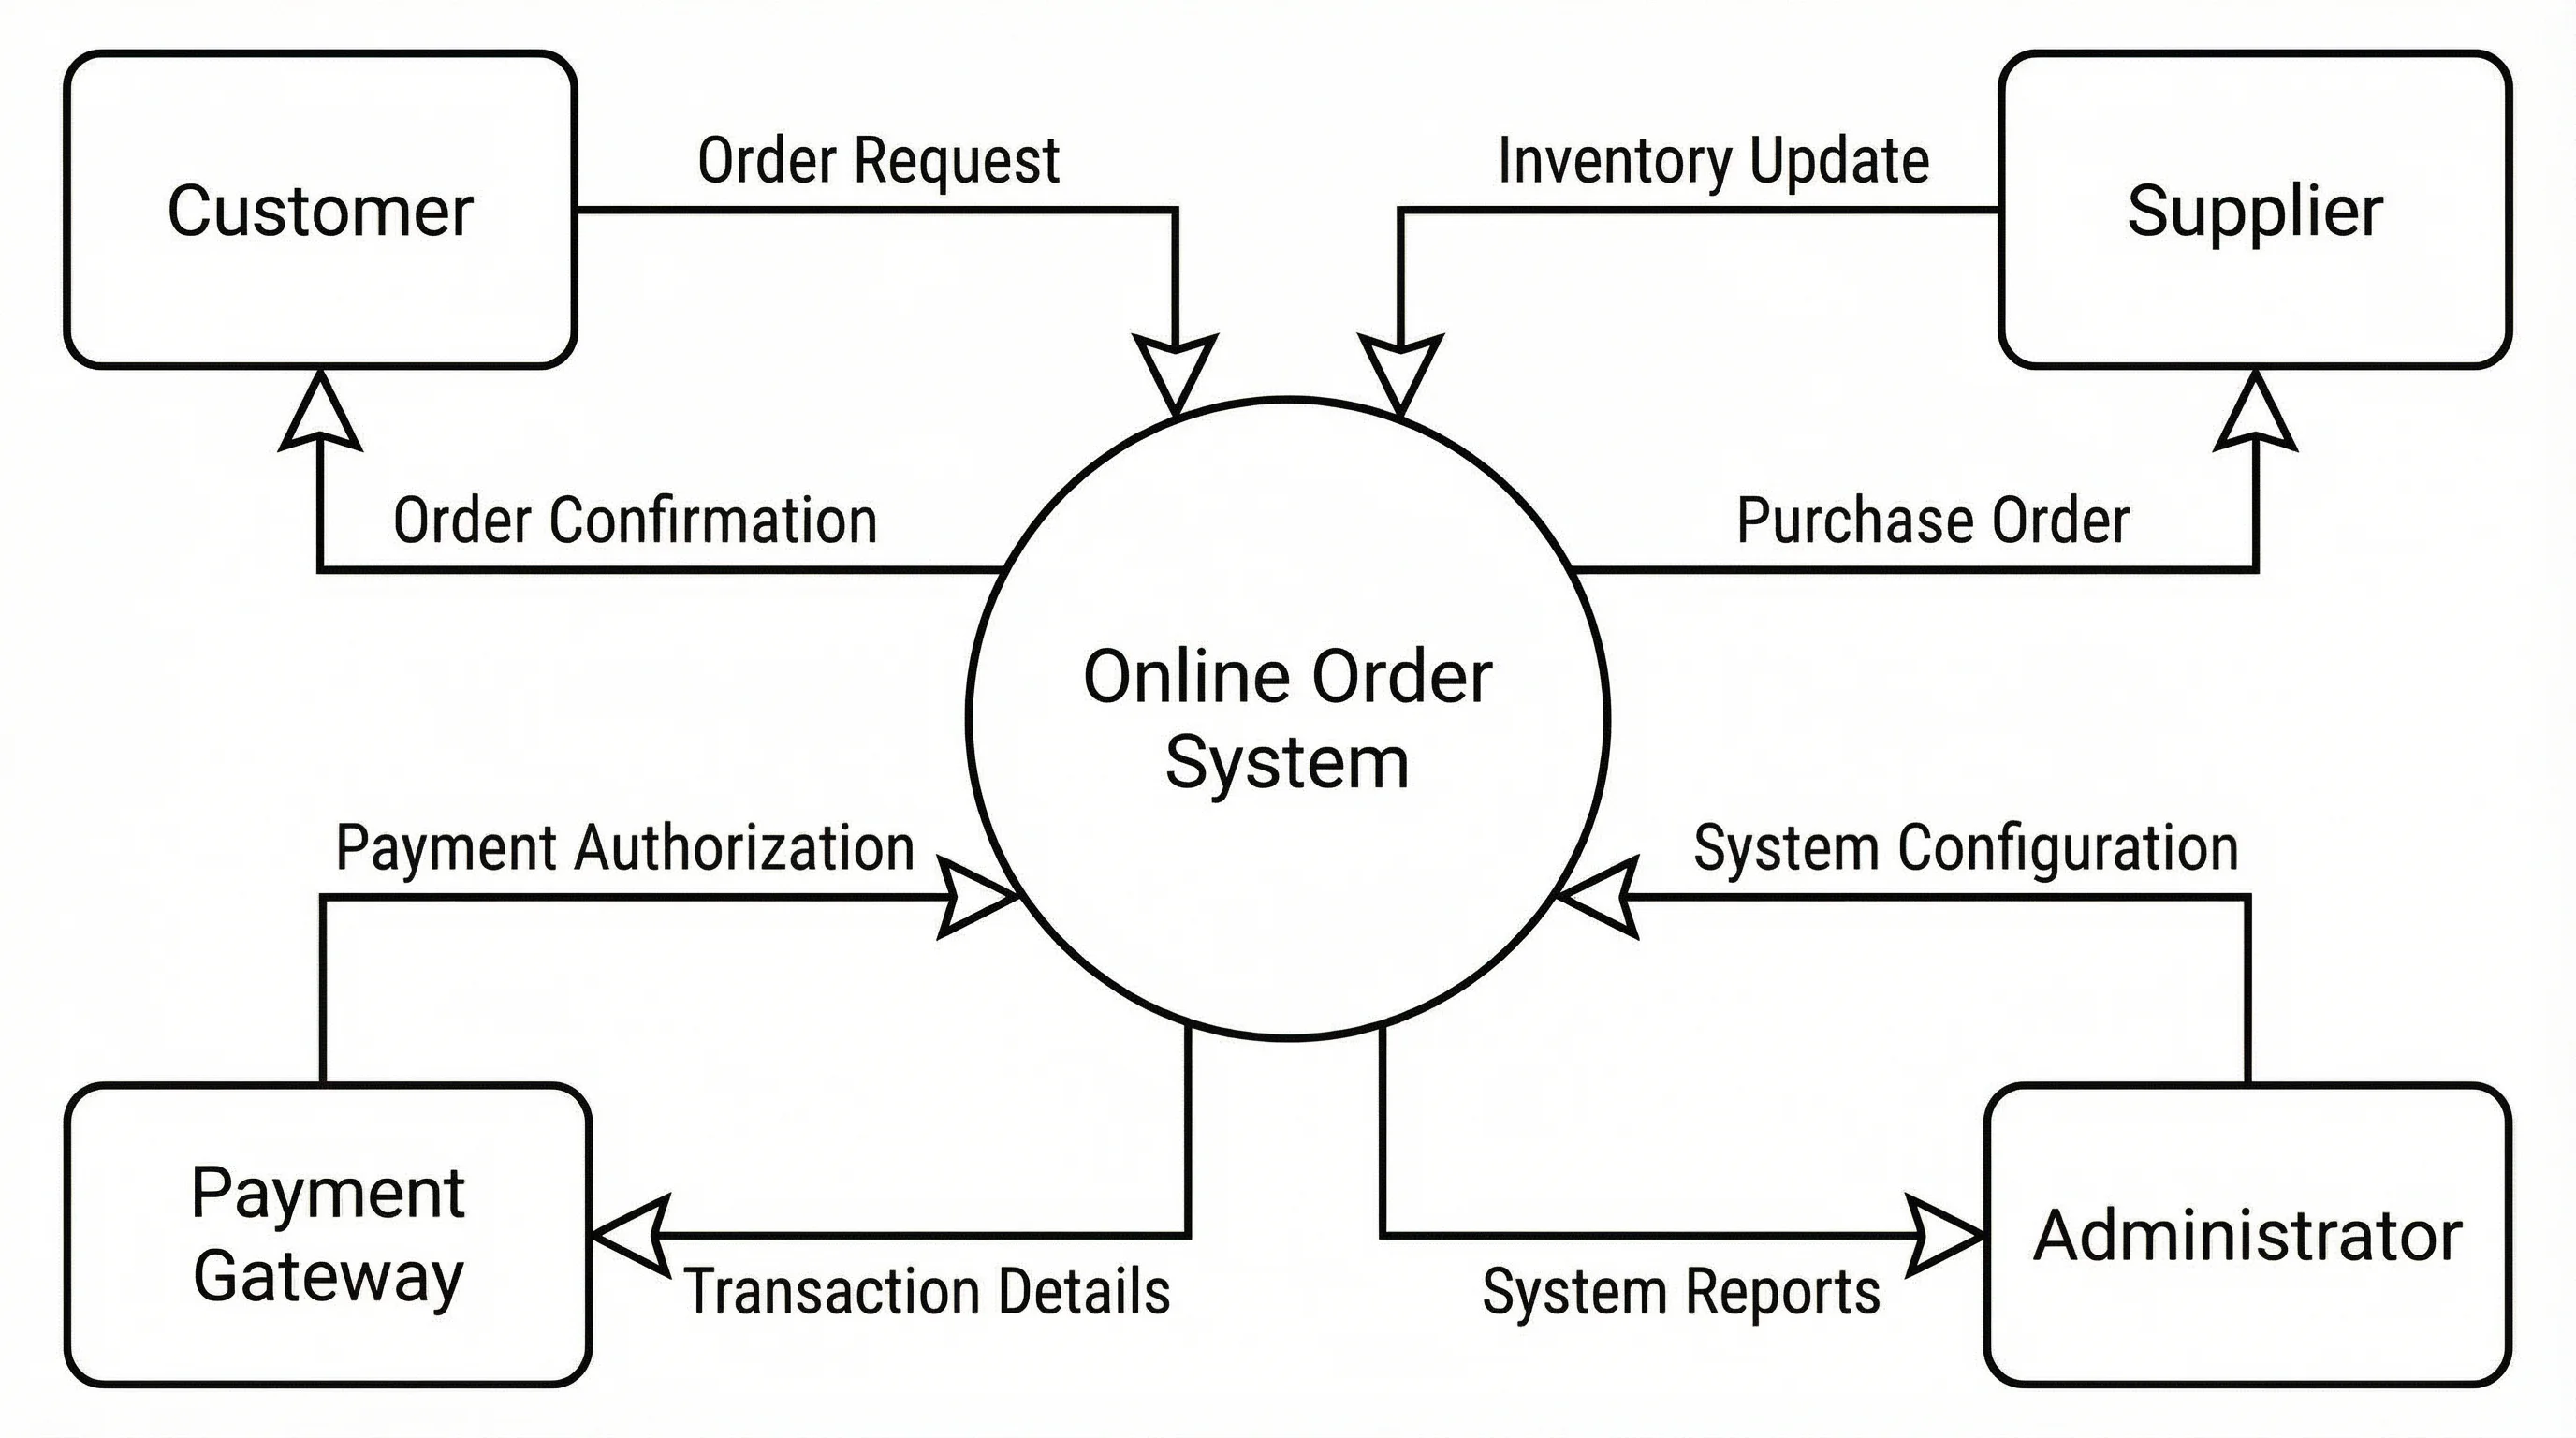
One central system, five external entities, and labeled order, payment, and shipping flows.
Hospital Management System
A healthcare example mapping appointments, records, prescriptions, claims, and lab results.
Online Banking System
A financial system boundary with regulatory, ATM, credit-check, and merchant data flows.
University Enrollment System
A campus example with enrollment requests, approvals, transcripts, and financial aid flows.
Supply Chain System
A logistics boundary showing purchase orders, shipments, inventory, and delivery tracking.
Mobile App Backend
A software example treating the backend as one process with its external service flows.
What is a context diagram?
A context diagram is the highest-level view of a system. It shows the whole system as a single process — one box or circle in the middle — and the external entities (people, organizations, or other systems) it exchanges information with. The arrows between them are data flows, and the implied line around the central process is the system boundary: everything inside is your system, everything outside is its environment. A context diagram answers one question clearly: what does this system touch, and what crosses its edge? It deliberately hides internal detail, so a stakeholder can grasp the scope of a system at a glance without reading a single line of code or a detailed specification.
Context diagram and Level 0 DFD: the same thing
A context diagram is also called a Level 0 Data Flow Diagram (DFD). In DFD numbering, Level 0 is the top of the hierarchy: the entire system is drawn as one numbered process, with no internal processes or data stores shown. When you decompose that single process into its major sub-processes, you get a Level 1 DFD; break those down further and you reach Level 2 and beyond. So a context diagram is simply the zoomed-out, single-process starting point of a DFD set. Because the term "Level 0 DFD" and "system context diagram" are used interchangeably in most software-engineering courses and analysis textbooks, you will see all three names describing the exact same picture.
The four core elements
- Central process (the system): one shape representing the entire system you are scoping — drawn as a single circle or rounded box, usually numbered 0.
- External entities: the sources and destinations of data — customers, suppliers, regulators, or other systems — drawn as rectangles around the edge.
- Data flows: labeled arrows showing what information moves in and out (for example "Order Request" inbound and "Order Confirmation" outbound). Each arrow names the data, not the action.
- System boundary: the conceptual line separating the central process from its external entities — it defines exactly what is in scope and what is not.
Context diagram vs DFD vs system context diagram
These terms overlap, so it helps to pin them down. A context diagram (or system context diagram) is the single-process, top-level view — the Level 0 DFD. A full data flow diagram is the broader family: it includes that Level 0 view plus the lower levels (Level 1, Level 2) that open the central process up to reveal internal processes, data stores, and the flows between them. In short, the context diagram is one specific DFD — the most abstract one — while "DFD" refers to the whole layered model. If someone hands you a "business context diagram" or a "context chart," they almost always mean this same Level 0 view focused on a business system and its surrounding actors.
Why business analysts and designers use them
A context diagram is one of the first artifacts in system analysis because it forces agreement on scope before anyone builds anything. Business analysts use it to confirm with stakeholders which systems, departments, and partners interact with a new system, and to surface integrations that are easy to forget — a payment gateway, a regulator, a legacy database. System designers use it to define interfaces and ownership: every external entity on a context diagram becomes an integration point that needs an API, a file feed, or a contract. Project managers use it to bound the work, and CS students use it as the entry point for the rest of a DFD. Because it sits above the technical detail, it is also the diagram you put in front of non-technical readers in a requirements document or a kickoff deck.
How to make a context diagram from a description
Start by naming the one system you are scoping — that becomes the central process. Then list every external entity that sends or receives information from it, and for each one write down the data that crosses the boundary in each direction. Describe all of that in plain language and the generator draws it: the central process in the middle, external entities arranged around it, and labeled data-flow arrows connecting them, all in clean Level 0 DFD style. Keep the scope tight — a good context diagram has one process and only the entities that genuinely touch it. Generate a few versions, pick the clearest, refine your wording for any missing flow, and download the result for your report or slide.
Frequently Asked Questions
Related Diagram Tools
 Software
Data Flow Diagram Generator
Go beyond Level 0 — draw full DFDs with processes, data stores, and flows.
 Software
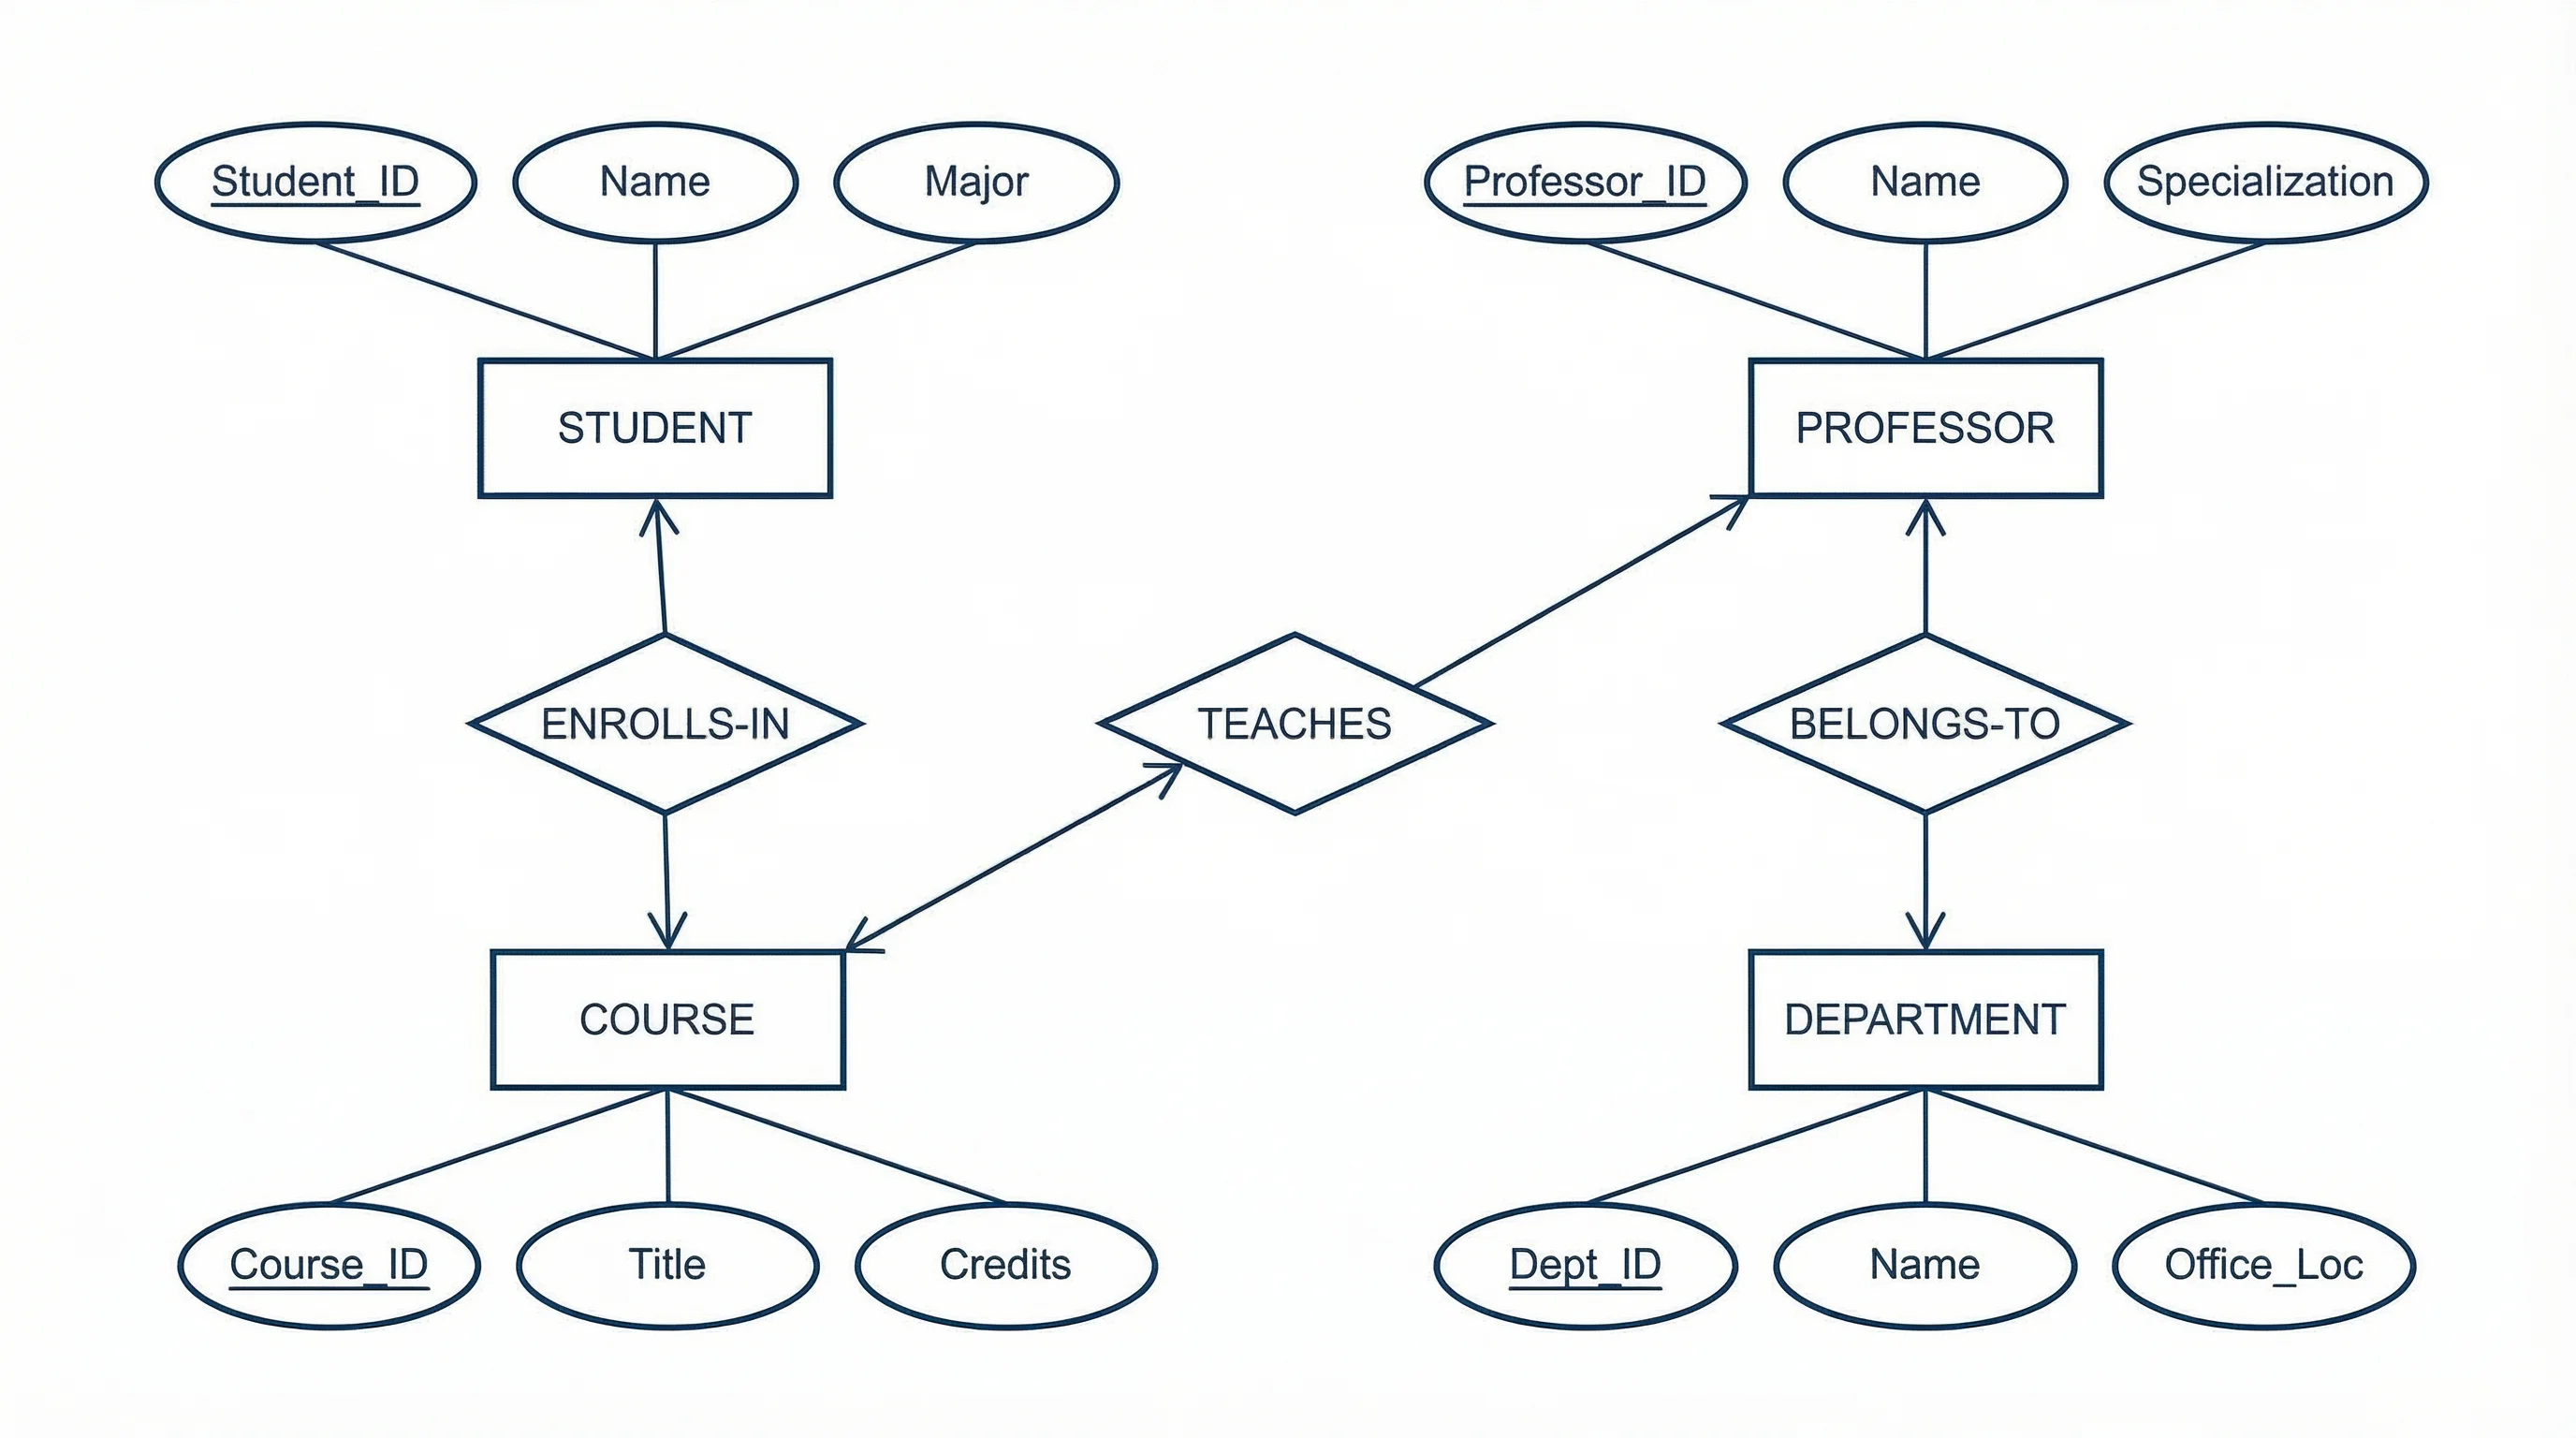
ER Diagram Generator
Model the data behind a system with entities, attributes, and relationships.
 Diagrams
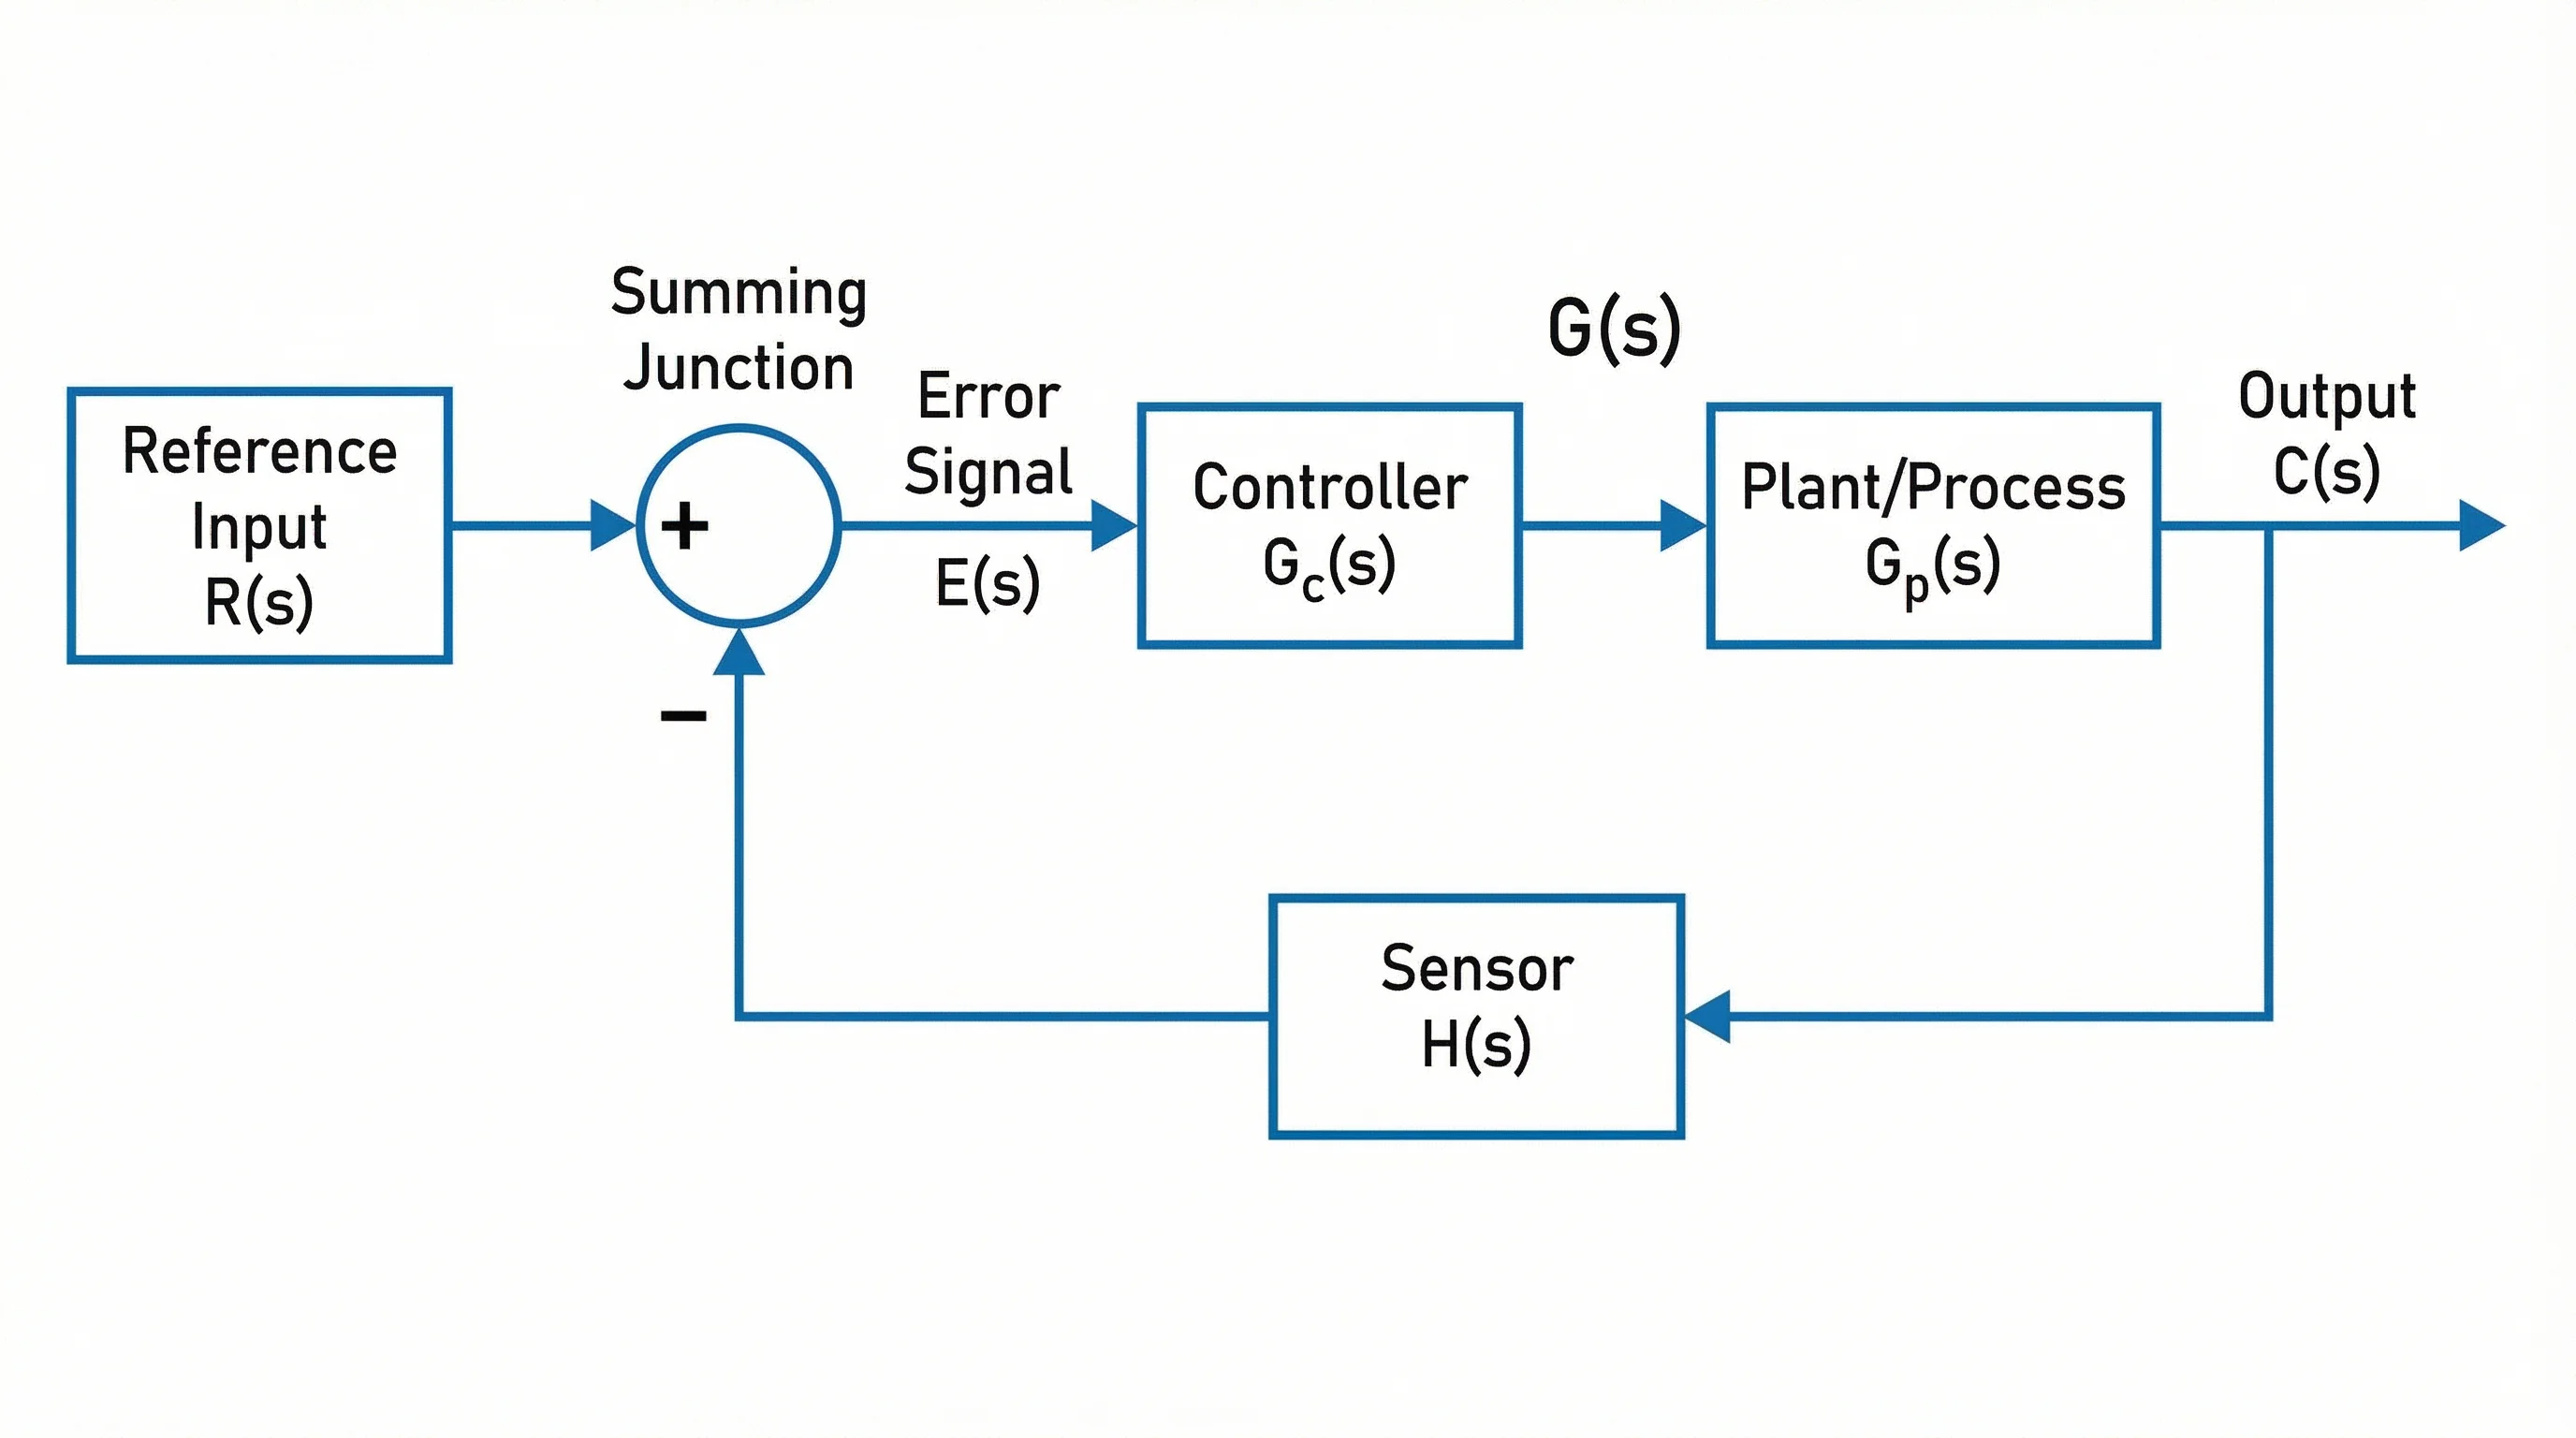
Block Diagram Generator
Show system components as labeled blocks connected by signal and data lines.
 Diagrams
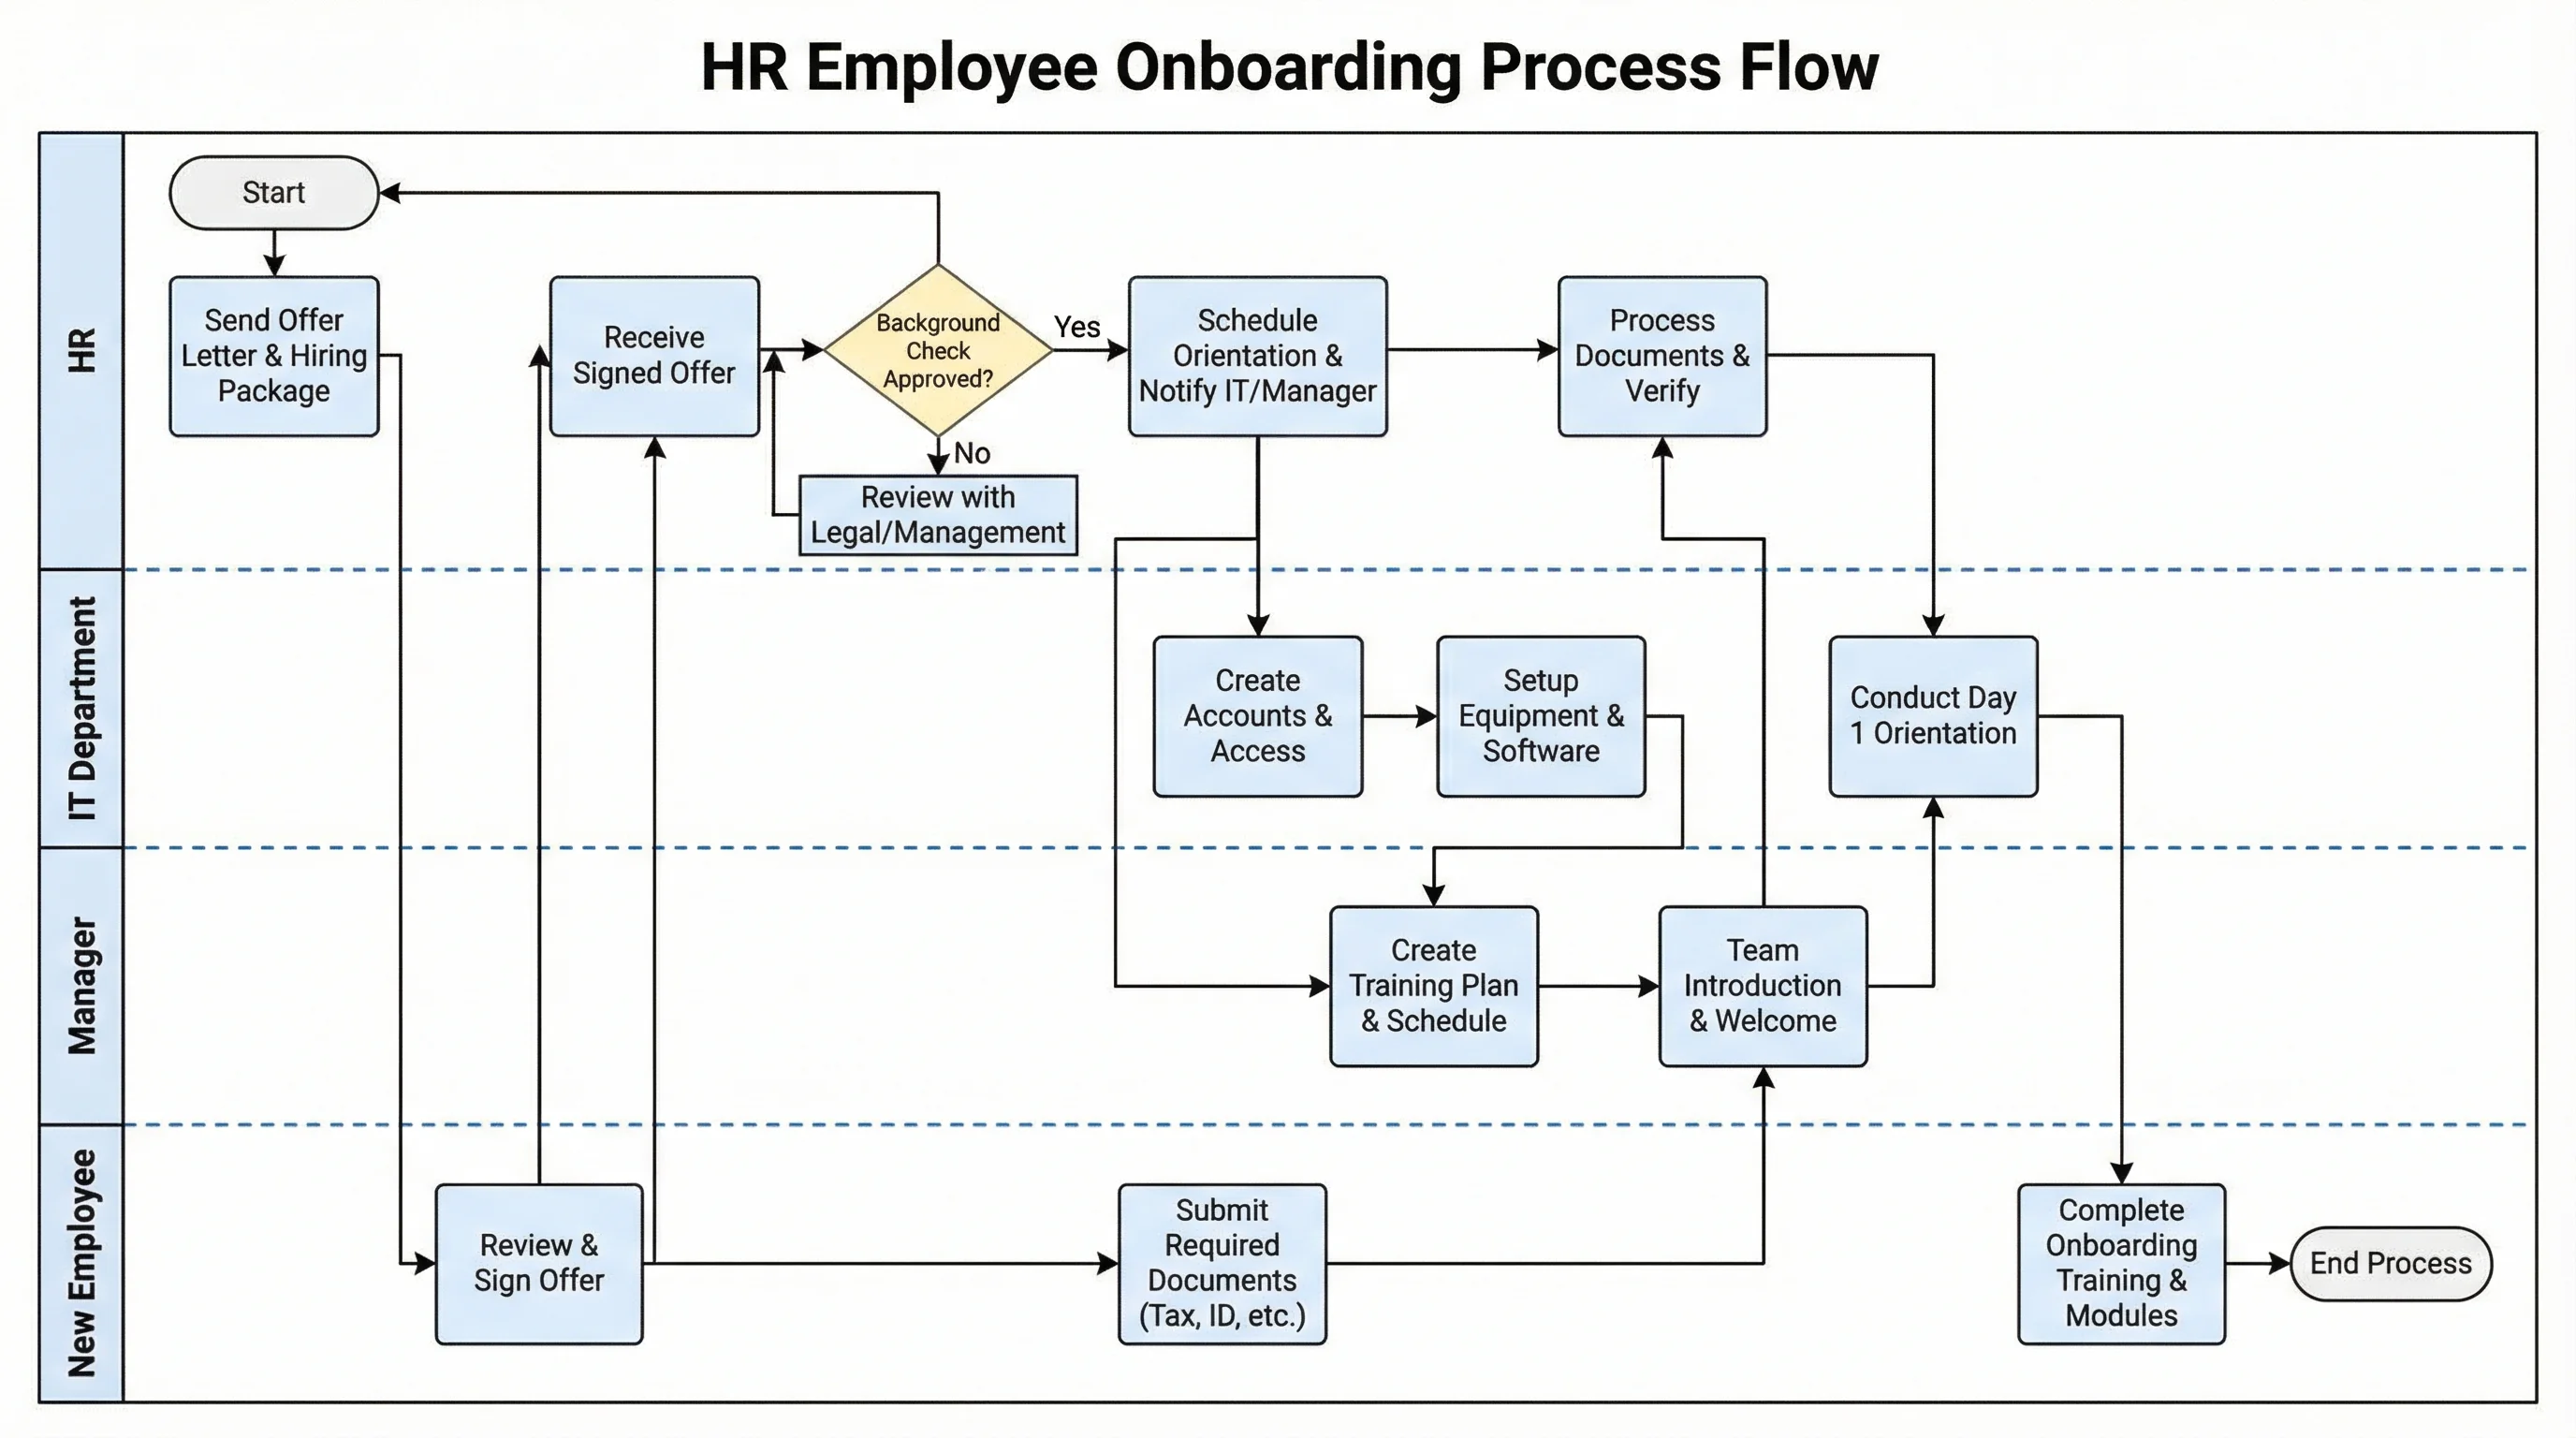
Swimlane Diagram Generator
Map a process across roles and departments with clear, labeled lanes.