pH Scale Chart 0 to 14 with Examples
Free pH scale chart from 0 to 14 with sourced examples, acid and base colors, indicator ranges and a pH, [H+] and pOH calculator. Printable.
pH 7.00
Neutral at 25 °C
[H⁺] = 1 × 10⁻⁷ M, [OH⁻] = 1 × 10⁻⁷ M, pOH = 7.00
Substances within 0.5 pH of this value
- Pure water (25 °C): 7
- Human blood: 7.35 to 7.45
Colors are approximate and vary by indicator formulation. Hover or tap a number, or use the slider.
Free pH Scale Charts and Worksheets
Every sheet below is drawn from the same checked data as the tool above. View, download and print them free, no sign-up.
pH Scale Chart 0 to 14 with Examples
A 0 to 14 color band with each example plotted at its sourced pH range.
pH charts
Printer friendly
Reference charts
Study aids
Studying acids and bases? Pair this chart with the pKa table for acid strength, plot a titration curve, or check redox data in the standard reduction potential table.
What is the pH scale?
The pH scale measures how acidic or basic a water-based solution is. It is defined as pH = -log10[H+], where [H+] is the hydrogen ion (hydronium) concentration in moles per liter. In pure water at 25 °C the concentration is 1.0 × 10⁻⁷ M, so the pH is 7.00 and the solution is neutral. Values below 7 are acidic, values above 7 are basic, and pOH, defined the same way for hydroxide ions, adds up with pH to 14.00 at 25 °C. Most everyday substances fall between 0 and 14, which is why the scale is drawn that way, but strong concentrated acids and bases can give a pH below 0 or above 14.
Why each pH step is a factor of 10
- Because pH is a logarithm, a change of one pH unit means the hydrogen ion concentration changed by a factor of 10. A solution at pH 3 has 10 times more H+ than one at pH 4 and 100 times more than one at pH 5. Lemon juice (about pH 2) and normal rain (about 5.6) are about 3.6 pH units apart, which is roughly 4,000 times in H+ concentration, even though the numbers look close.
- This is also why small pH changes matter. Surface seawater has moved from about 8.2 to about 8.1 since industrialization, which Woods Hole Oceanographic Institution describes as roughly a 26 percent rise in acidity. The log chart in the gallery shows the same idea with bars.
Where common substances sit on the scale
- The examples on this page are listed as ranges because real products vary. Lemon juice runs about 2.0 to 2.6 and vinegar 2.4 to 3.4 in the Clemson Extension list built from FDA and AOAC data. The US EPA gives about 5.6 for normal rain and 4.2 to 4.4 for acid rain. OpenStax lists healthy human blood at 7.35 to 7.45 and household ammonia near 11 to 12.
- Every row in the substances tab links to its source, and rows we could not match to a source were left out. Colors on the chart are approximate. Universal indicator and pH paper mix several dyes, so the exact shades depend on the brand.
How to measure pH
- Litmus paper gives a quick acid or base answer. Universal indicator solution and pH paper give an approximate value by color, usually to the nearest whole unit. A single indicator such as bromothymol blue changes color only over a narrow range (6.0 to 7.6), which is why indicator tables list a range for each one.
- A calibrated pH meter with a glass electrode gives the most precise reading, often to 0.01 units. Temperature matters: Kw changes with temperature, so pure water at 80 °C has [H+] = 4.9 × 10⁻⁷ M and is neutral at pH 6.31. Neutral is pH 7 only at 25 °C.
Choosing an indicator
Pick an indicator whose transition range contains the pH you care about. Methyl orange (3.1 to 4.4) suits titrations that end in acid, phenolphthalein (8.3 to 10.0) suits titrations that end in base, and bromothymol blue (6.0 to 7.6) suits a strong acid and strong base titration ending near 7. The indicators tab lists eleven common ones with colors and both sources checked. To go further, see the pKa table: an indicator changes color around its own pKa plus or minus one unit.
Printing the chart
The Posters tab and the gallery give you the color scale, a black and white version, the substances table, the indicator chart, the ten-fold diagram and the conversion table. Export each as PNG or SVG, or print it on A4 or US Letter landscape. Text sizes are kept large enough that the printout stays readable in a classroom or a lab notebook.
Frequently Asked Questions
Related Chemistry Tools
 Chemistry
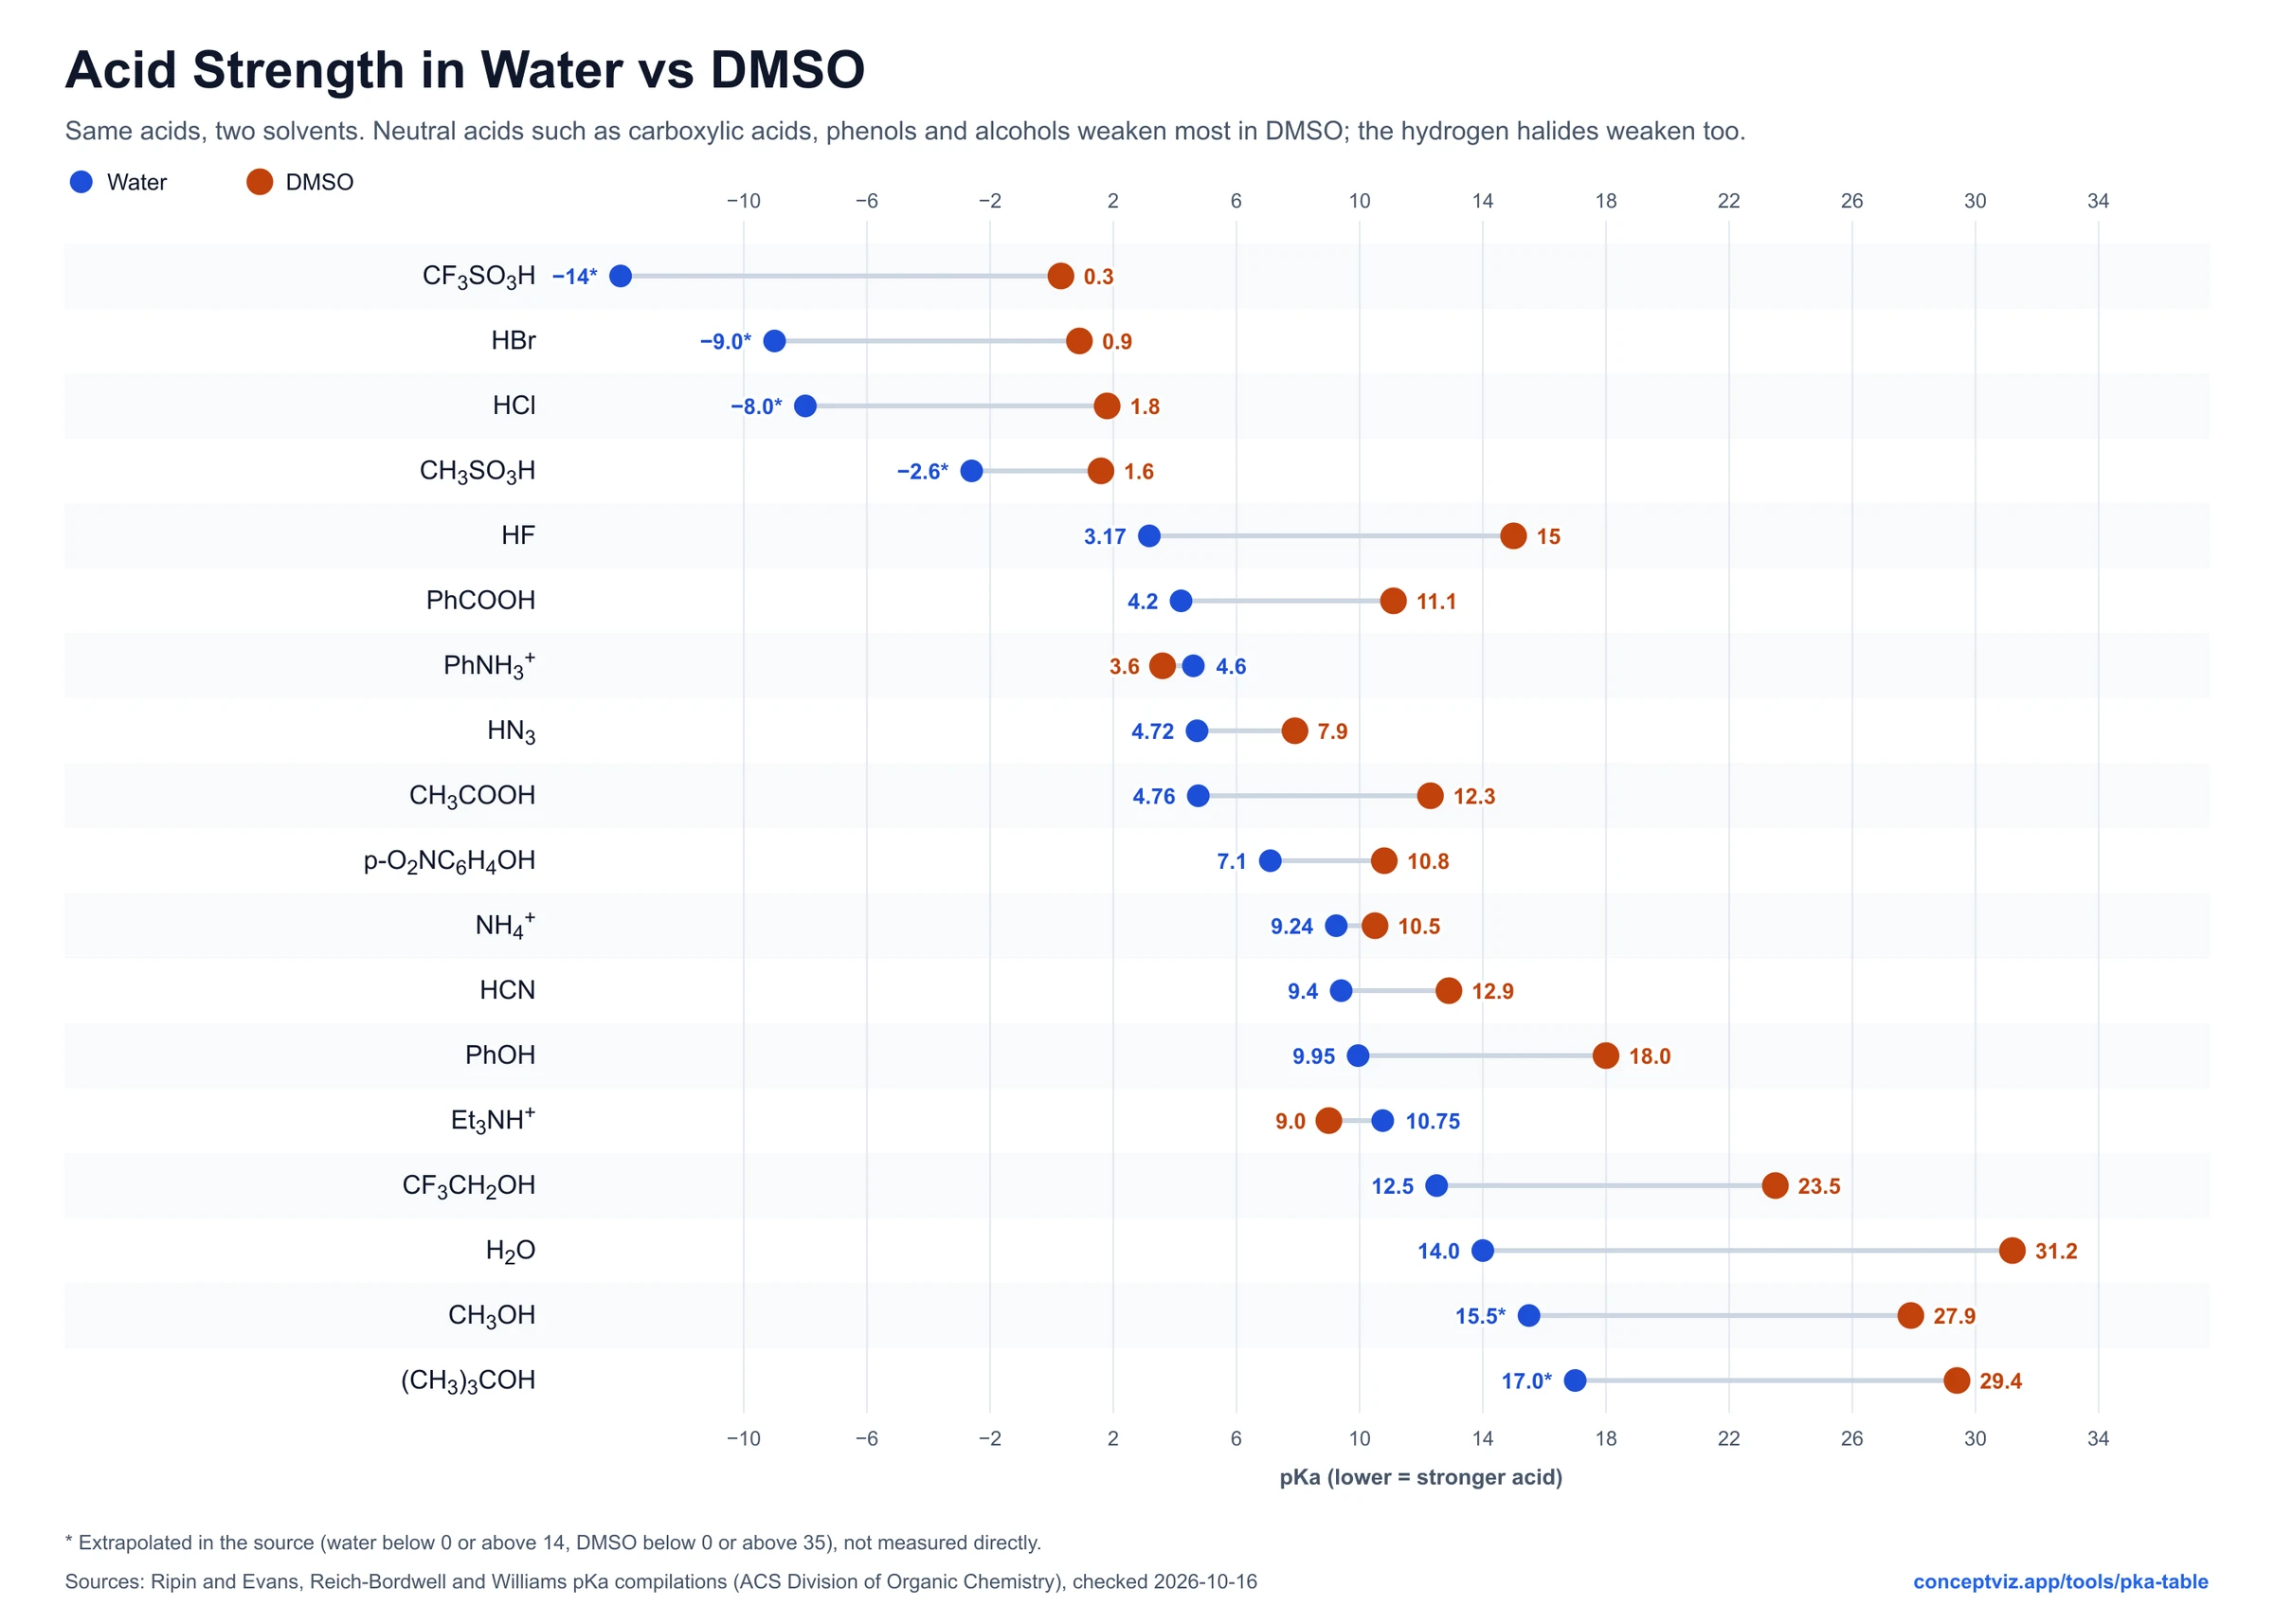
pKa Table
Searchable pKa table with 131 acids: aqueous and DMSO values, conjugate bases, sources and a deprotonation check. Print or download.
 Chemistry
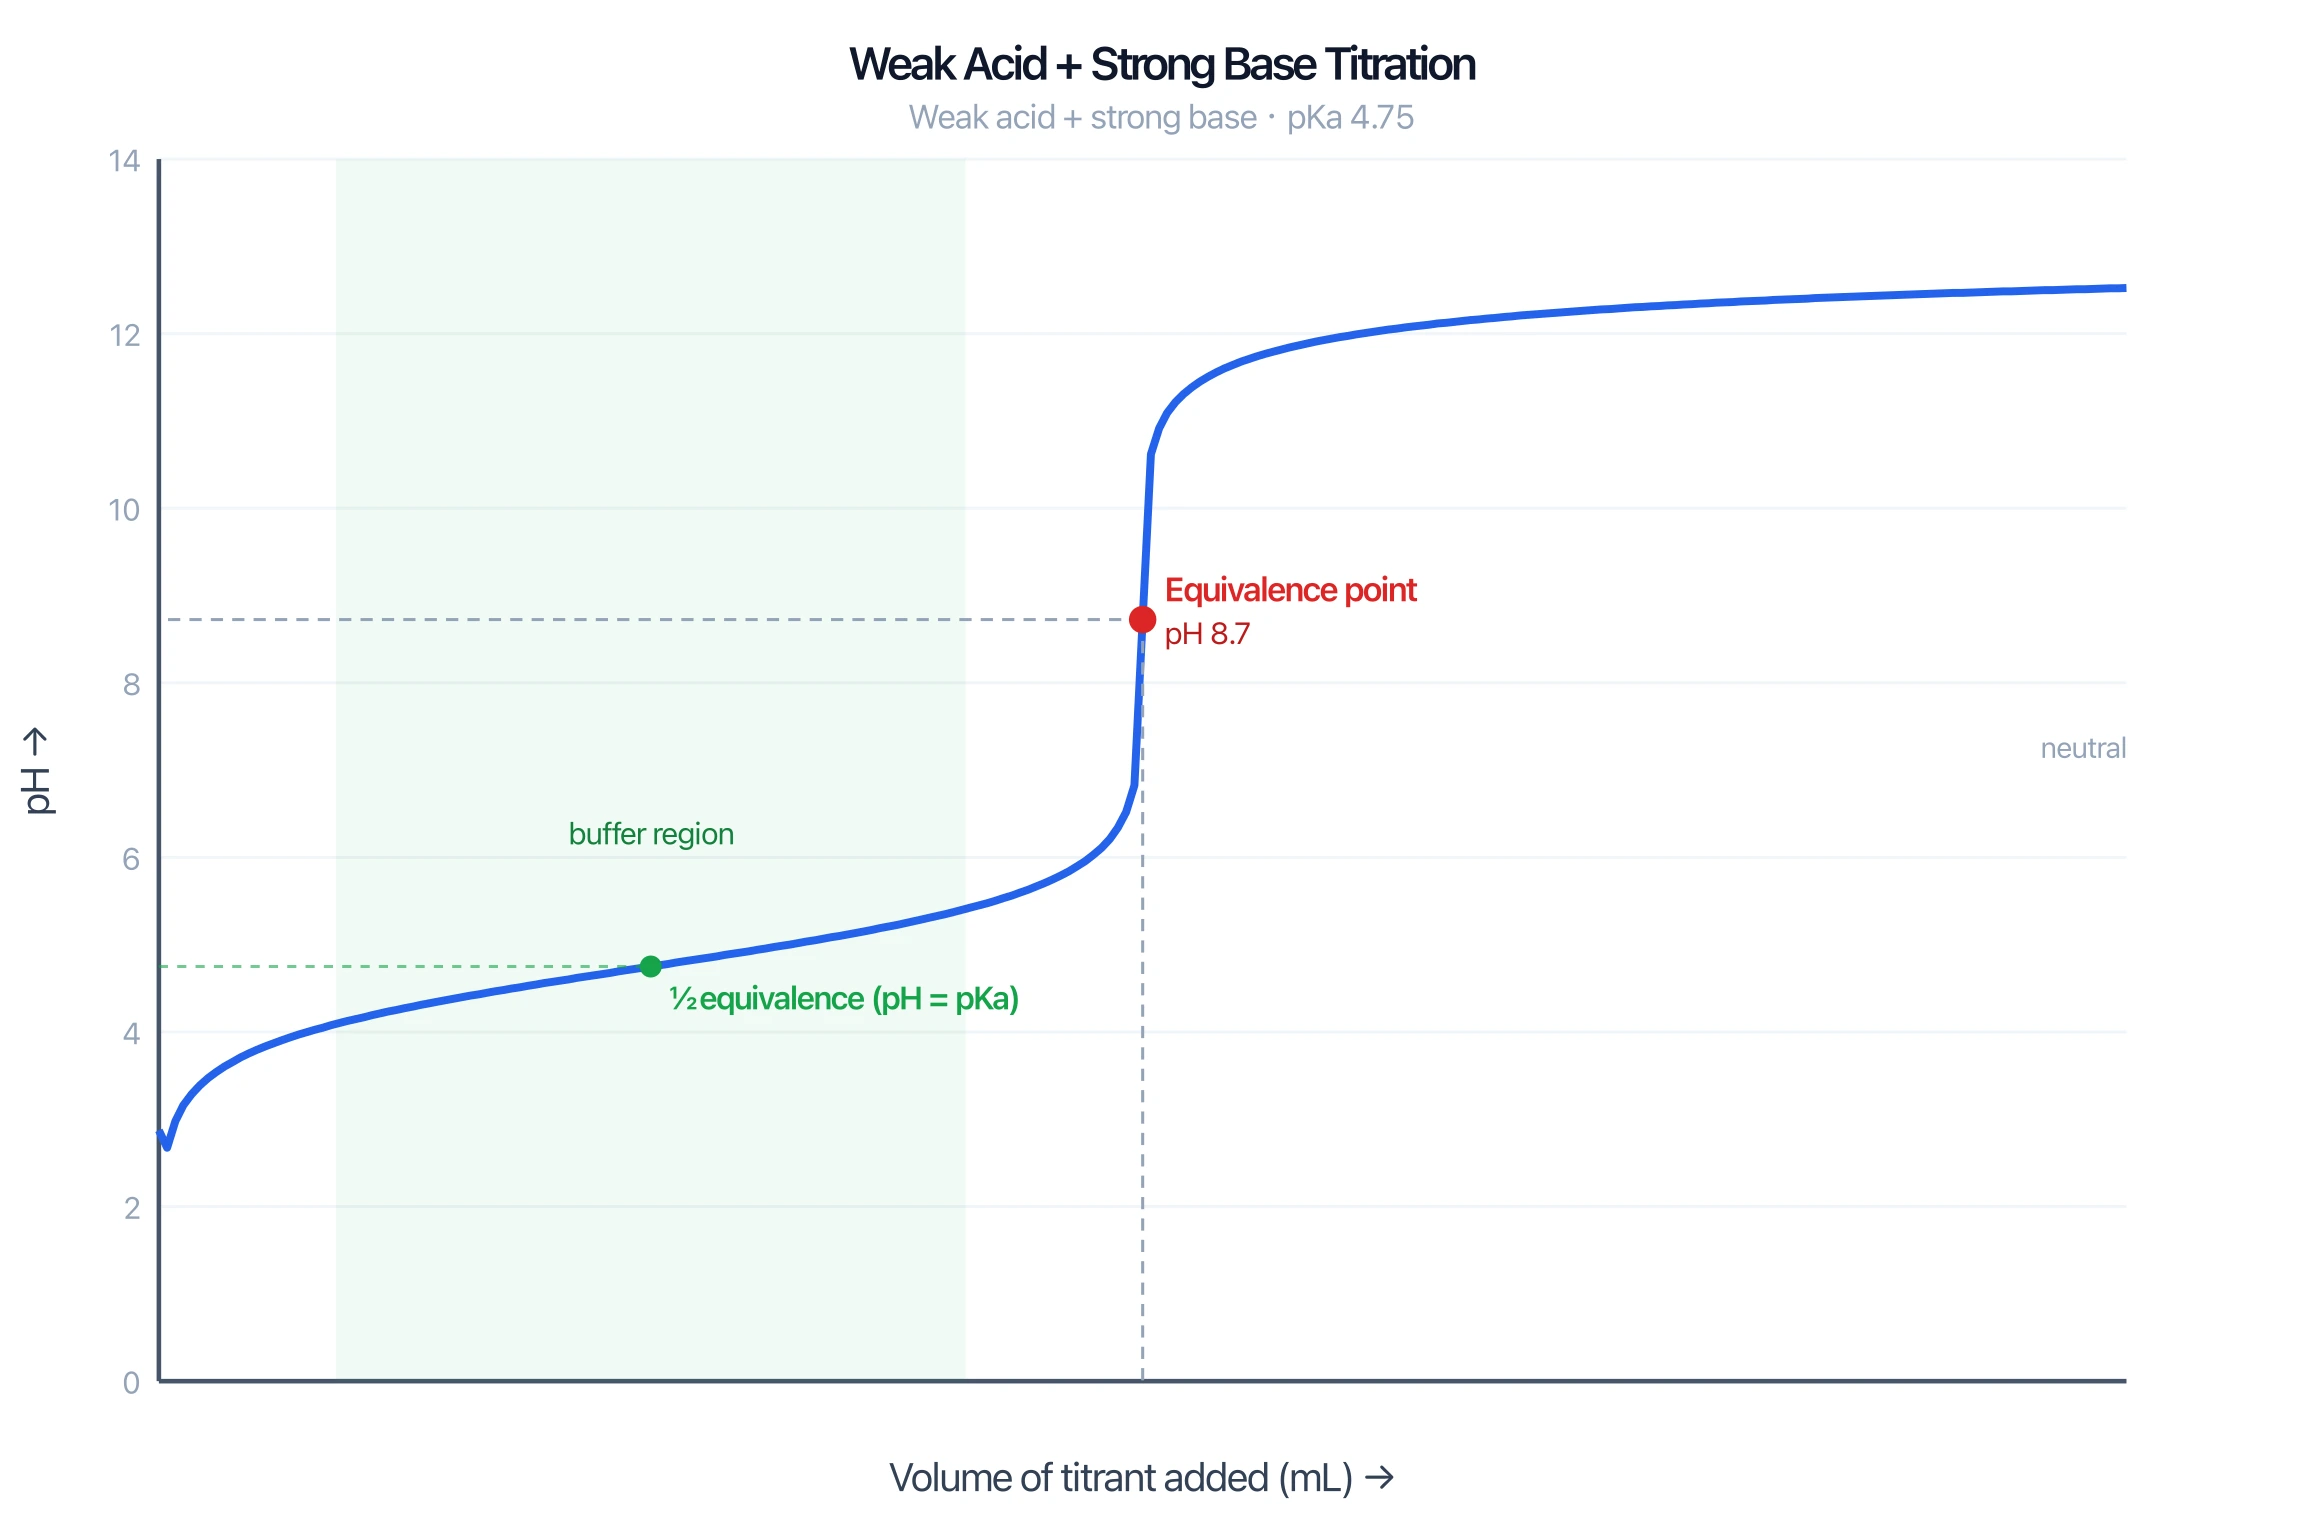
Titration Curve Generator
Generate acid and base titration curves with the equivalence point, half-equivalence point (pH = pKa) and buffer region marked.
 Chemistry
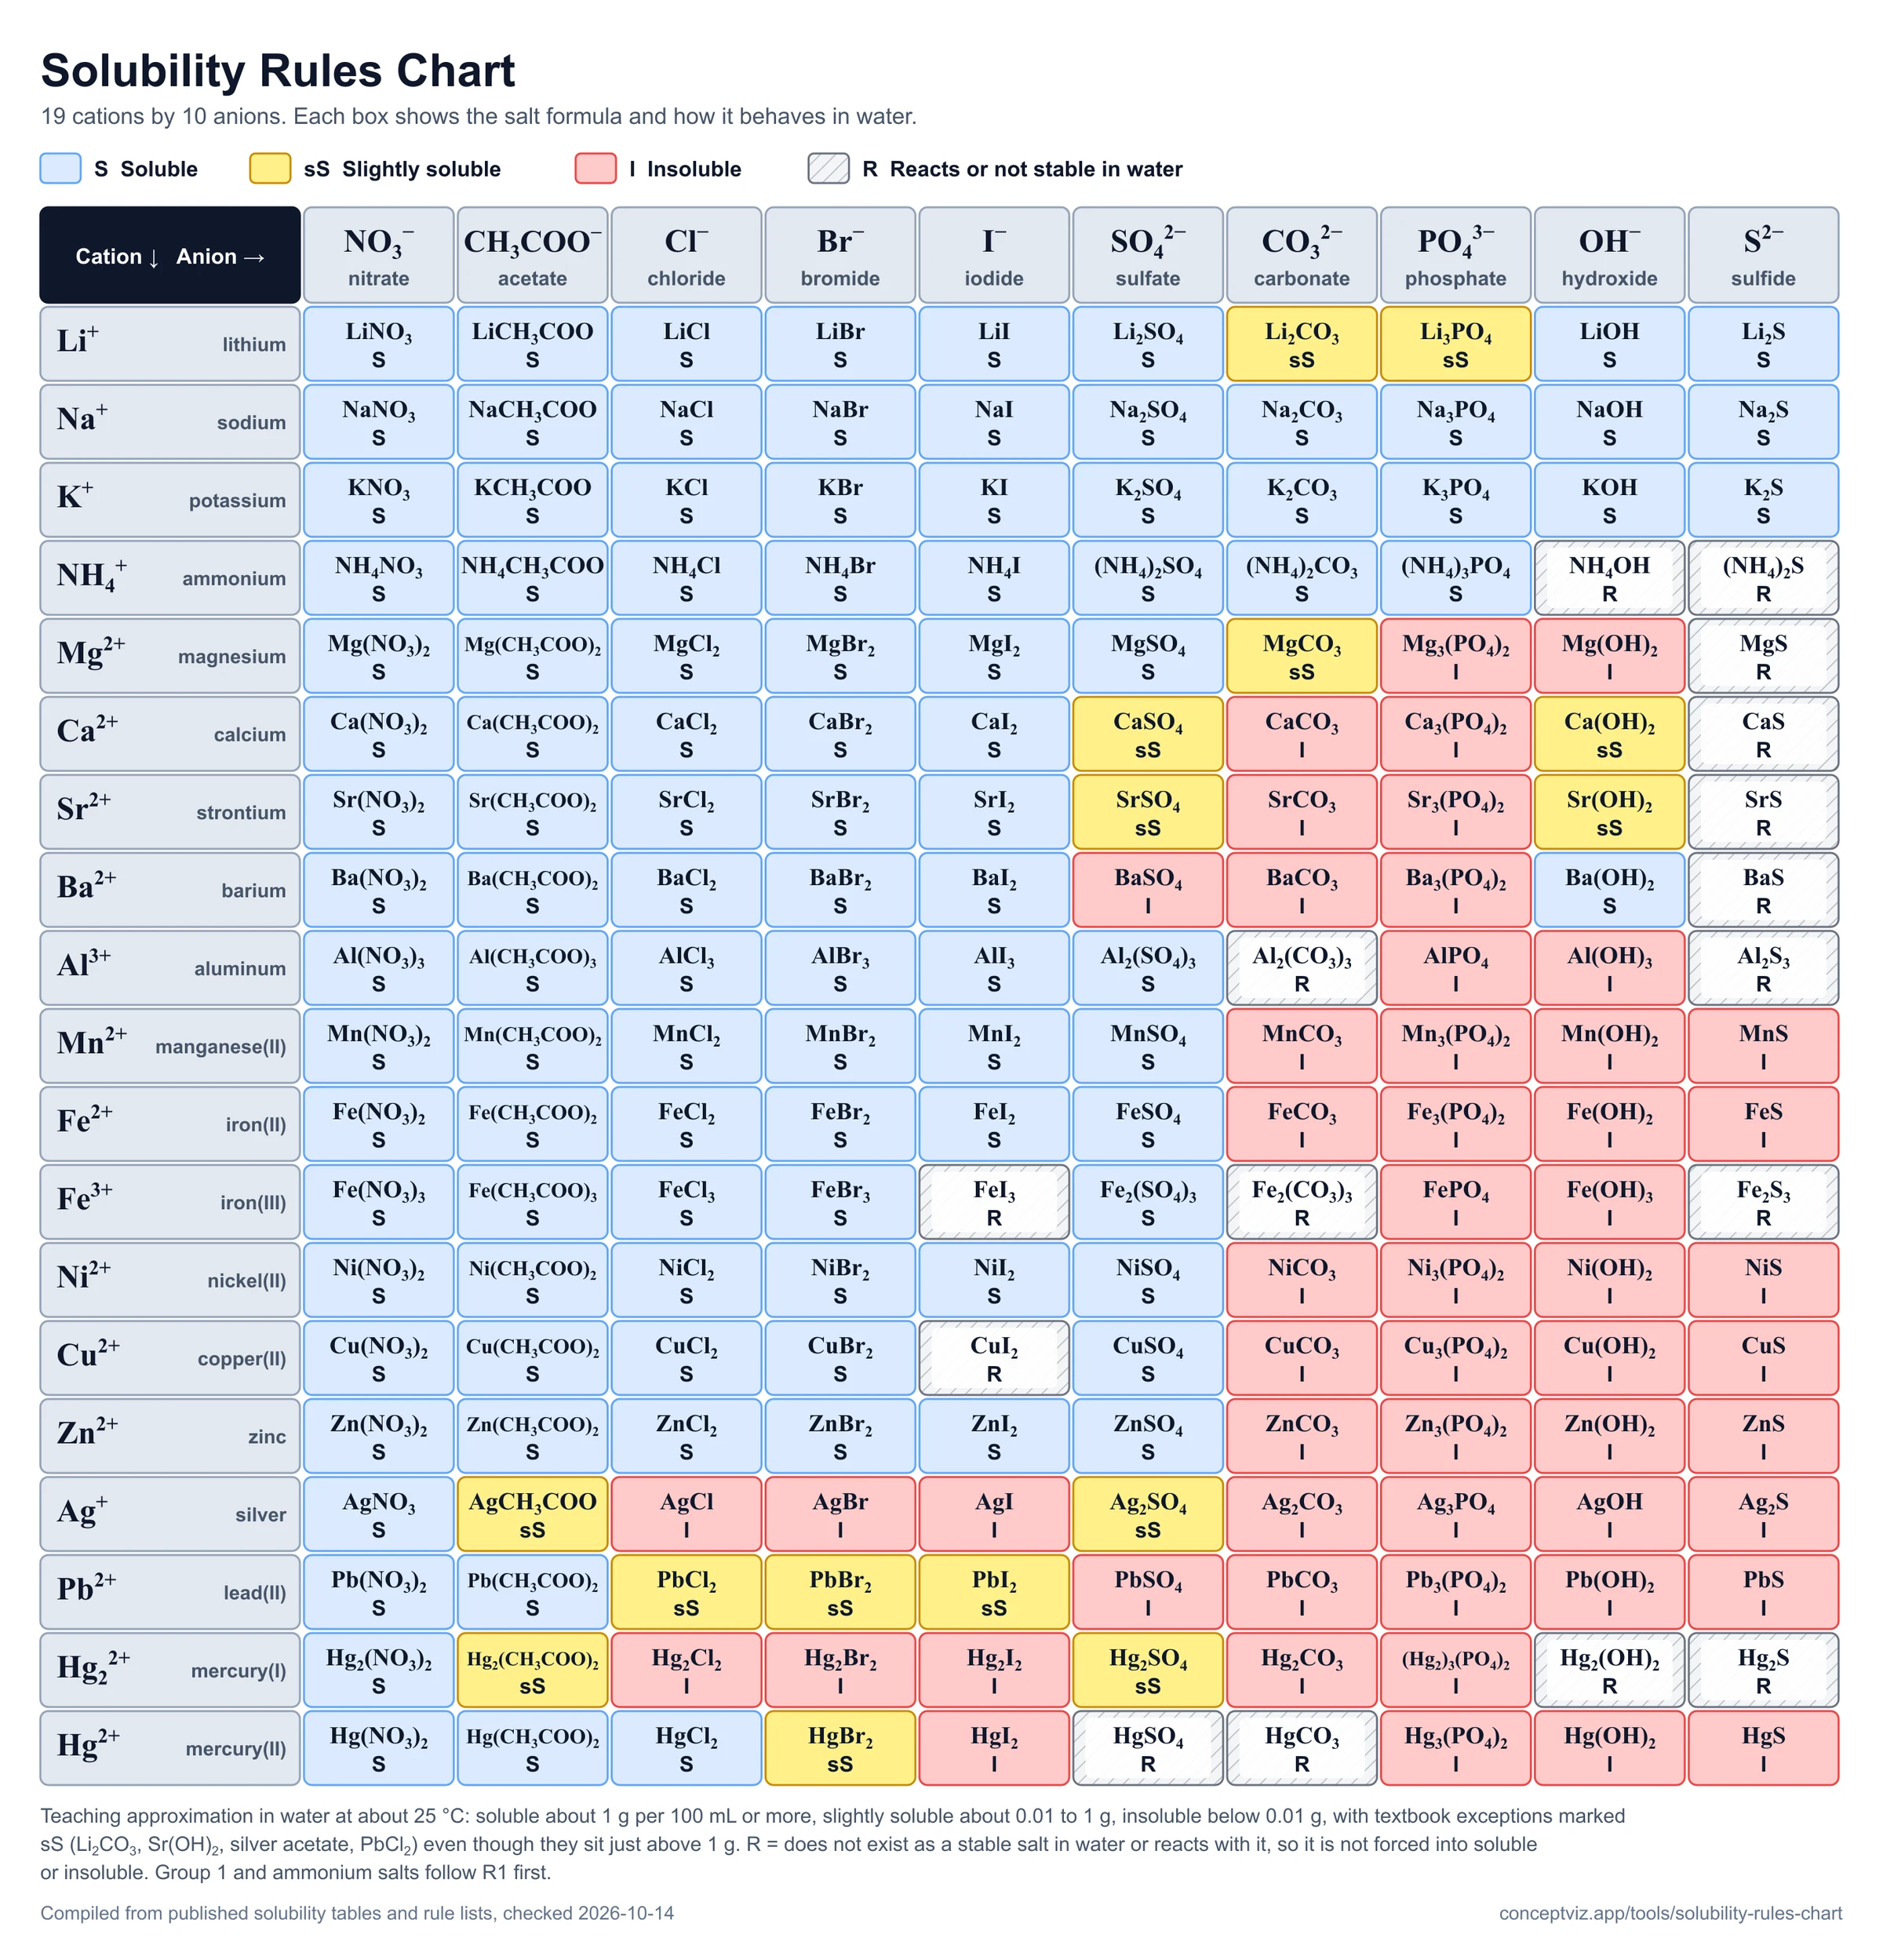
Solubility Rules Chart
Free solubility rules chart with 190 salts, 8 rules and a precipitate checker with net ionic equations. Print or download.