Lineweaver-Burk Plot Generator for enzyme kinetics
Free Lineweaver-Burk plot generator. Paste [S] and velocity to draw a double-reciprocal plot, read Km and Vmax, and download SVG.
Paste [S] and velocity — renders an exact double-reciprocal or MM plot as SVG, free
Data table
Paste substrate [S] and velocity v. An optional series column colors inhibitors. The tool does not run an enzyme assay.
9 points parsed
no inhibitor: Km=2.069, Vmax=10.165, R²=1.000. Fit is ordinary least squares on 1/v vs 1/[S], not a nonlinear MM fit.
Lineweaver-Burk Plot Generator
Free to try ·
Your AI Lineweaver–Burk illustration will appear here
For a data-accurate plot from [S] and v, use the Precise Plot tab instead
Lineweaver–Burk Plot Examples
The first four are exact engine renders from tables. The last two are AI illustrations of Illustration mode.
Uninhibited double-reciprocal
Exact engine render — paste [S] and v, ordinary least squares on the reciprocals.
Competitive inhibition
Exact engine render — same Vmax, larger Km with inhibitor.
Noncompetitive inhibition
Exact engine render — same Km, smaller Vmax with inhibitor.
Michaelis–Menten view
Exact engine render — same table in v vs [S] space. Km and Vmax still come from the Lineweaver–Burk fit.
AI illustration — Lineweaver–Burk
AI illustration of Illustration mode — visual mockup, not plotted from rates.
AI illustration — Michaelis–Menten
AI illustration of Illustration mode — visual mockup, not a fitted assay curve.
What is a Lineweaver–Burk plot?
A Lineweaver–Burk plot (double-reciprocal plot) graphs 1/v against 1/[S] for Michaelis–Menten enzyme kinetics. The y-intercept is 1/Vmax and the x-intercept is −1/Km, so a straight-line fit is a classroom and paper way to read those constants. This page draws that figure from the table you paste. It does not run an enzyme assay, estimate errors with nonlinear least squares, or replace GraphPad / Origin. Switch Plot type to Michaelis–Menten to see the same points as v versus [S] with a hyperbola from the Lineweaver–Burk Km and Vmax.
How Km and Vmax are read
- Paste substrate concentration [S] and initial velocity v. The tool takes reciprocals, fits ordinary least squares, then sets Vmax = 1 / intercept and Km = slope × Vmax.
- Competitive inhibition: lines share the 1/Vmax intercept; the inhibitor raises Km. Noncompetitive inhibition: lines share −1/Km; the inhibitor lowers Vmax.
- Lineweaver–Burk overweights low-velocity points because 1/v blows up when v is small. Treat the printed Km and Vmax as a teaching fit, not a publication-grade nonlinear estimate.
- Zero or negative [S] or v cannot be reciprocated and are skipped. Already-reciprocal columns named 1/[S] / invS and 1/v / invV are inverted back to [S] and v first.
Lineweaver–Burk versus Michaelis–Menten
The Michaelis–Menten plot is the hyperbolic v vs [S] curve. Lineweaver–Burk is its linearization. They are the same kinetic model, not two different enzymes. This generator defaults to Lineweaver–Burk because that is the searched figure; the MM view is the second mode. Eadie–Hofstee and Hanes–Woolf are different linearizations and are not drawn here.
Export
Download a scalable SVG with no watermark and no account required for the precise plot. The AI Illustration tab is only for slides when you do not have rates yet — it will not match your Km or Vmax.
Frequently Asked Questions
Related Research Tools
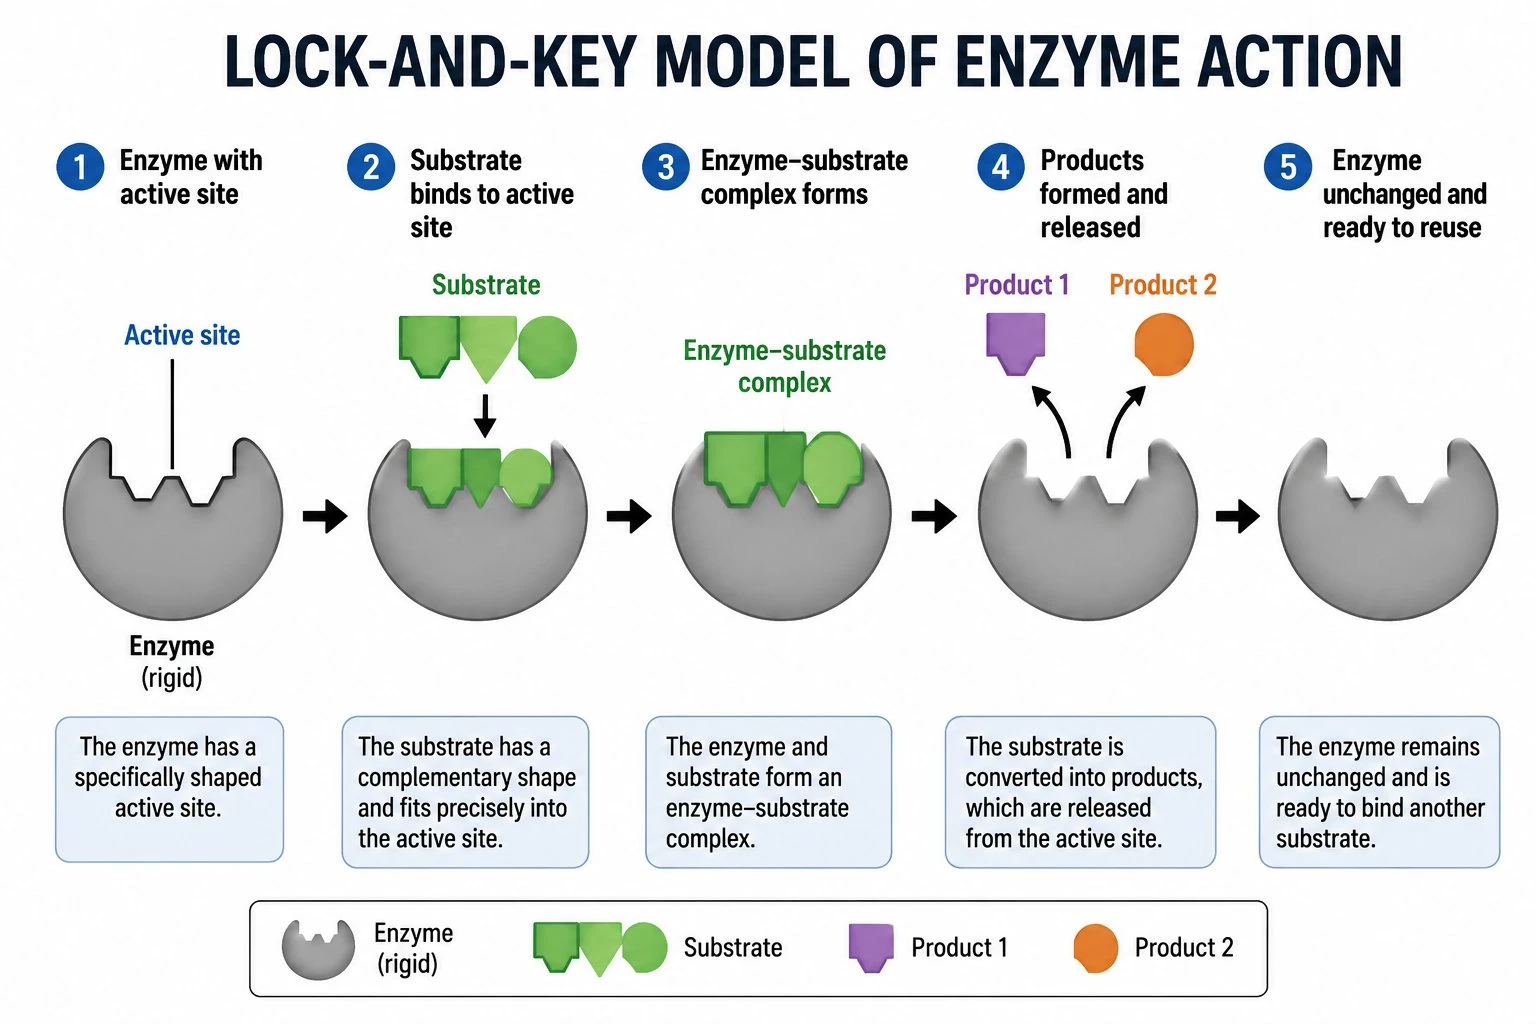 Biology
Enzyme Diagram Generator
Need lock-and-key or induced-fit cartoons instead of a kinetics plot? Use the enzyme diagram page.
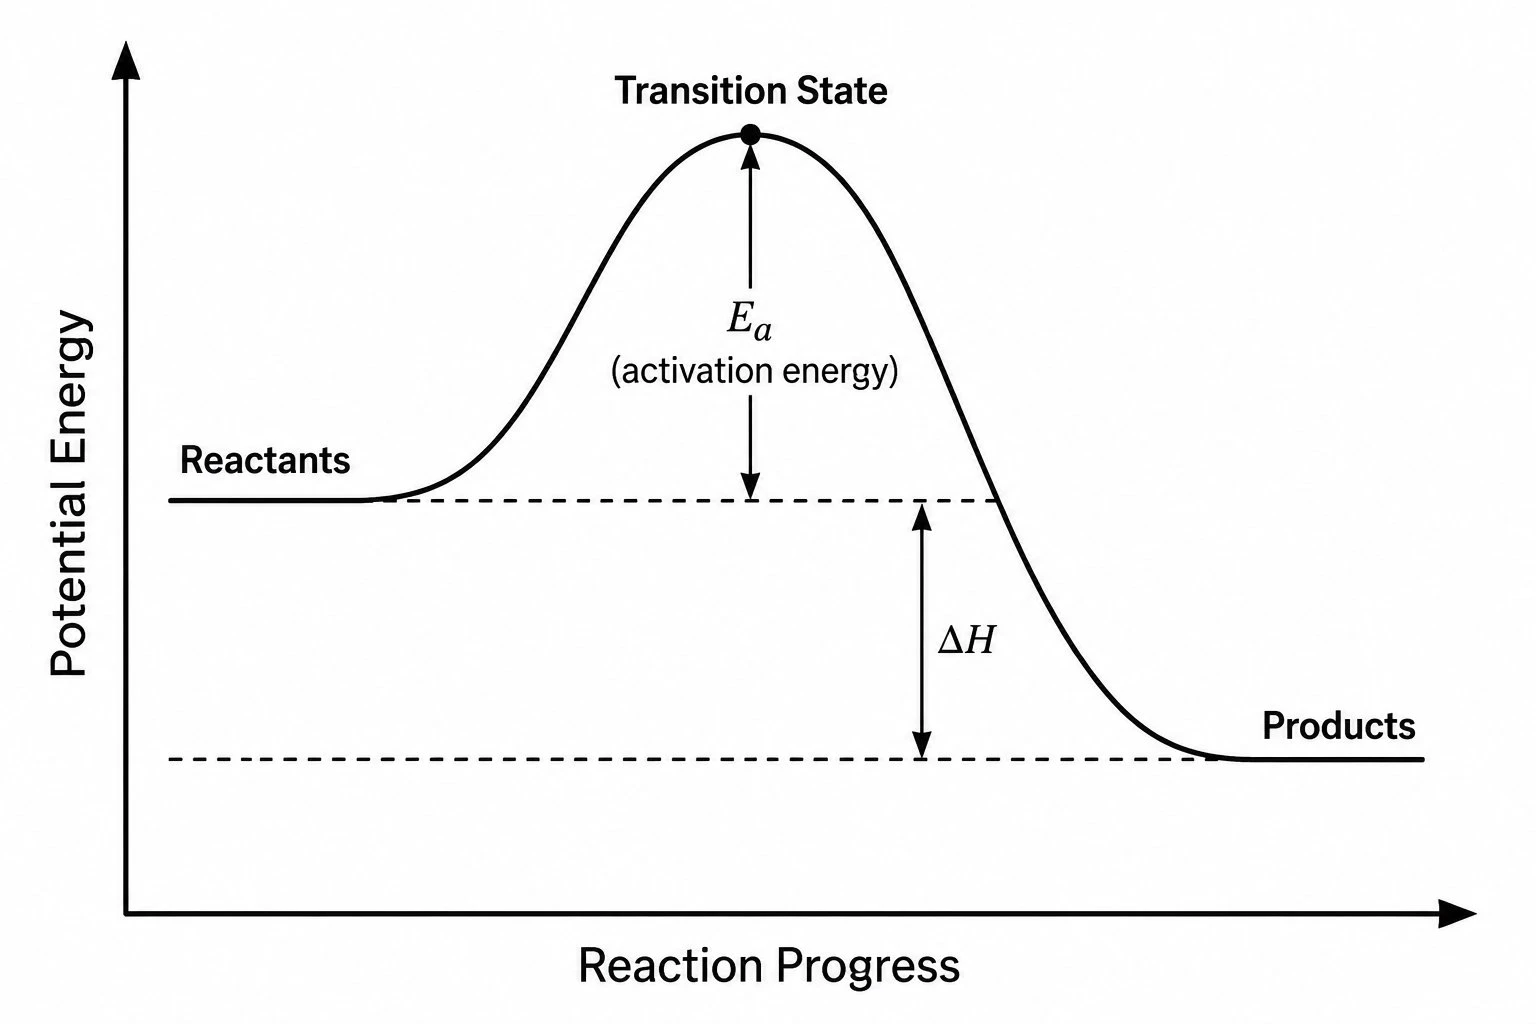 Chemistry
Reaction Coordinate Diagram
Draw a labeled energy profile with Ea and ΔH for a chemical or enzyme-catalyzed step.
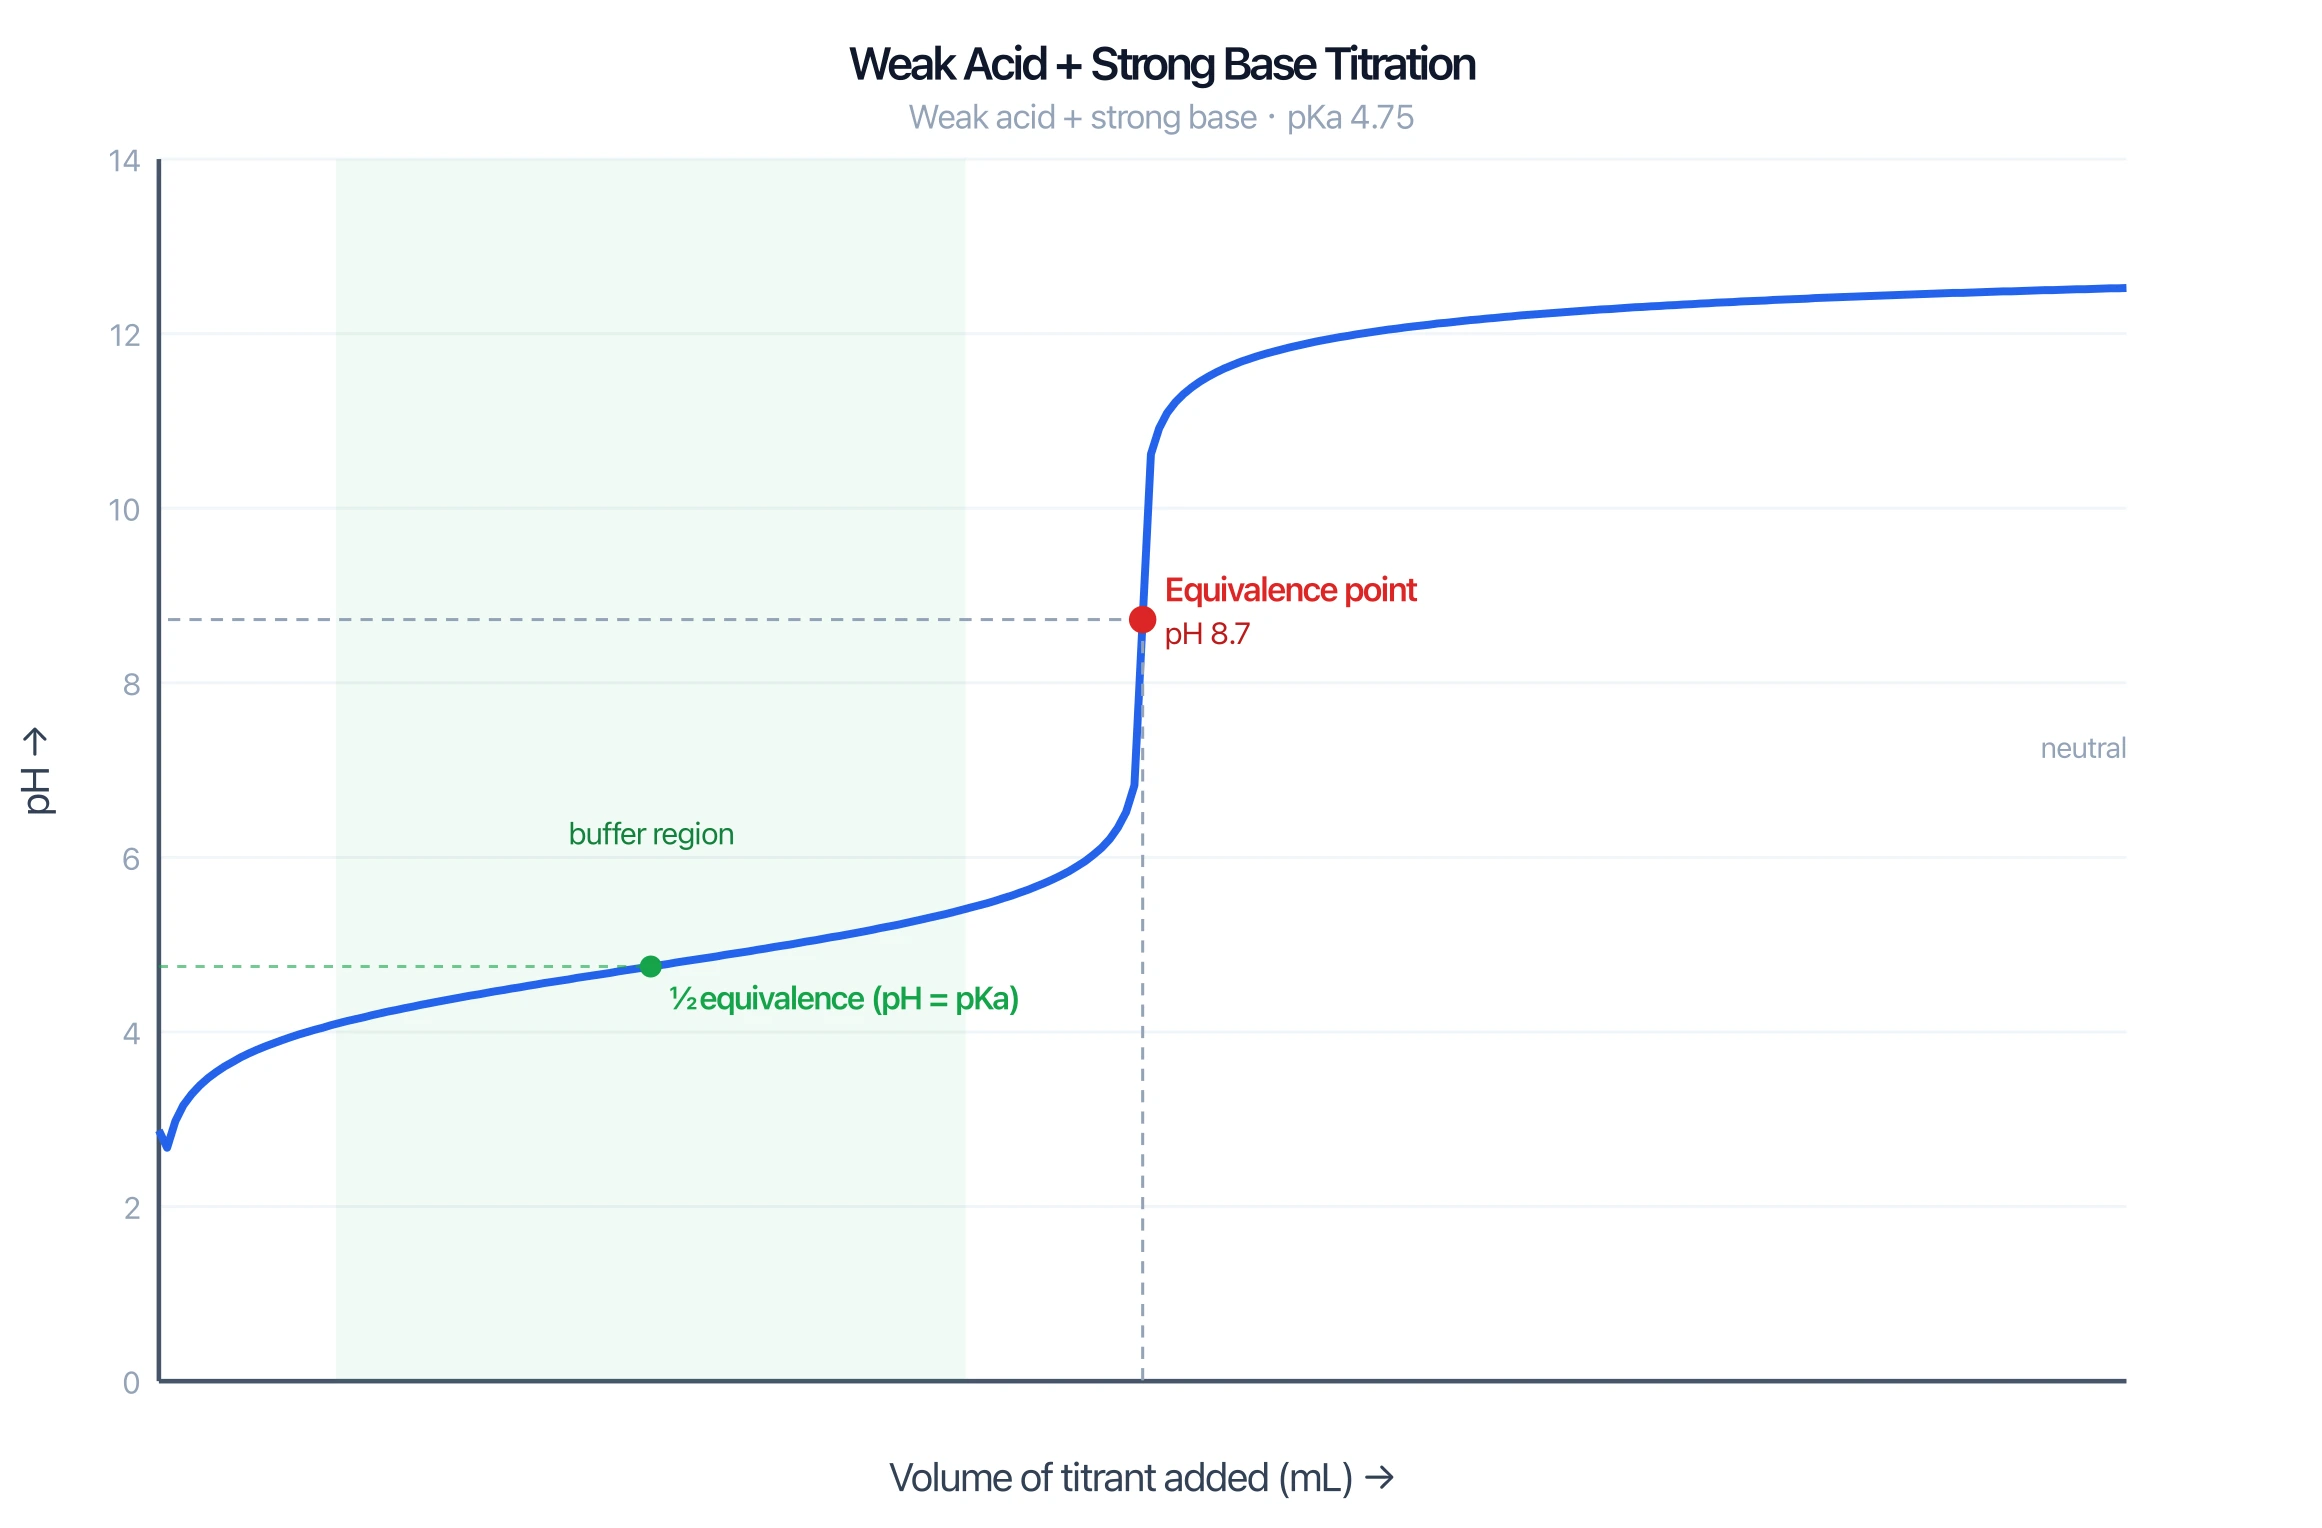 Chemistry
Titration Curve Generator
Plot a titration curve from acid–base data — a different chemistry figure, not enzyme kinetics.
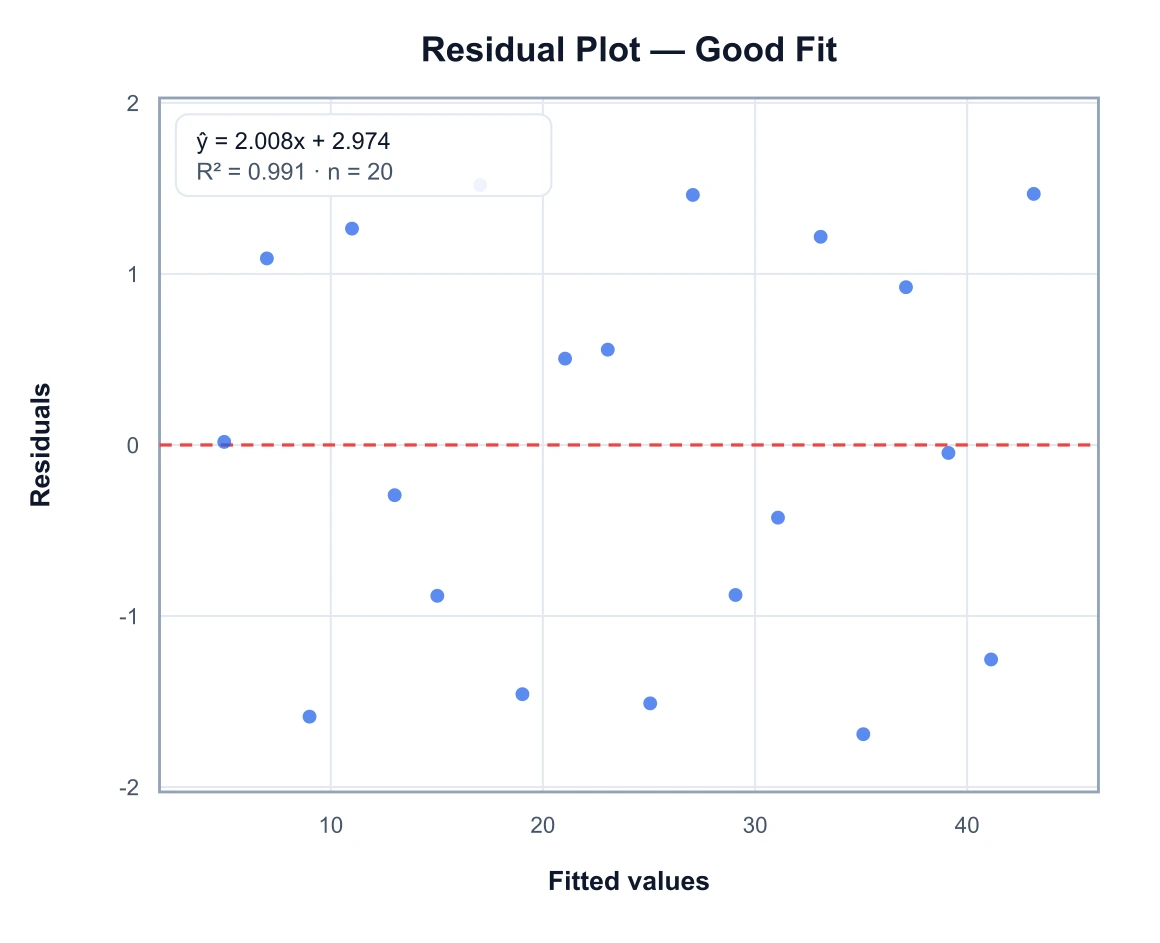 Research
Residual Plot Generator
Check a linear fit with residuals versus fitted values — useful after a Lineweaver–Burk regression.