
Signal Transduction Pathway Diagram: A Complete Guide for Biology Students and Researchers
Learn how to create signal transduction pathway diagrams for research papers and presentations. Covers GPCR, RTK, MAPK, and Wnt pathways with tools, symbols, and step-by-step guidance.
Signal transduction pathway diagrams are among the most complex and information-dense figures in cell biology. A single diagram must convey receptor activation, protein modification cascades, second messenger generation, and gene expression outcomes — all within a readable space, often a single column of a journal article.
Whether you are drawing a signaling pathway for the first time (for a thesis chapter or a poster), or you need to create a publication-ready figure for a cell biology paper, this guide covers the standard conventions, best tools, and most common mistakes in signal transduction pathway visualization.
Science Drawing Generator
Create professional biological pathway illustrations and cell biology figures with AI for research papers and presentations.
Try it free →What Is Signal Transduction?
Signal transduction is the process by which a cell converts an external signal — a hormone, growth factor, neurotransmitter, or environmental cue — into an intracellular response that changes cell behavior. The process has three core stages:
1. Reception — A signaling molecule (ligand) binds to a specific receptor protein. Receptors may be membrane-bound (G protein-coupled receptors, receptor tyrosine kinases) or intracellular (nuclear receptors for steroid hormones).
2. Transduction — The binding event triggers a relay of intracellular signaling molecules — a "cascade." Each step amplifies or filters the signal. Key mechanisms include protein phosphorylation (addition of phosphate groups by kinases), second messenger generation (cAMP, IP₃, Ca²⁺), and protein complex assembly.
3. Response — The cascade ultimately changes cellular behavior: gene transcription, enzyme activity, cytoskeletal rearrangement, ion channel opening, or cell division.
A signal transduction pathway diagram must capture all three stages while remaining legible. This is the central challenge: biological reality is a highly interconnected network, but a diagram must present a linear or hierarchical slice of that network that a reader can follow.
Major Signal Transduction Pathway Types
Understanding the type of pathway you are diagramming determines which visual conventions apply.
G Protein-Coupled Receptor (GPCR) Pathways
GPCRs are the largest family of membrane receptors in mammals. Upon ligand binding, the receptor activates a heterotrimeric G protein (Gα, Gβ, Gγ), which in turn activates or inhibits effector enzymes (adenylyl cyclase, phospholipase C). Second messengers (cAMP, DAG, IP₃) propagate the signal to downstream effectors including protein kinase A (PKA) and protein kinase C (PKC).
Key elements to include in a GPCR pathway diagram:
- The cell membrane (showing the receptor spanning the bilayer)
- The extracellular ligand
- The receptor in inactive and active conformations (or just active)
- The G protein complex and its subunit dissociation
- Second messenger production
- Downstream kinase activation
- Nuclear effects (gene transcription)
Receptor Tyrosine Kinase (RTK) Pathways
RTKs (EGFR, PDGFR, VEGFR, insulin receptor) dimerize upon ligand binding and autophosphorylate their intracellular kinase domains. This creates phosphotyrosine docking sites for adapter proteins (Grb2, SH2-domain proteins) that link the receptor to downstream cascades.
Key downstream pathways from RTKs:
- MAPK/ERK pathway: Ras → Raf → MEK → ERK → transcription factors
- PI3K/AKT pathway: PI3K → PIP₃ → PDK1 → AKT → mTOR
- JAK-STAT pathway: often activated by cytokine receptors; JAK kinases phosphorylate STAT proteins that dimerize and enter the nucleus
Wnt/β-Catenin Pathway
The Wnt pathway controls cell fate, proliferation, and embryonic development. In the absence of Wnt, β-catenin is continuously phosphorylated by a destruction complex (APC, Axin, GSK-3β, CK1) and degraded by the proteasome. When Wnt binds Frizzled receptors, the destruction complex is inhibited, β-catenin accumulates in the cytoplasm, translocates to the nucleus, and activates target gene transcription.
The Wnt pathway diagram is notable for requiring both an "Wnt OFF" state and a "Wnt ON" state to be shown — often in side-by-side panels.
Apoptosis Signaling Pathways
Apoptosis pathways (intrinsic mitochondrial pathway and extrinsic death receptor pathway) are among the most commonly diagrammed cascades in cancer biology. They require representation of:
- Caspase activation cascades (procaspases → caspases)
- Bcl-2 family protein interactions (pro- and anti-apoptotic members)
- Cytochrome c release from mitochondria
- APAF-1 apoptosome formation
Standard Symbols and Conventions
Unlike neural network diagrams or flowcharts, signal transduction pathway diagrams have relatively less standardized visual conventions — which is both a flexibility and a source of inconsistency across the literature. However, several practices are widely adopted:
Arrow Types
| Arrow Type | Meaning |
|---|---|
| → (solid, filled arrowhead) | Activation or stimulation |
| ⊣ (flat-headed, inhibition line) | Inhibition or blocking |
| ⤍ (curved arrow) | Translocation (protein moving from one compartment to another) |
| →→ (double arrow) | Enzymatic reaction or conversion |
| ---→ (dashed arrow) | Indirect effect or multi-step process not shown |
Use inhibition arrows consistently — a common mistake is using a flat-headed arrow in some places and a regular arrow with a minus sign in others. Pick one convention and apply it throughout.
Protein Representation
- Proteins are typically shown as labeled ovals or rounded rectangles
- Phosphorylated proteins are marked with a circled P symbol (⊕ or a filled circle labeled "P")
- Active vs. inactive states can be distinguished by color, label (e.g., "p-ERK" for phospho-ERK), or a conformational change indicator
- Protein complexes are shown as overlapping or adjacent shapes with a connecting bracket or outline
Compartment Boundaries
The cell membrane, nuclear membrane, and organelle membranes must be clearly shown if the pathway crosses compartments. Use a thick horizontal line for the plasma membrane with the receptor spanning it. Show the nucleus as a rounded rectangle at the bottom of the diagram with a clear boundary.
A diagram that does not show subcellular compartments fails to communicate where in the cell each event occurs — which is often biologically critical information.
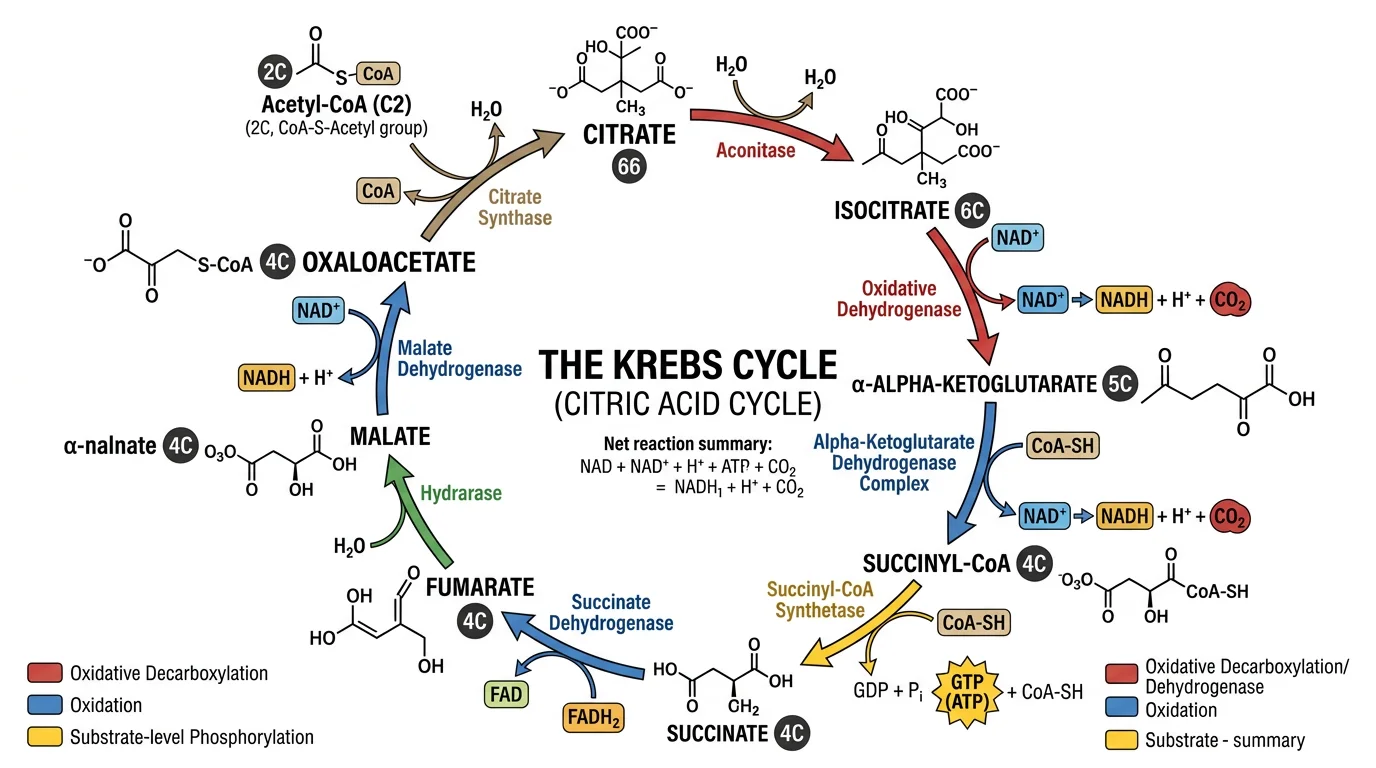
The Krebs cycle diagram illustrates how complex biochemical pathways are visualized as cyclic connected sequences with labeled intermediates, enzymes, and cofactors — a model for designing signal transduction pathway figures.
Step-by-Step: How to Draw a Signal Transduction Pathway Diagram
Step 1: Define the scope
Signal transduction pathways are biologically interconnected with dozens of other pathways. Define your diagram's scope precisely:
- What is the triggering signal?
- What is the terminal cellular response?
- Which branch of the pathway are you showing?
- Are you showing the canonical pathway only, or including crosstalk?
For a journal figure, limit the diagram to the specific pathway relevant to your paper's results. Showing an entire signaling network obscures the specific regulatory steps your research addresses.
Step 2: List all components
Write out a complete list of:
- All protein participants (with correct names and, where relevant, gene names vs. protein names)
- All post-translational modifications shown (phosphorylation sites, ubiquitination, etc.)
- All second messengers
- All subcellular compartments that appear
- All regulatory nodes (feedback loops, crosstalk points)
Cross-reference against databases like Cell Signaling Technology's pathway diagrams and Biology LibreTexts to ensure nomenclature accuracy.
Step 3: Choose the layout strategy
Linear cascade: Works when the pathway flows from receptor to nucleus with minimal branching. Arrange components top to bottom or left to right. Use cell membrane as a horizontal divider.
Branching cascade: Use when the pathway diverges at a branch point into two or more parallel responses. Draw the branch point centrally and fan the two arms to the sides.
Dual state panels: Use for pathways like Wnt where you need to show the OFF state and ON state. Draw two parallel diagrams side by side with a clear label separating them.
Network diagram: For highly interconnected pathways (like the PI3K/AKT/mTOR network), a node-and-edge network layout can show multiple connections simultaneously — but requires careful visual organization to avoid visual clutter.
Step 4: Choose your tool
| Tool | Best for | Cost |
|---|---|---|
| BioRender | Life science diagrams with curated protein icons library | Free (limited), paid from $9.99/mo |
| Inkscape | Custom fully-editable vector diagrams | Free |
| PathVisio | Formal pathway diagrams with GPML export | Free |
| Adobe Illustrator | Professional publication-ready figures | ~$21/mo |
| PowerPoint | Internal presentations, not for paper figures | Paid |
| Cell Signaling Technology | Reference diagrams to adapt from | Free (view only) |
| ConceptViz Science Drawing Generator | AI-generated biological illustrations from text | Free tier |
According to a ResearchGate discussion on free software for signaling pathways, BioRender and Inkscape are the most commonly recommended tools in the academic community for pathway illustrations.
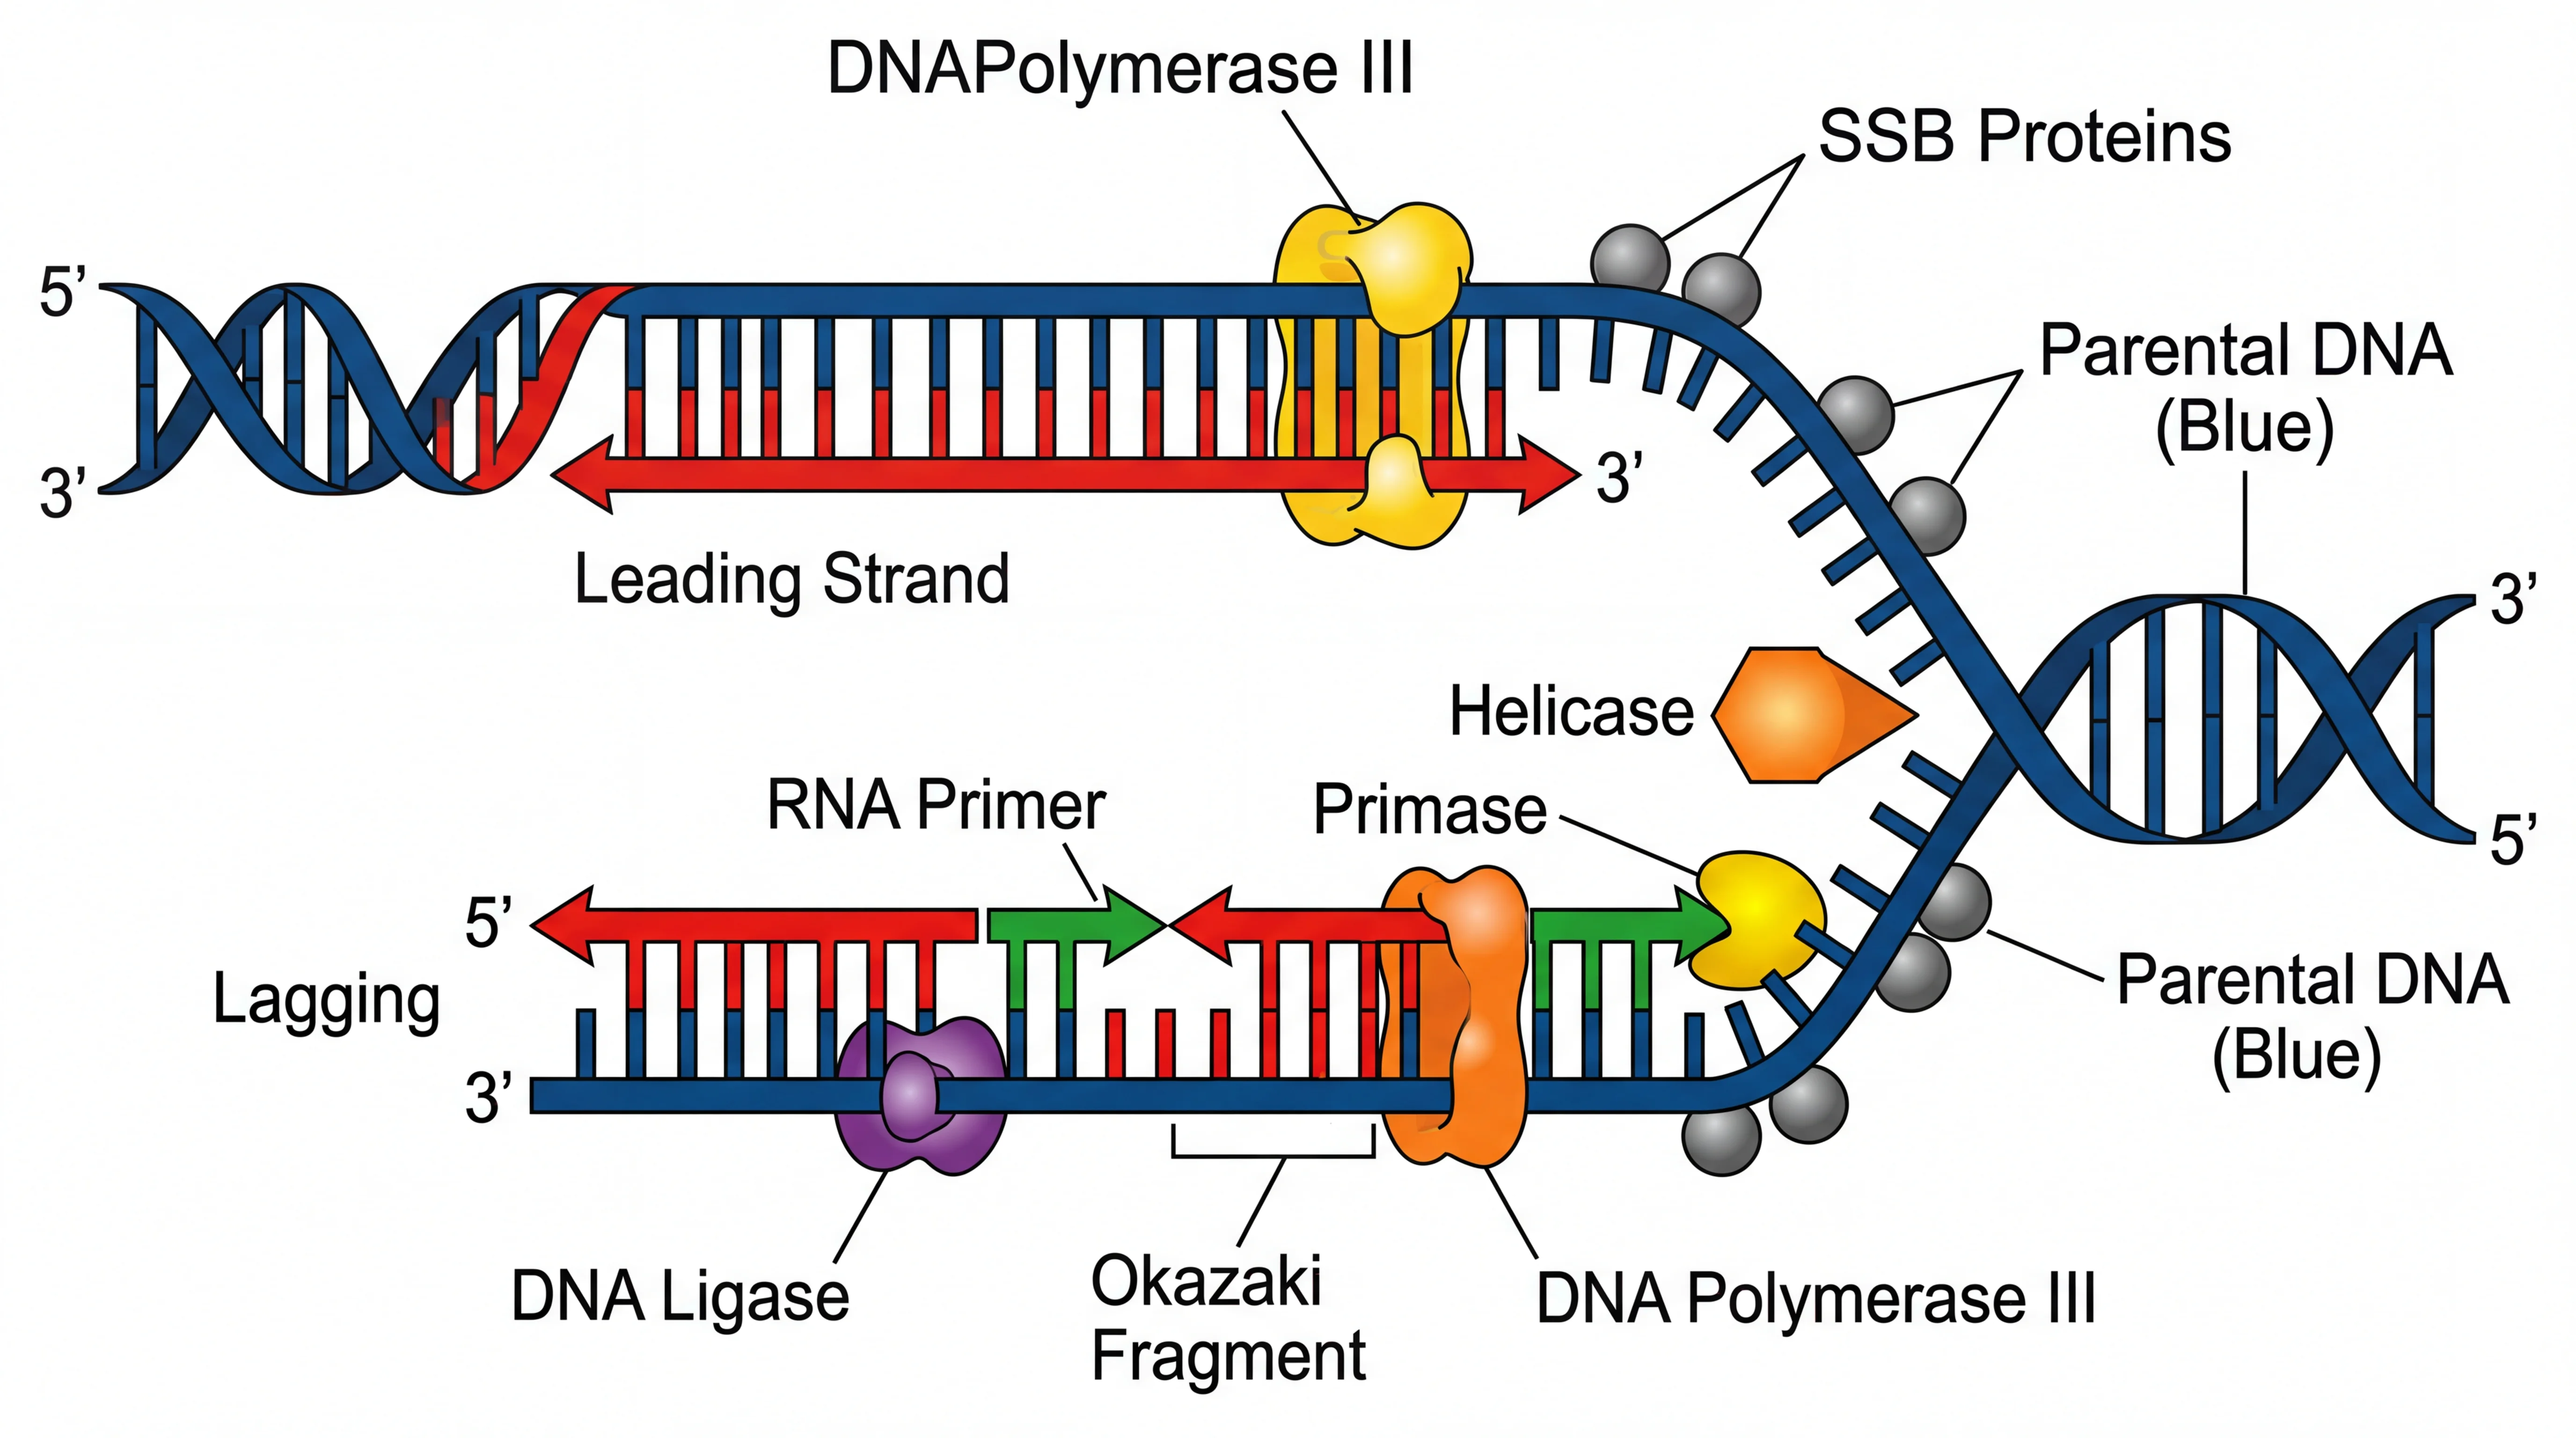
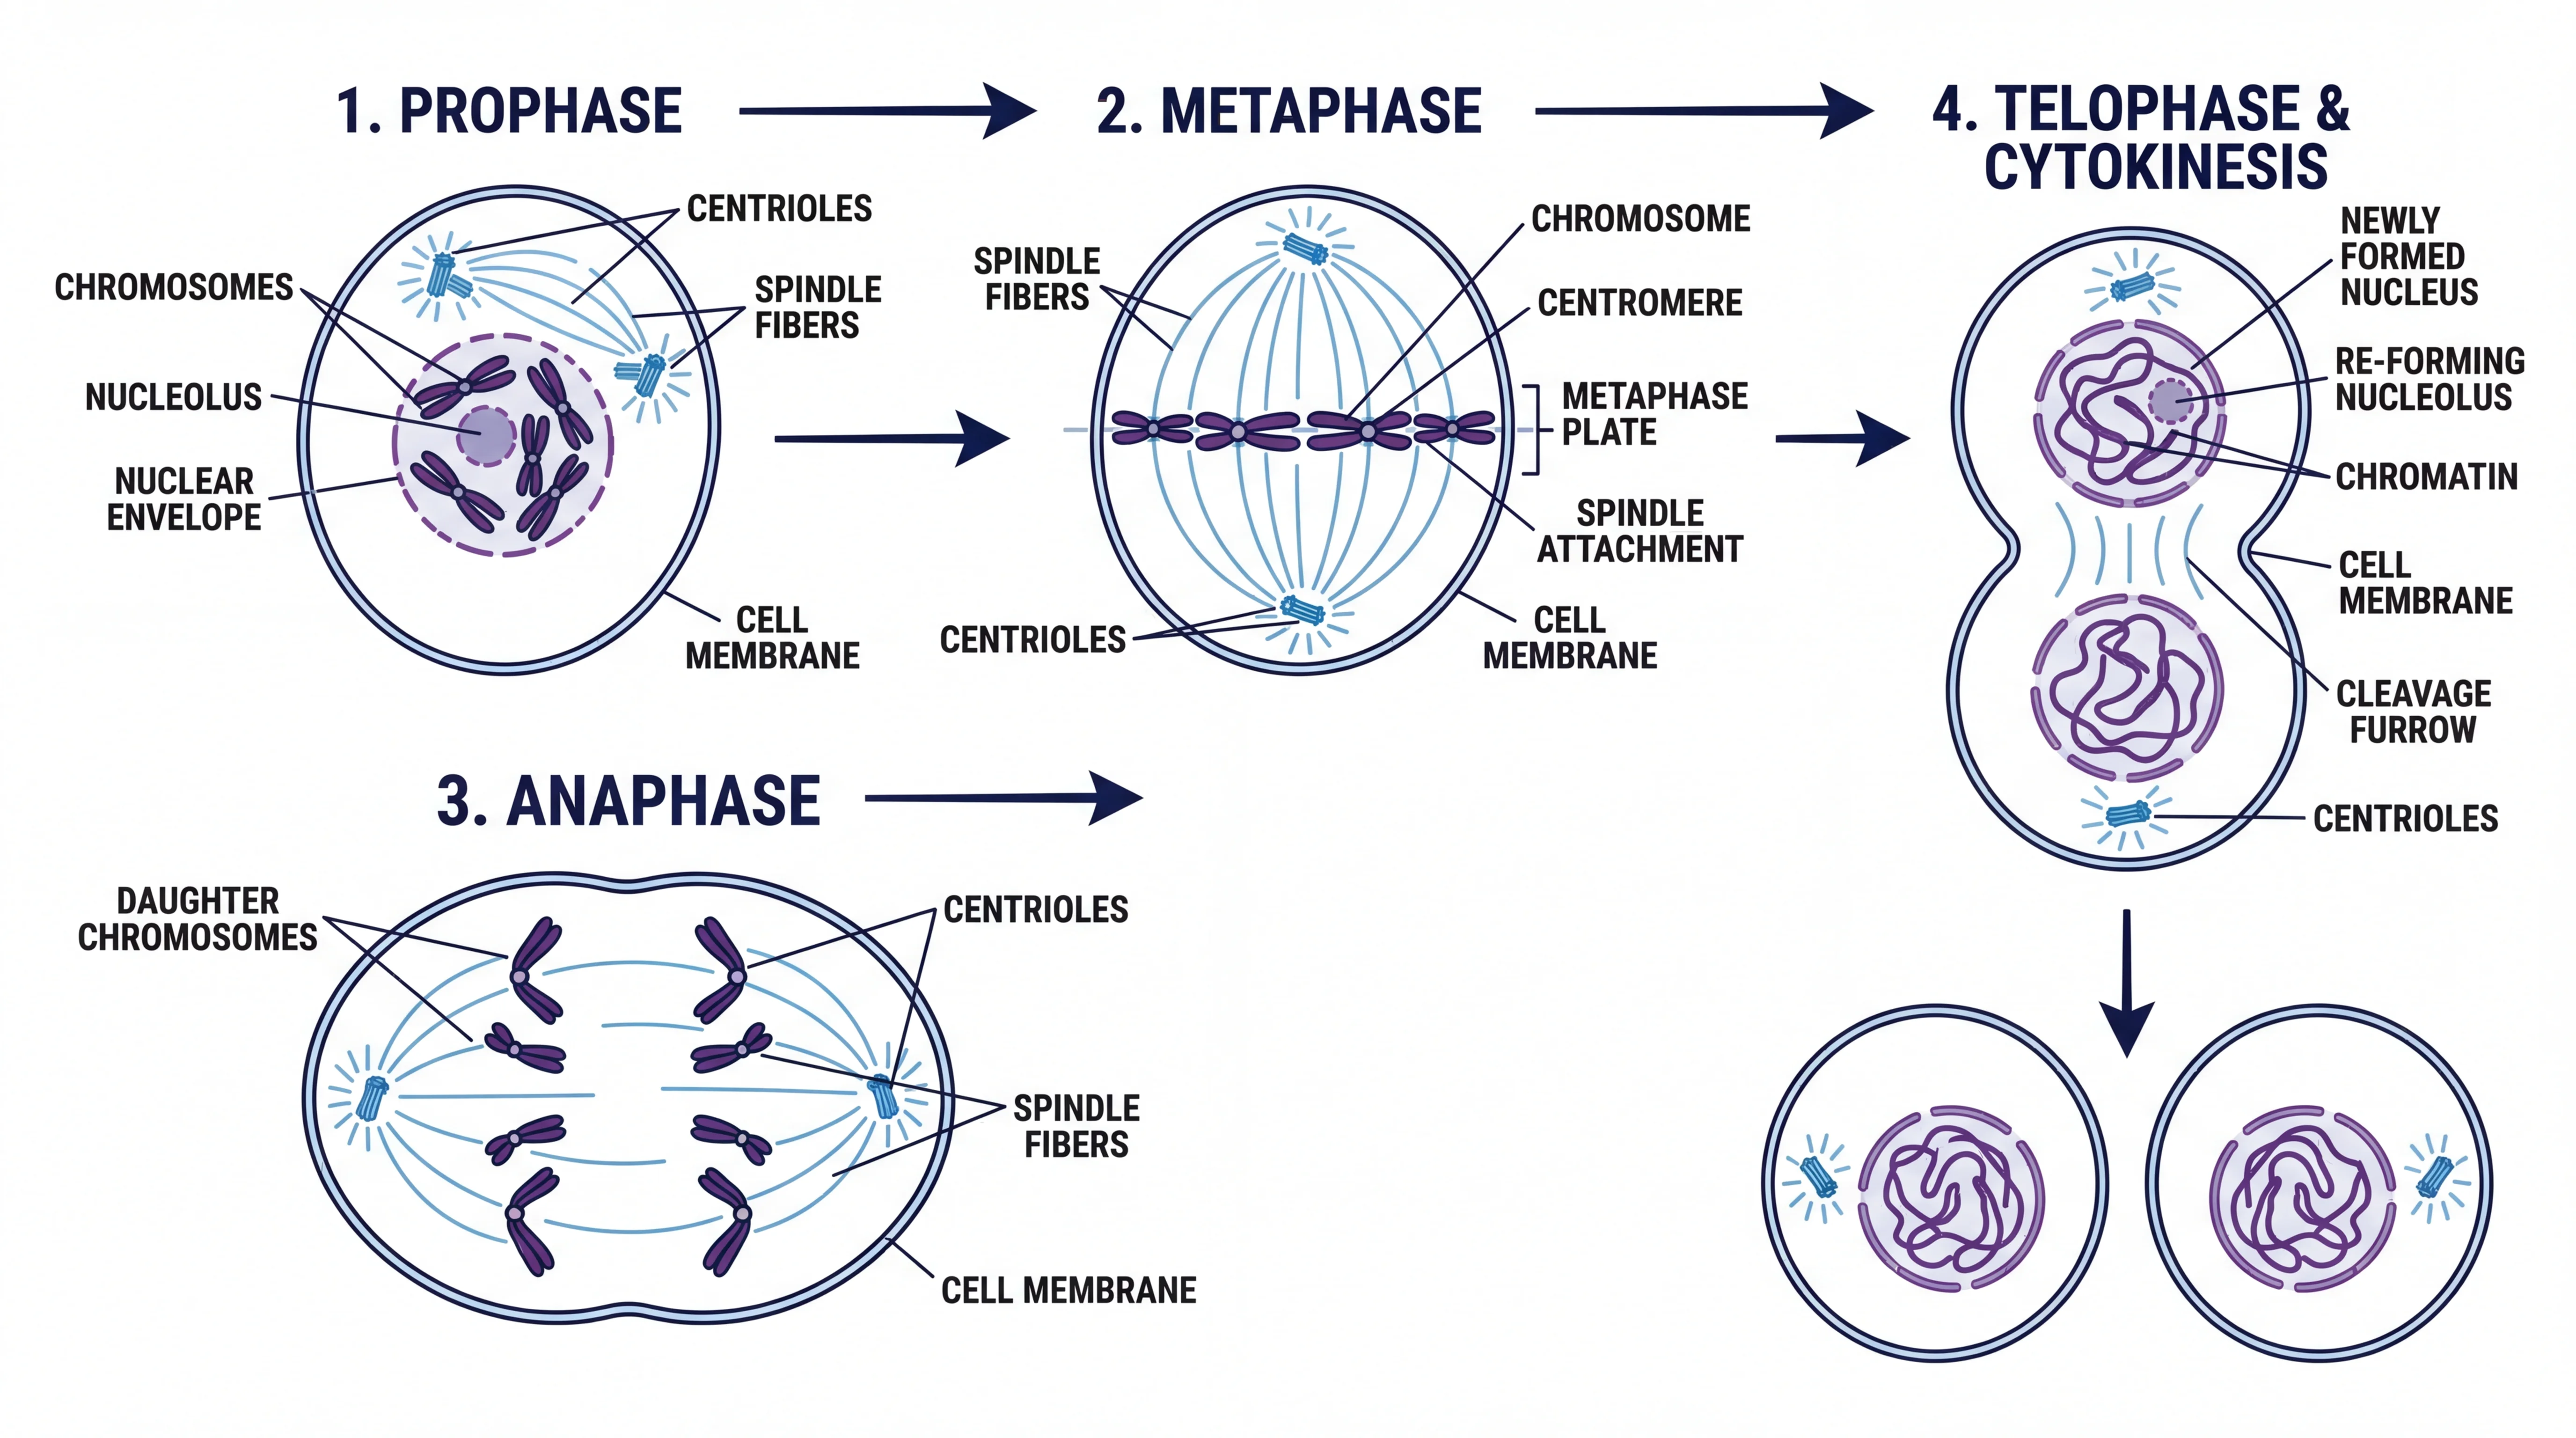
A biological process diagram for DNA replication demonstrates how molecular events are sequenced in cell biology illustrations — similar conventions apply to signal transduction cascade diagrams.
Step 5: Draw the cellular context first
Start with the cell membrane and any relevant compartment boundaries. This establishes the spatial framework into which you'll place all the molecular components.
- Draw the plasma membrane as a thick horizontal band across the diagram
- Place the receptor straddling the membrane with the ligand-binding domain extracellular and the signaling domain intracellular
- If showing nuclear events, draw the nuclear envelope at the bottom
- If showing mitochondrial events (e.g., apoptosis), add the mitochondrion as an oval to the side
Step 6: Place molecular components in order
Starting from the receptor, place each downstream component in spatial sequence — moving away from the membrane toward the nucleus or cytoplasm, following the signal flow direction.
Label every component with its standard name:
- Use the standard protein name, not the gene name (unless convention in your field is the opposite)
- Mark phosphorylation sites: "pSer473-AKT" or "AKT(S473-P)" depending on journal style
- Use the PhosphoSitePlus database for canonical phosphorylation site nomenclature
Step 7: Add arrows and connections
Connect each component with the appropriate arrow type (activation, inhibition, translocation). Key rules:
- Every arrow must have a clear source and a clear target
- Do not use arrows to imply effects across compartment boundaries without showing translocation
- For feedback loops, draw the feedback arrow explicitly (often a curved arrow going backward)
- For crosstalk with other pathways, use a dashed arrow entering from the edge of the diagram, labeled with the pathway name
Step 8: Color-code by function or compartment
A consistent color scheme dramatically improves readability in complex pathway diagrams:
- Color by compartment: all cytoplasmic components in one color, nuclear components in another, membrane components in a third
- Color by function: kinases in one color, phosphatases in another, transcription factors in a third
- Color to highlight: your paper's main target protein in a saturated color, context proteins in muted gray
For publication, always verify the color scheme is accessible to readers with color vision deficiencies using a colorblind simulator. The Okabe-Ito palette is a reliable starting point.
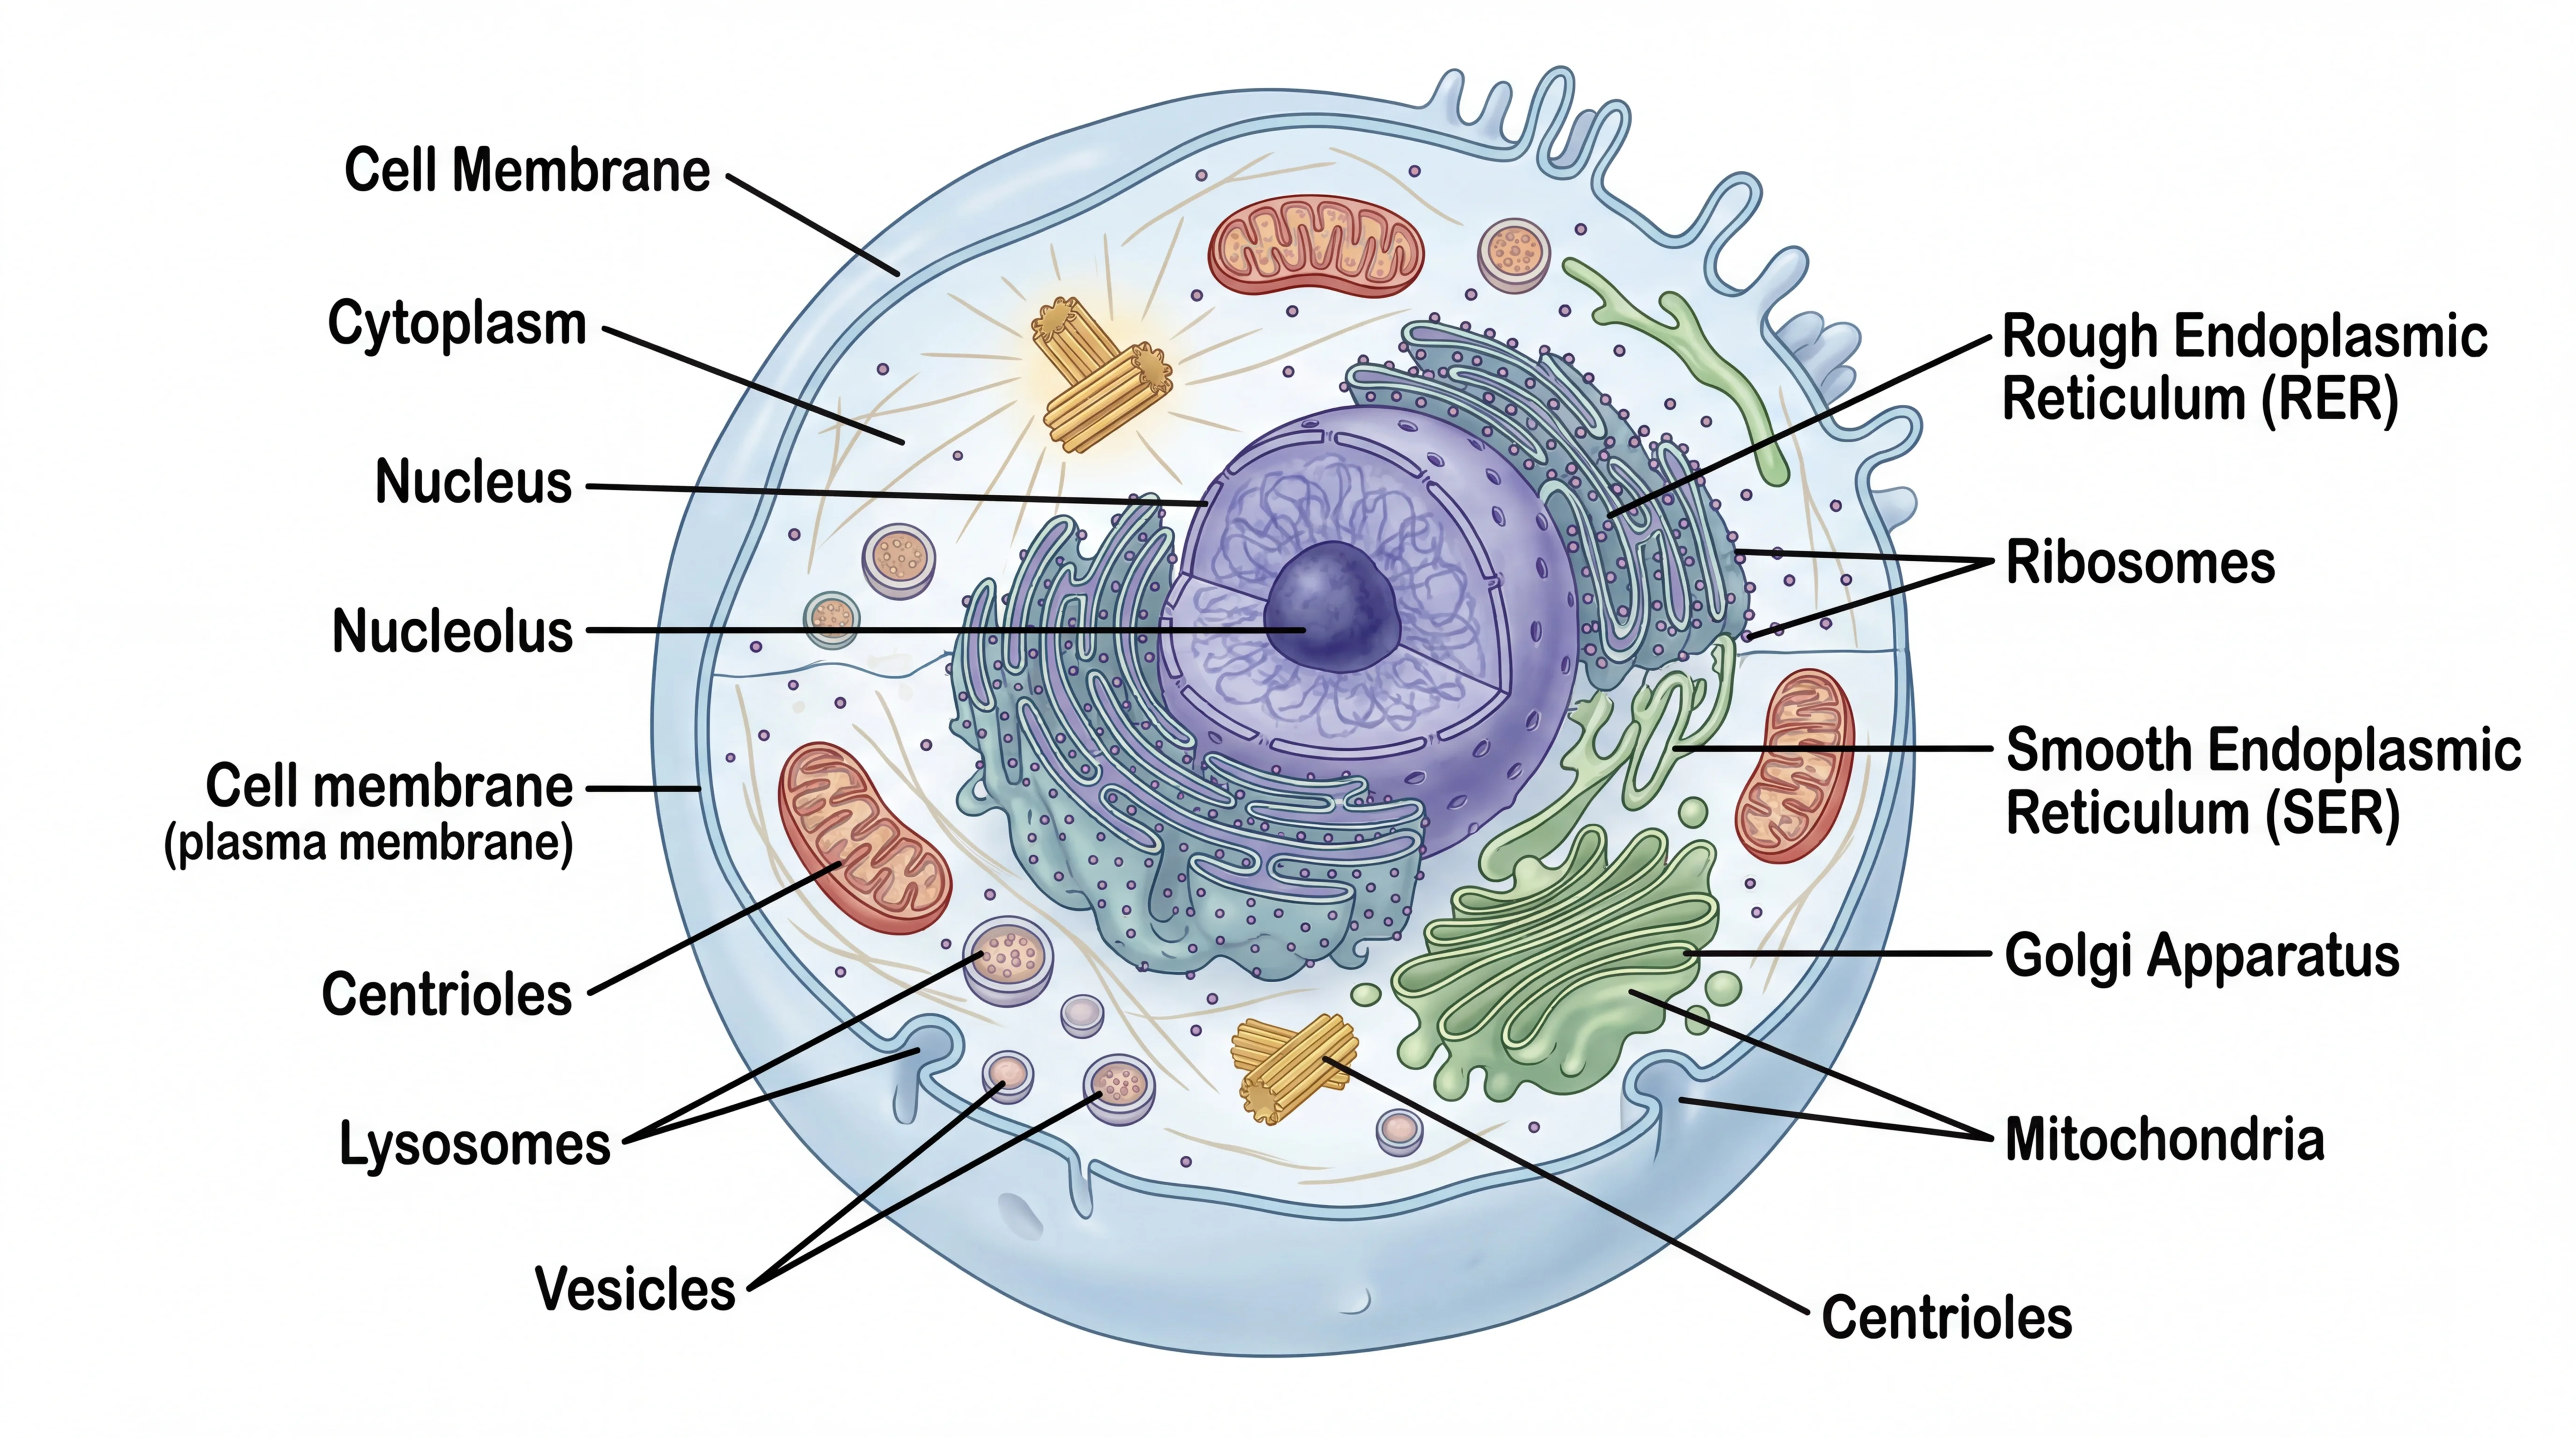
A cell structure diagram showing the spatial relationship between subcellular compartments — a necessary reference for placing pathway components in the correct cellular location in your signal transduction diagram.
Step 9: Validate with literature
Before finalizing your pathway diagram, verify every arrow against peer-reviewed sources:
- Check that activation relationships are correctly oriented (A activates B, not B activates A)
- Verify which protein is the kinase and which is the substrate
- Confirm that inhibitory relationships are not confused with competitive relationships
- Check that pathway steps shown are cell-type appropriate (the same signaling molecule may have different roles in different cell types)
The Cell Signaling Technology pathway library provides curated, expert-validated pathway diagrams covering EGFR, mTOR, PI3K/AKT, Wnt, Notch, JAK-STAT, and dozens of other pathways — an authoritative reference for checking your diagram.
Common Signal Transduction Diagram Mistakes
Showing arrows without established evidence Every arrow in a published pathway diagram should be supported by experimental evidence. Showing an activation arrow that has only been demonstrated in a different cell type or species without annotation misleads readers. Use dashed arrows or footnotes to flag relationships with limited or context-dependent evidence.
Missing compartment labels If a protein changes compartment during signaling (e.g., NF-κB nuclear translocation, β-catenin moving from cytoplasm to nucleus), the translocation step must be explicitly shown. A diagram that shows a protein in two locations without an arrow connecting them is incomplete.
Using gene names and protein names inconsistently Referring to the same protein as "p38" in one place and "MAPK14" in another within the same diagram is confusing. Choose one naming convention (typically the protein name, as listed in UniProt) and apply it throughout.
Crowding too many nodes The temptation to show every component of the pathway leads to diagrams with 30+ nodes that no reader can parse at a glance. Limit any single diagram to the 10–15 most important components. Use boxes labeled "multiple intermediates" or a dashed line to indicate that steps have been condensed.
Unlabeled crosstalk arrows If you show a dashed arrow from another pathway entering your main pathway, always label it with the source (e.g., "from PI3K/AKT pathway"). Unlabeled crosstalk arrows are meaningless to any reader unfamiliar with the biological context.
Tools for Reference Pathway Diagrams
Before drawing from scratch, check these curated pathway resources:
Cell Signaling Technology Pathway Diagrams — Free to view, extensively annotated pathway maps for the most commonly studied signaling cascades. Produced by CST's team of scientists and regularly updated. Useful for checking which proteins are in which pathway and how they connect.
KEGG Pathway — The KEGG pathway database contains machine-readable pathway maps for metabolism, genetic information processing, and signal transduction across hundreds of organisms. KEGG pathway maps can be downloaded and used as starting points for custom diagrams.
Reactome — A curated, peer-reviewed pathway knowledgebase with detailed molecular-level pathway representations. Reactome's pathway browser allows export of specific pathways as SVG files for further editing.
BioRender's biological pathway tips — practical guidance from BioRender's scientific illustration team on how to apply design principles to biological pathway figures.
Biology Drawing Generator
Create detailed biological illustrations for cell biology, genetics, and molecular biology research.
Schematic Diagram Maker
Generate scientific and technical schematic diagrams for research papers and lab protocols.
Related Reading
- Scientific Illustration: Complete Beginner's Guide — foundational guide to biological figure design
- How to Make Figures for Nature and Science Journals — journal-specific figure requirements
- Graphical Abstract Examples by Discipline — how to condense pathway research into a graphical abstract
- Okabe-Ito Palette Hex Codes — colorblind-safe palettes for biology figures
- Cell Signaling Technology Pathway Library — curated reference pathway diagrams (external)
- KEGG Pathway Database — downloadable reference pathway maps (external)
- Reactome Pathway Browser — peer-reviewed pathway knowledgebase with SVG export (external)
Frequently Asked Questions
What is a signal transduction pathway diagram?
A signal transduction pathway diagram is a visual representation of how a cell converts an external signal — such as a hormone, growth factor, or neurotransmitter — into an intracellular response. The diagram shows the sequence of molecular events (receptor activation, kinase cascades, second messenger generation, transcription factor activation) from the initial signal at the cell surface to the final cellular response, using standard symbols for proteins, activation arrows, and inhibition lines.
What are the main types of signal transduction pathways?
The major types include: GPCR (G protein-coupled receptor) pathways that generate second messengers like cAMP and DAG; RTK (receptor tyrosine kinase) pathways that activate MAPK/ERK, PI3K/AKT, and JAK-STAT cascades; the Wnt/β-catenin pathway controlling cell fate; the Notch pathway for cell-cell signaling; nuclear receptor pathways for steroid and thyroid hormones; and apoptosis signaling pathways (intrinsic and extrinsic). Each has distinct visual conventions for diagramming.
What software is best for drawing signal transduction pathway diagrams?
BioRender is the most popular tool among life scientists — it includes a curated library of protein icons, cell membrane components, and organelle shapes that can be assembled without drawing skill. Inkscape is the best free option for fully custom vector diagrams. PathVisio is a specialized free tool for GPML-formatted biological pathways with database integration. For quick AI-generated biological illustrations from text descriptions, ConceptViz's Science Drawing Generator is a fast alternative that requires no manual drawing.
How do I show protein phosphorylation in a pathway diagram?
The standard convention is to label the phosphorylated protein with a circled 'P' symbol (⊕) attached to the protein shape, or to use the prefix 'p-' before the protein name (e.g., p-ERK, p-AKT). The specific phosphorylation site can be included in parentheses (e.g., AKT(Ser473)). The kinase performing the phosphorylation is shown with an activation arrow pointing to the substrate, sometimes with 'P' labeled on the arrow itself. Use the PhosphoSitePlus database to verify canonical phosphorylation site nomenclature.
What arrow types are used in signal transduction diagrams?
The main arrow types are: solid arrows with filled arrowheads for activation or stimulation; flat-headed lines (T-bars) for inhibition or blocking; curved arrows for molecular translocation between compartments; dashed arrows for indirect effects or multi-step processes not shown in detail; and double arrows for enzymatic reactions or molecular conversions. Apply these conventions consistently throughout a single diagram — mixing different inhibition symbols within one figure is a common source of confusion for readers.
How do I diagram crosstalk between signaling pathways?
Show crosstalk connections as dashed arrows entering or leaving your main pathway from the edge of the diagram. Always label the dashed arrow with the source or target pathway name (e.g., 'from Wnt pathway' or 'to mTOR pathway'). If the crosstalk is a major regulatory point in your paper, consider showing a partial representation of the crosstalk pathway entering the figure, rather than just a labeled arrow. Avoid showing too many crosstalk connections in one figure — limit to the 1–2 most biologically relevant for your research context.
Where can I find reference signal transduction pathway diagrams?
The best free resources for reference pathway diagrams are: Cell Signaling Technology's pathway library (cellsignal.com/pathways) — expert-curated diagrams for major signaling cascades; KEGG Pathway database — machine-readable pathway maps with download capability; Reactome — a peer-reviewed pathway knowledgebase with SVG export; and the BioNumbers database for quantitative parameters of signaling components. Always verify your diagram against multiple sources, as pathway representations can vary between references.
カテゴリー
もっと読む

How to Draw a Neural Network Architecture Diagram: A Complete Guide
Learn how to draw neural network architecture diagrams for CNNs, RNNs, Transformers, and more. Step-by-step guide with tools, examples, and best practices for researchers and engineers.
")
Plant Cell vs Animal Cell: Key Differences with Labeled Diagrams (2026)
Compare plant cells and animal cells side by side. Learn the key differences in organelles, structure, and function with labeled diagrams and a Venn diagram comparison.

Scientific Infographic Design: A Complete Guide for Researchers & Educators
Learn how to create compelling scientific infographics for research communication, teaching, and social media. Covers layout types, data visualization, design principles, and tools.