Smith Chart Generator for impedance
Free Smith chart generator. Paste impedance or reflection coefficient to draw the chart, then download SVG.
Paste impedance or reflection coefficient — renders Γ on a Smith chart as SVG, free
Impedance or Gamma
Paste R and X in ohms, or Γ as real/imag or mag/deg. This tool does not synthesize a matching network.
n=1 · match: |Γ|=0.000, ∠0.0°, VSWR=1.000. VSWR and return loss are diagnostics, not a matching design.
Smith Chart Generator
Free to try ·
Your AI Smith-chart illustration will appear here
For a data-accurate chart from Z or Γ, use the Precise Plot tab instead
Smith Chart Examples
The first four are exact engine renders from impedance. The last two are AI illustrations of Illustration mode.
Matched load
Exact engine render — Z = 50 Ω on a 50 Ω line, Γ = 0 at the center.
Inductive load
Exact engine render — z = 1 + j, Γ = 0.2 + 0.4j.
Capacitive load
Exact engine render — z = 0.5 − j0.5.
Short circuit
Exact engine render — Z = 0, Γ = −1.
AI illustration — impedance
AI illustration of Illustration mode — visual mockup, not computed from Z or Γ.
AI illustration — teaching
AI illustration of Illustration mode — visual mockup, not a matching design.
What is a Smith chart?
A Smith chart is the reflection coefficient Γ plotted on the complex plane, with circles of constant normalized resistance r and arcs of constant normalized reactance x. Radio-frequency engineers use it to read impedance, VSWR, and matching paths on a transmission line. This page maps Z = R + jX through Γ = (z − 1)/(z + 1) with z = Z/Z0, or plots Γ you already have. It is not a control-system Nyquist plot of G(jω), and it is not an electrochemical impedance plot of Z′ versus −Z″.
How to enter Z or Γ
- Impedance mode wants R and X in ohms plus a characteristic impedance Z0 (default 50 Ω). Reflection mode wants Γ as real and imaginary parts, or as magnitude and angle in degrees.
- Paste one row for a single load, or several rows to draw a locus. The red marker is the plotted point. SC is the short-circuit rim (Γ = −1), OC is the open-circuit rim (Γ = +1), and the center is a matched load.
- This page does not synthesize stubs, L-sections, or a matching network. VSWR and return loss are printed as diagnostics from |Γ|.
Smith chart versus a Nyquist plot
Both live on a complex plane, but they are different numbers. A Smith chart is Γ of a load on a transmission line. A Nyquist plot is G(jω) of a transfer function. Use this page for RF impedance. Use the Nyquist plot generator for control-system polar frequency response, and the Bode plot generator for magnitude and phase versus frequency.
Export
Download a scalable SVG with no watermark and no account required for the precise chart. The AI Illustration tab is only for slides when you do not have numbers yet — it will not match your Z or Γ.
Frequently Asked Questions
Related Engineering Tools
 Engineering
Nyquist Plot Generator
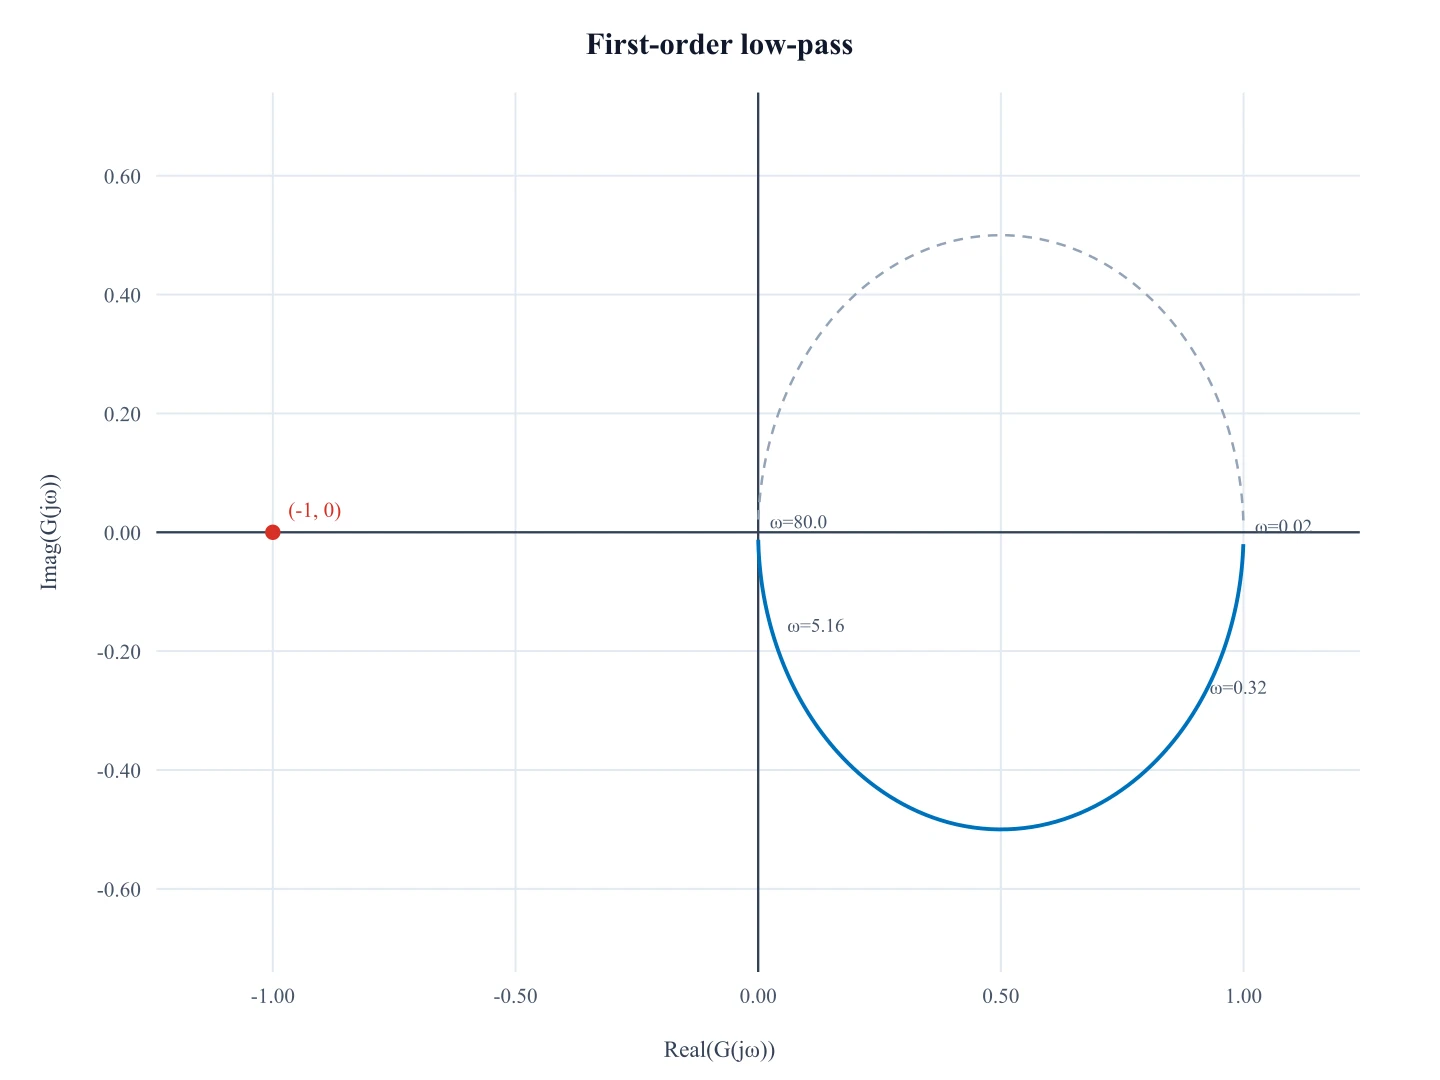
Need Re(G(jω)) versus Im(G(jω)) for a transfer function? That is a Nyquist plot, not a Smith chart.
 Engineering
Bode Plot Generator
Need magnitude and phase versus log frequency instead? That is a Bode plot.
 Physics
Circuit Diagram Maker
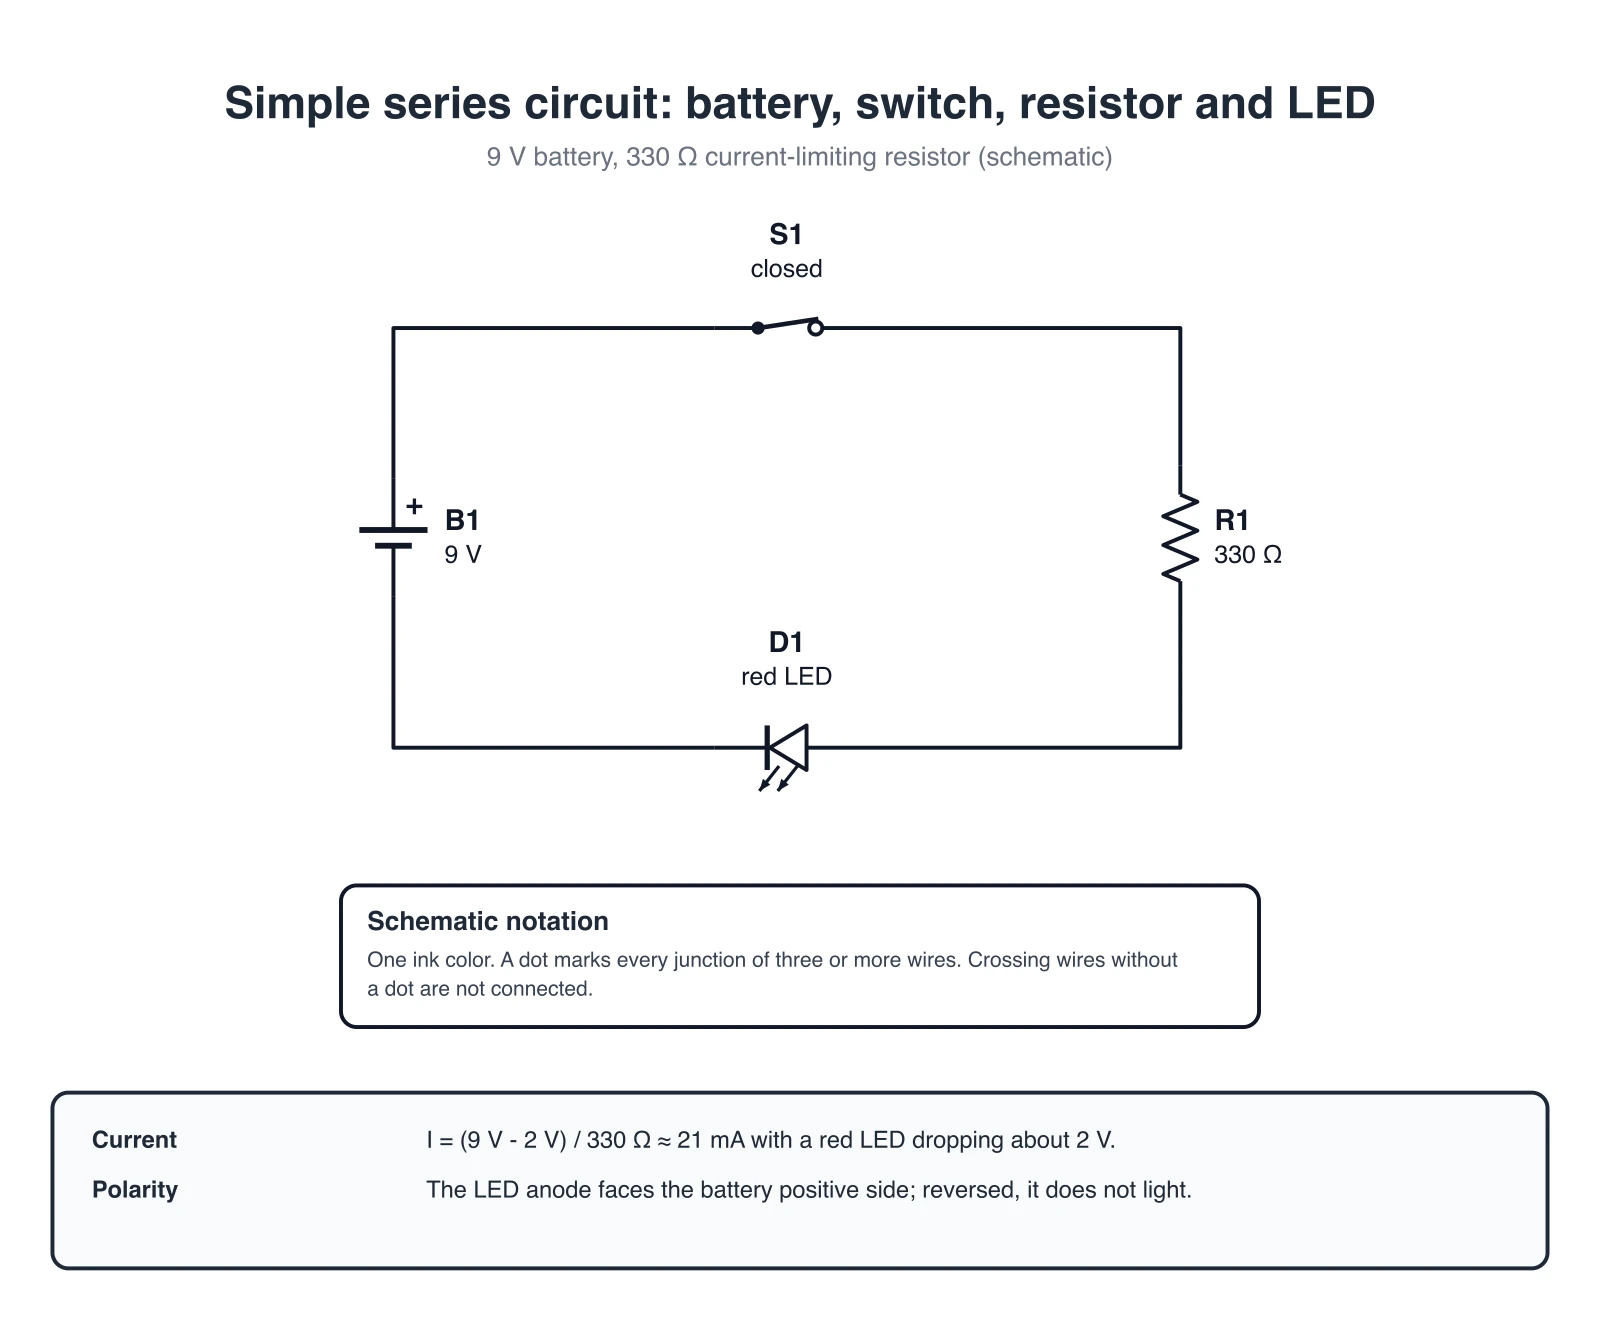
Draw the matching network or feed line whose impedance you just plotted.