Ramachandran Plot Generator for backbone φ/ψ
Free Ramachandran plot generator. Paste residue φ and ψ angles to draw allowed regions, then download SVG.
Paste residue φ and ψ — renders allowed regions as SVG, free
Residue φ and ψ
Paste φ and ψ in degrees. Optional residue names classify Gly and Pro. This tool does not parse a PDB file or draw a 3D fold.
n=4 · favored 4 · allowed 0 · outlier 0. Contours are a teaching map, not a MolProbity validation.
Ramachandran Plot Generator
Free to try ·
Your AI Ramachandran-plot illustration will appear here
For a data-accurate chart from φ and ψ, use the Precise Plot tab instead
Ramachandran Plot Examples
The first four are exact engine renders from φ and ψ. The last two are AI illustrations of Illustration mode.
Right-handed α helix
Exact engine render — canonical α-helix cluster at φ = −57°, ψ = −47°.
β sheet
Exact engine render — antiparallel and parallel β angles.
Helix, sheet, and outlier
Exact engine render — (0, 0) stays an outlier on the general map.
Glycine-rich backbone
Exact engine render — glycine uses a wider allowed map than a general residue.
AI illustration — teaching
AI illustration of Illustration mode — visual mockup, not computed from φ and ψ.
AI illustration — quality check
AI illustration of Illustration mode — not a MolProbity validation.
What is a Ramachandran plot?
A Ramachandran plot is backbone torsion φ versus ψ, usually from −180° to 180° on both axes. Steric clashes leave only a few favored islands: right-handed α helix near (−57, −47), β sheet near (−139, +135) and (−119, +113), and a small left-handed α island near (+57, +47). This page plots the angles you paste on a teaching contour. It does not parse a PDB file, run MolProbity, or draw a 3D ribbon. For a cartoon of primary through quaternary structure, use the protein structure diagram generator.
How to enter φ and ψ
- Paste two numeric columns. Headers such as phi, psi, res, and label are recognized. Angles wrap into [−180, 180]. Glycine and proline names switch that residue onto a wider or narrower map; other names stay on the general-residue contour.
- The teal fill is the favored core, drawn as the usual smooth islands (α, β, αL). The amber fill is a broader allowed belt around them. Points are colored favored, allowed, or outlier. The contour is a classroom map, not the Lovell / MolProbity statistical boundary.
- This page does not download coordinates from the PDB, compute angles from atoms, or certify a deposited structure.
Ramachandran plot versus a protein cartoon
A ribbon or four-level protein diagram shows fold shape. A Ramachandran plot shows whether each residue’s backbone torsions sit in a sterically allowed island. Use this page for φ/ψ. Use the protein structure generator when you need helices and sheets drawn in space.
Export
Download a scalable SVG with no watermark and no account required for the precise chart. The AI Illustration tab is only for slides when you do not have angles yet — it will not match your table.
Frequently Asked Questions
Related Research Tools
 Biology
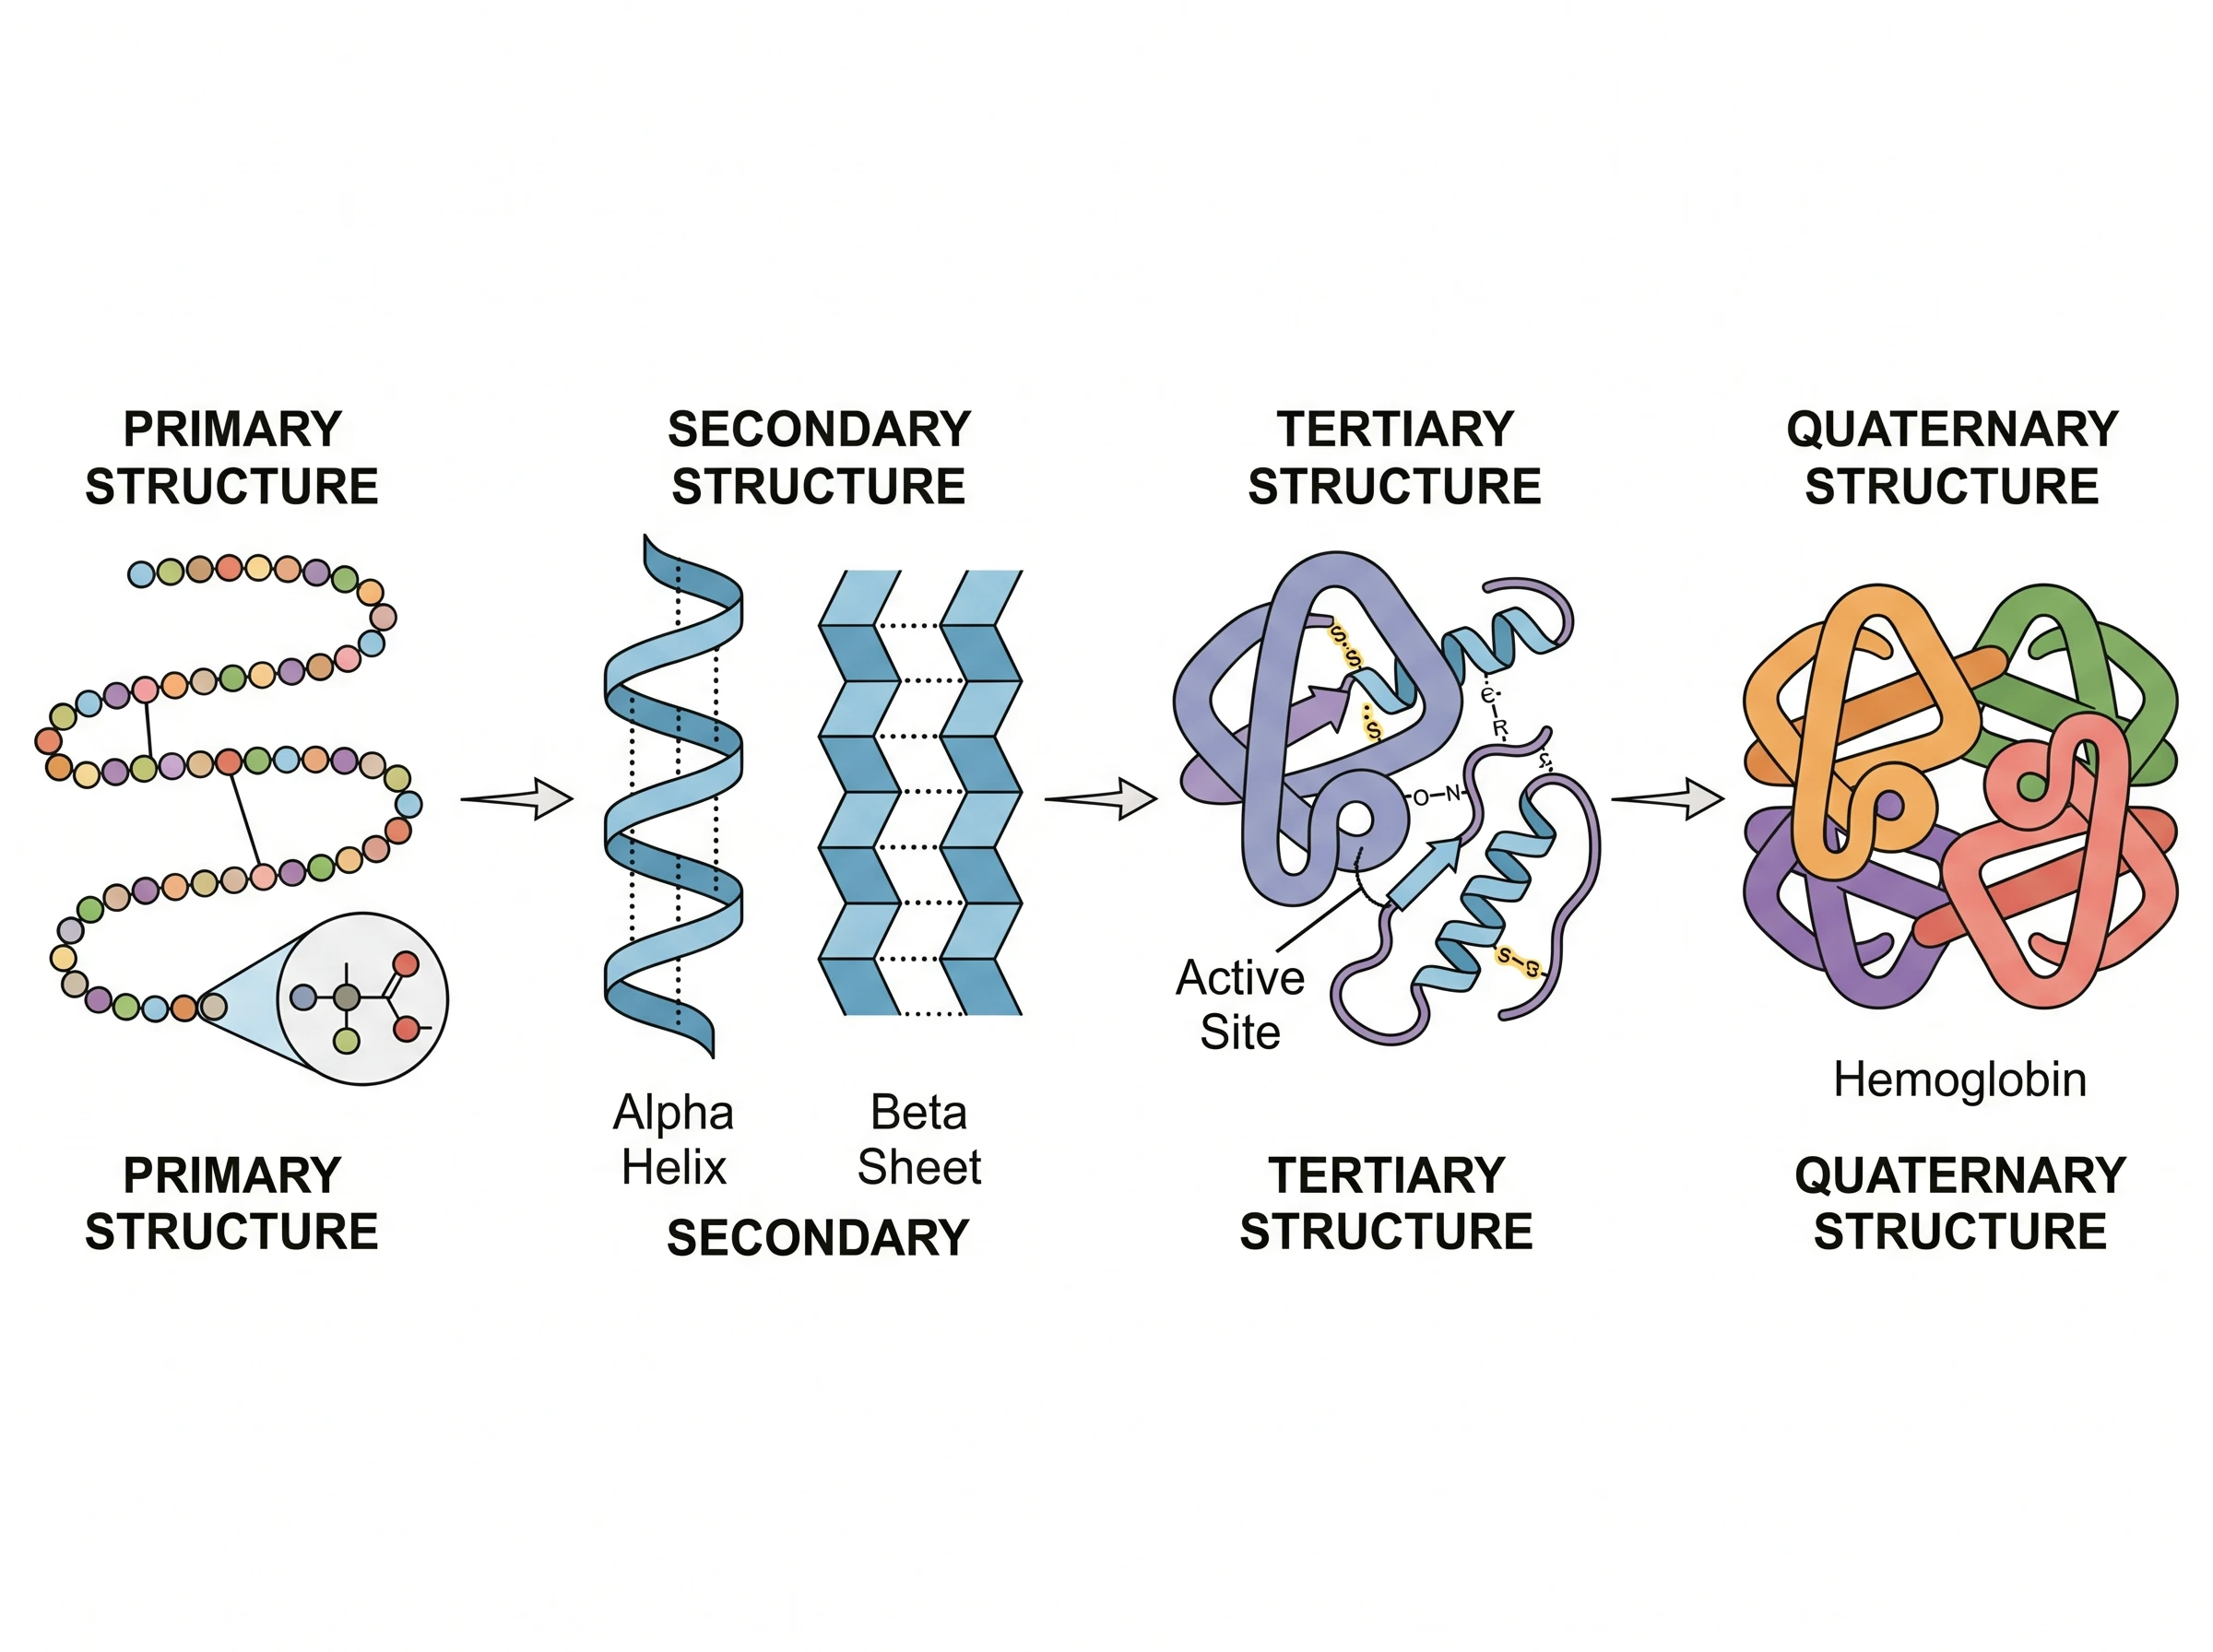
Protein Structure Diagram Generator
Need helices and sheets in 3D, not φ/ψ? That is a protein structure cartoon, not a Ramachandran plot.
 Research
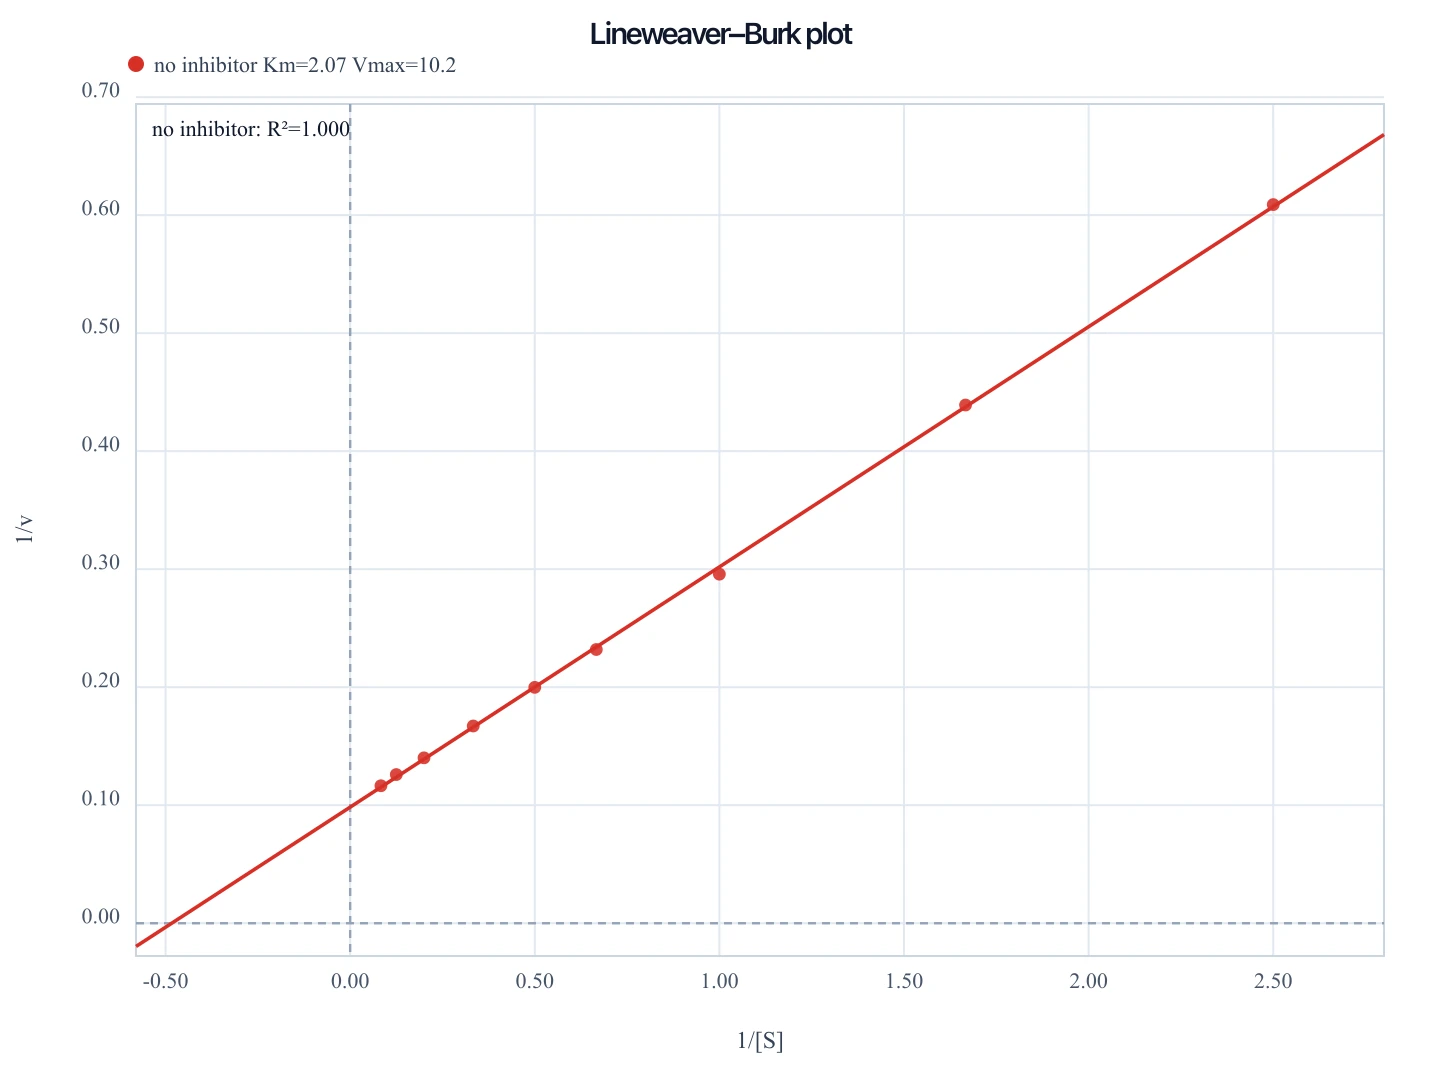
Lineweaver-Burk Plot Generator
Need a paper kinetics figure instead? Paste [S] and v for a double-reciprocal plot.
 Biology
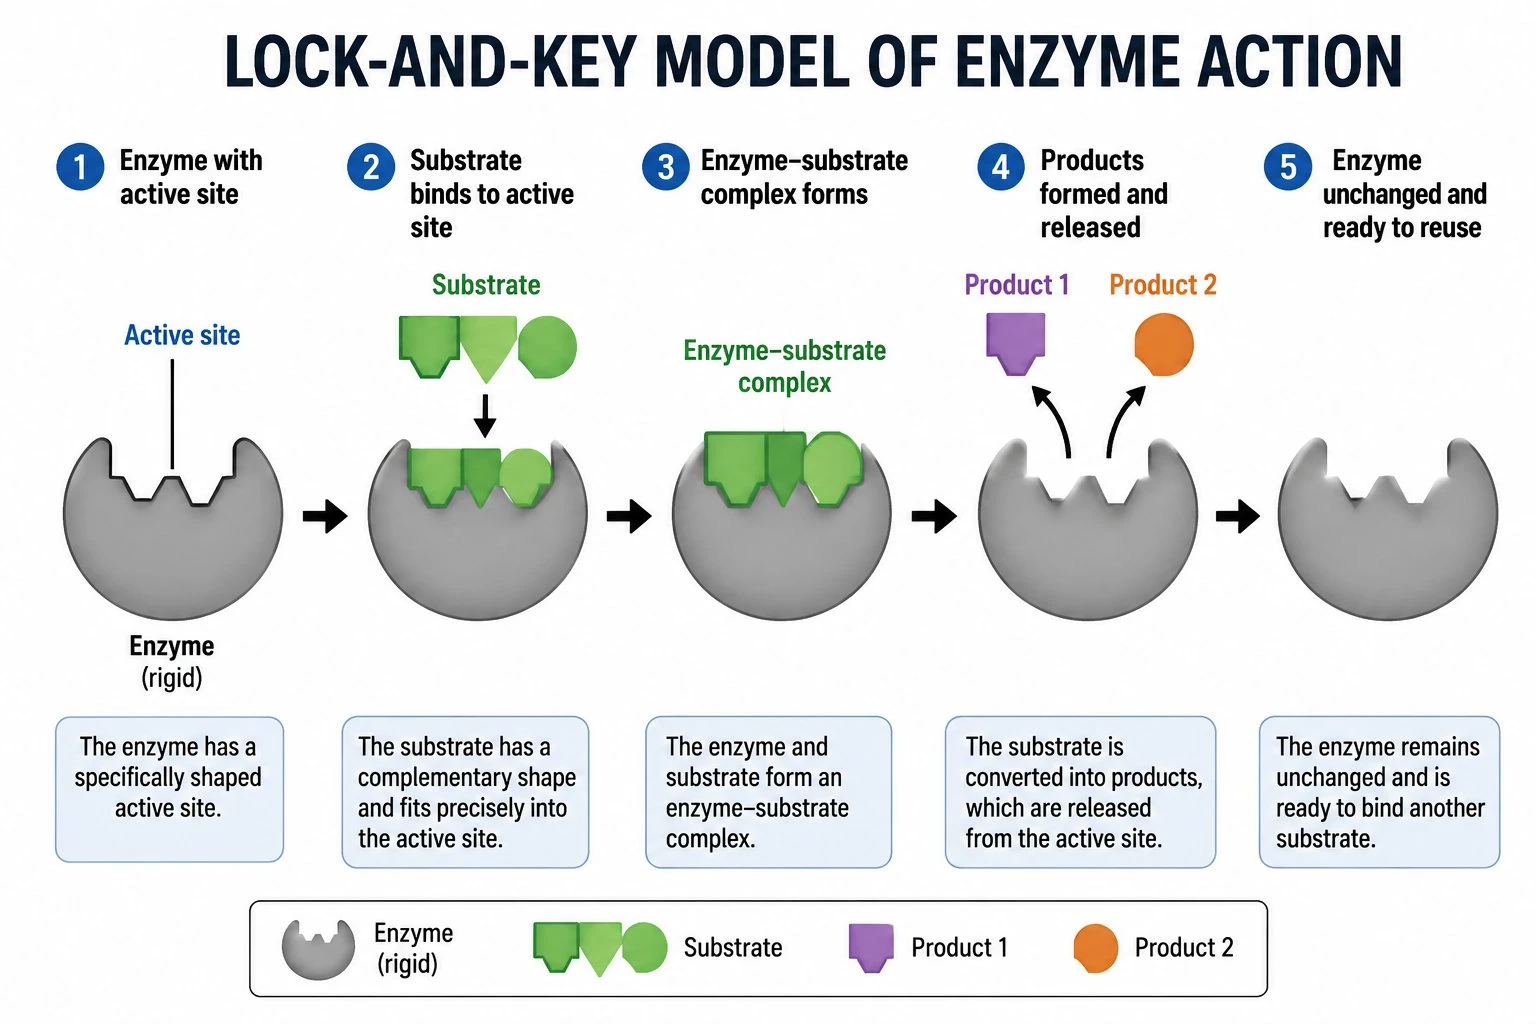
Enzyme Diagram Generator
Draw a labeled enzyme–substrate cartoon to sit next to the backbone plot.