Addition Chart Generator for Addition Facts
Create a printable addition chart — 1–10, 1–12 or 1–20, full answers, blank worksheet or fill-in challenge. Highlight make-10 and doubles. Free SVG.
Range (up to N)
Chart mode
Addition Chart Examples
Common ways to build and use an addition facts grid
Full 1–10 Addition Chart
Exact engine render — the default complete 1–10 addition chart with every sum filled in.
Fill-In Addition Worksheet
Exact engine render — fill-in challenge mode hides part of the grid for students to complete.
Make-10 Addition Chart
Exact engine render — a make-10 chart that spotlights every pair of numbers that sums to ten.
Addition Chart 1–20
Exact engine render — a large 1–20 addition chart for older students and reference walls.
Colorful Addition Chart Poster
AI illustration — a cheerful addition chart poster for a classroom wall.
Blank Addition Grid
AI illustration — a blank addition grid ready for timed drills and practice.
What is an addition chart?
An addition chart — also called an addition table or addition facts grid — is a table that shows the sums of two sets of numbers. The numbers along the top form the columns and the numbers down the left side form the rows; the cell where a row and column meet holds their sum. On a standard 1–10 chart, the cell in row 4 and column 7 shows 11, because 4 + 7 = 11, and the bottom-right corner shows 20, because 10 + 10 = 20. Because every sum appears in a fixed, predictable spot, the chart works both as a quick reference and as a map of the patterns inside addition — doubles down the diagonal, counting-on sequences across each row, and the symmetry that comes from addition being commutative. This generator draws the grid exactly, so every sum is correct no matter how large you make the chart.
Teaching strategies with an addition chart
- Make 10 first. Turn on the make-10 highlight and every pair that sums to ten lights up — 1 + 9, 2 + 8, 3 + 7, 6 + 4 — the foundation of the make-10 strategy, where 8 + 5 becomes 8 + 2 + 3. The chart turns that mental decomposition into something visible.
- Doubles are the next anchor. The diagonal running from top-left to bottom-right holds 1+1, 2+2, 3+3 and so on. Tint the diagonal in the tool and the doubles pop out as a pattern students can memorize fast — then near-doubles like 6 + 7 become "double 6 plus 1".
- Addition is commutative, so the chart is symmetric across its diagonal: 3 + 8 and 8 + 3 both land on 11. Pointing at the mirror image is a concrete way to show why students only need to learn about half the facts.
Blank and fill-in worksheets
- Switch to blank worksheet mode and the grid keeps its numbered headers but empties its cells. Students fill in the sums themselves — active recall instead of passive reading, which is the practice that actually moves facts into long-term memory.
- For row-by-row practice, blank only one row — say the 7 row — while the rest of the chart stays filled. Learners drill a single addend family with the rest of the table available as a scaffold and answer key.
- Fill-in challenge mode hides a seeded random subset of cells, so every worksheet mixes givens and gaps. The seed is reproducible: same seed, same worksheet — print one for the class and reshuffle for the next round.
Addition chart vs multiplication chart
An addition chart and a multiplication chart share the same layout — row header meets column header, cell holds the answer — which is exactly why they pair so well. Students who can already read an addition chart transfer that skill directly when they meet the times table grid a year or two later: same navigation, same symmetry argument, same diagonal trick (squares instead of doubles). The difference is the operation: sums grow slowly and evenly across the addition chart, while products accelerate across the multiplication chart, so the multiplication grid hides steeper patterns like the 9s digit-sum rule. When your class is ready to make the jump, head to our Multiplication Chart Generator — the same tool with times tables, highlighting, and blank practice grids.
Frequently Asked Questions
Related Math Tools
 Education
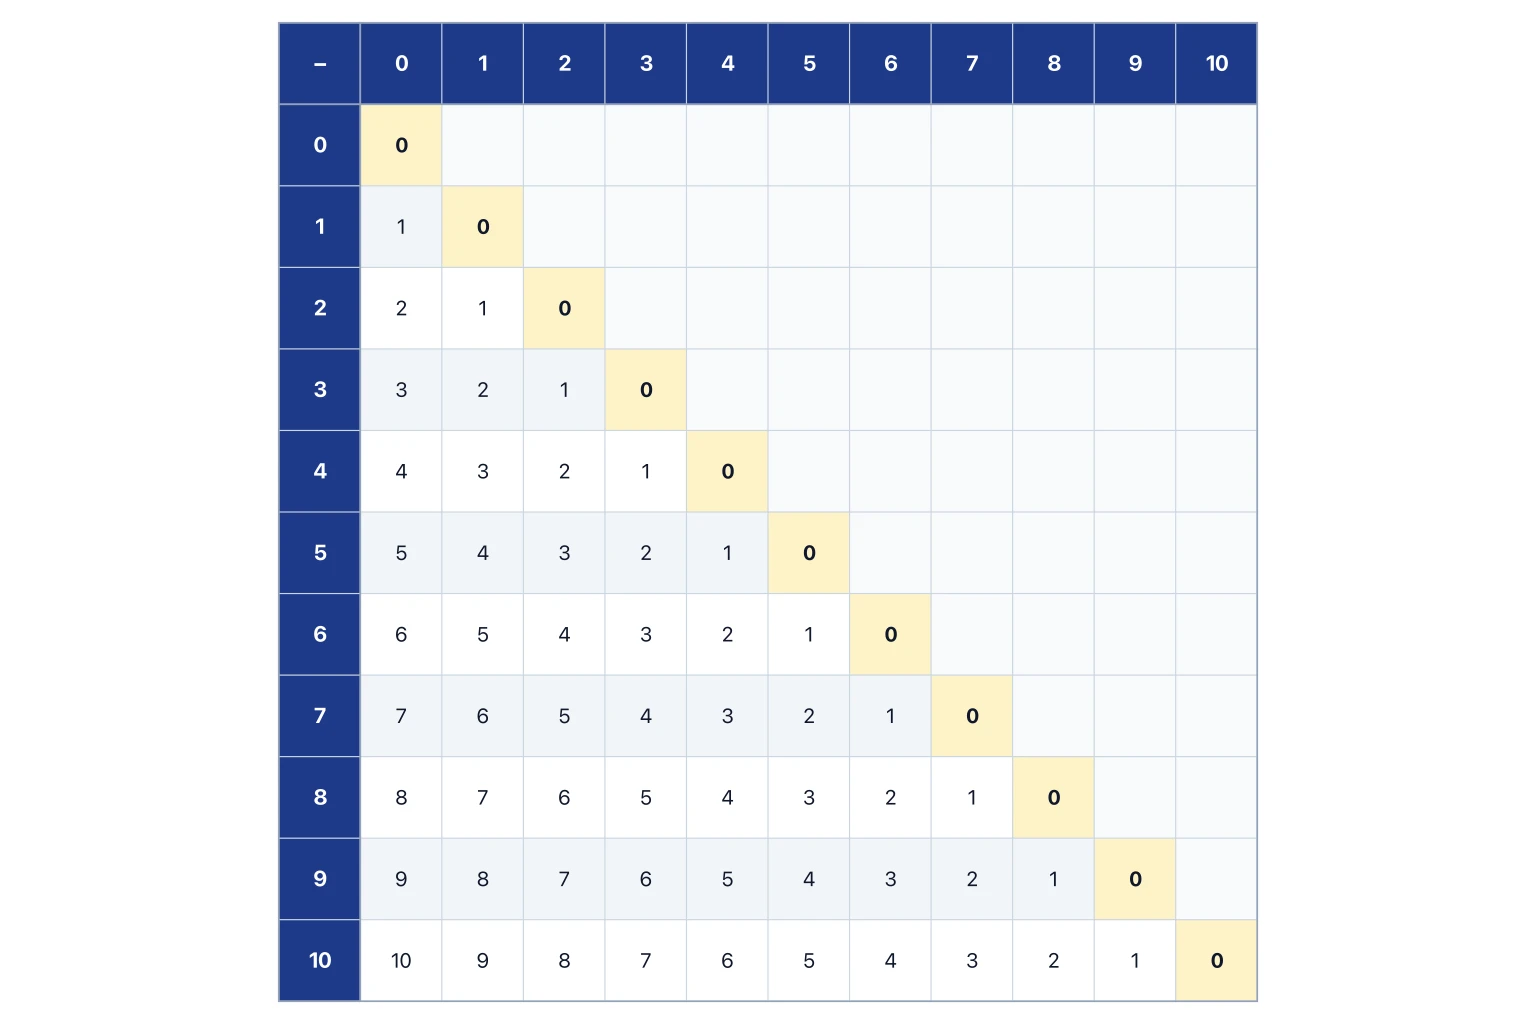
Subtraction Chart Generator
Printable subtraction tables with zero diagonal, constant-difference highlights, and worksheets.
 Education
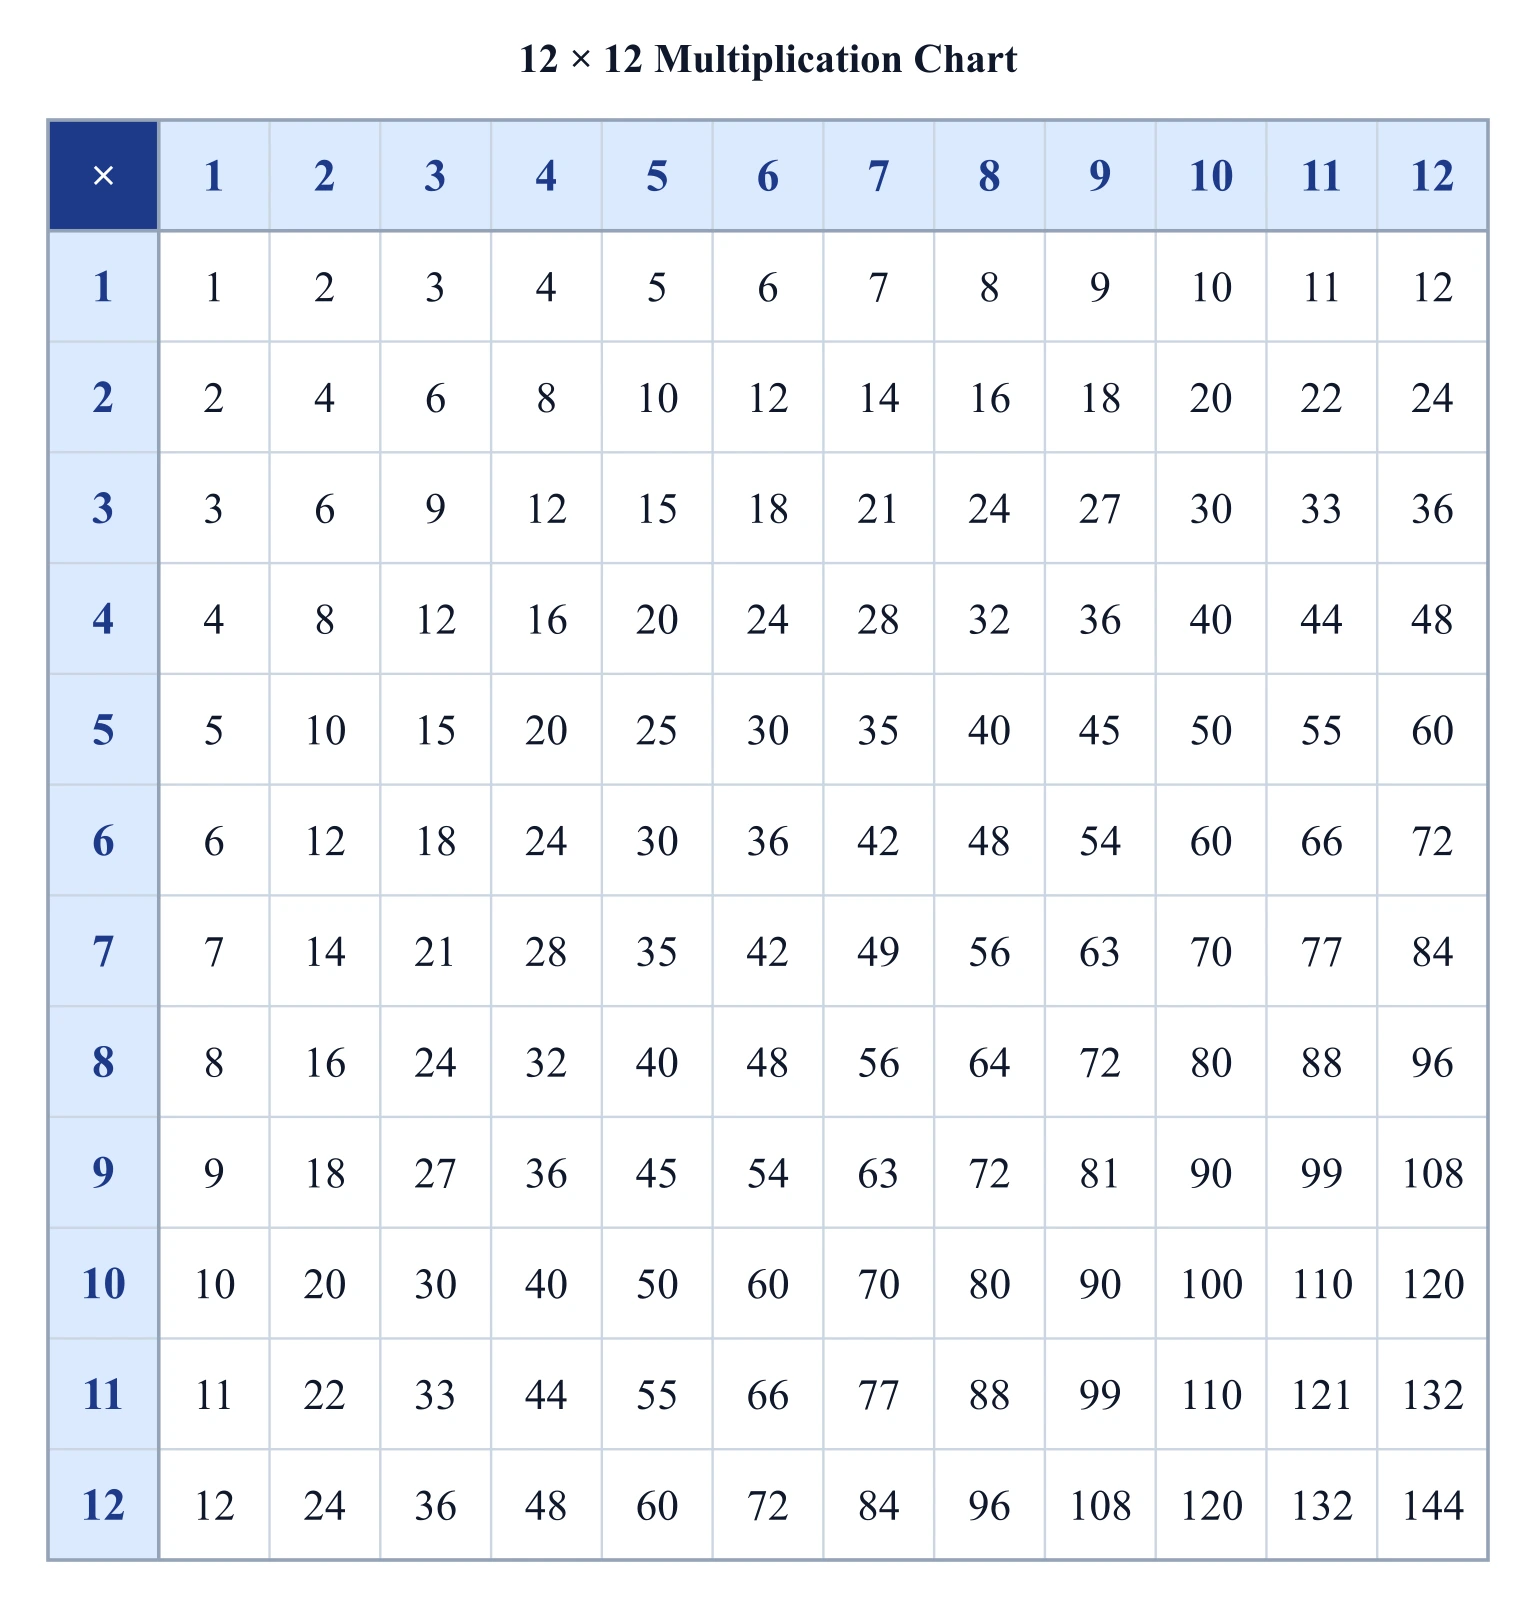
Multiplication Chart Generator
Create printable times table grids: pick the size, highlight any times table, and export filled or blank charts.
 Education
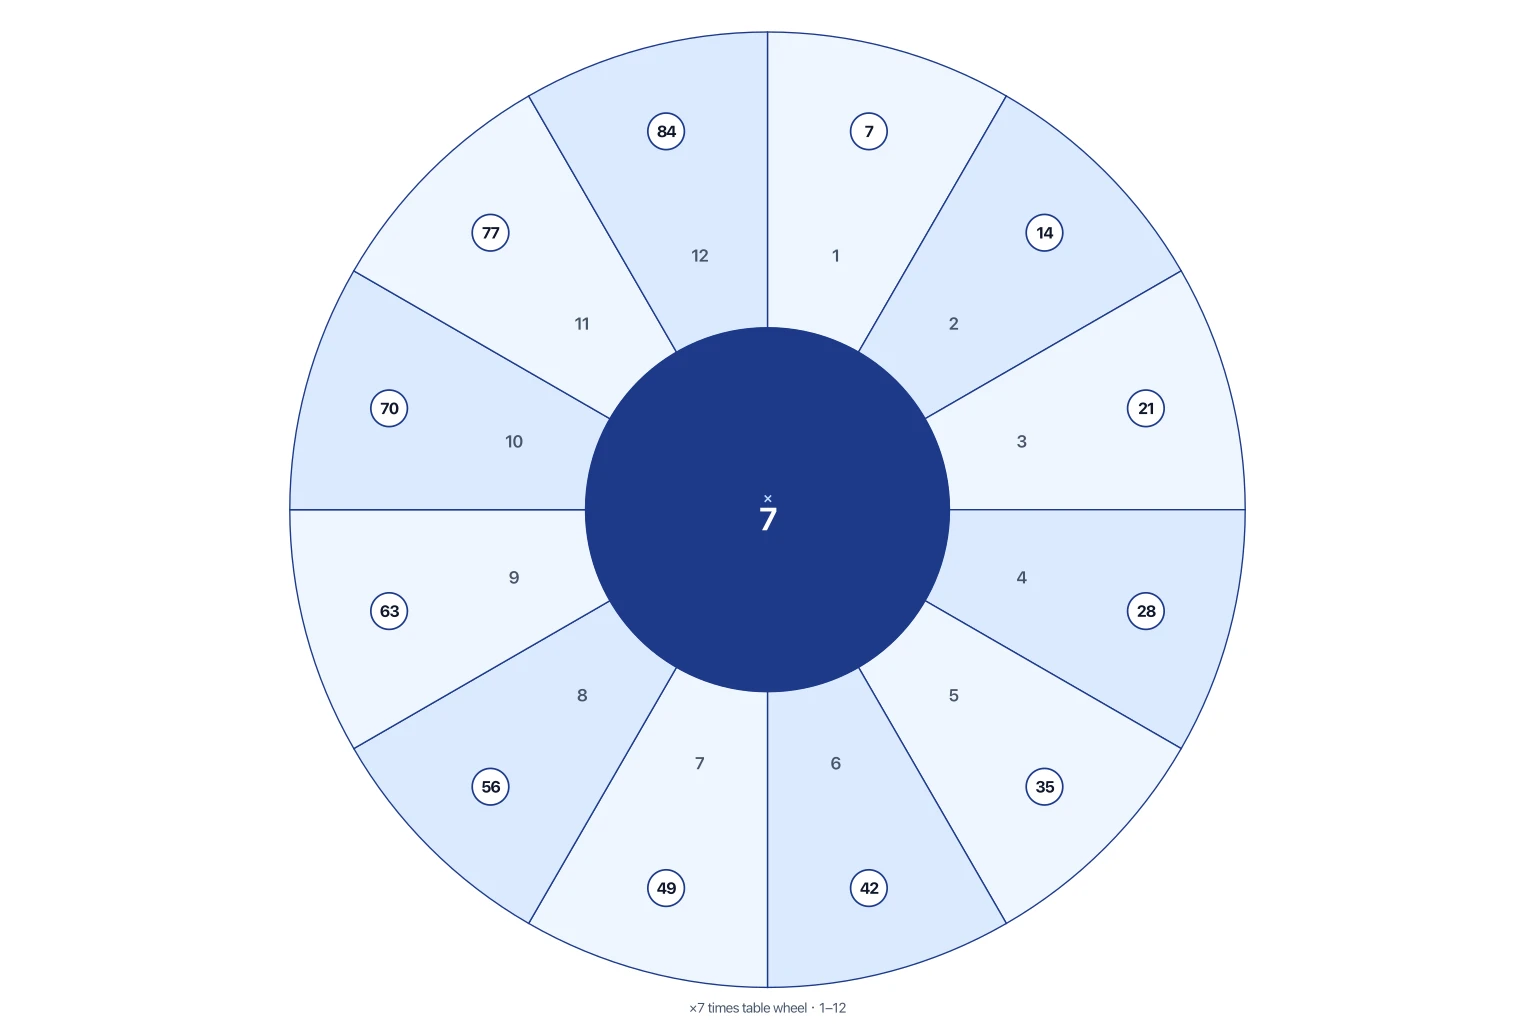
Multiplication Wheel Generator
Build a printable times-table wheel with a center factor and products around the rim.