
How to Make a Histogram in Google Sheets: Bins, Frequency Tables, and Chart Editor Tips
Learn how to make a histogram in Google Sheets, change bucket size, use frequency tables, fix common chart issues, and format a readable distribution chart.
Google Sheets can make a histogram directly from a column of numbers, but the default chart is not always the clearest version of your data. The key is understanding what Sheets calls bucket size, when to use the built-in histogram chart, and when to build a manual frequency table first.
This guide walks through the practical workflow: prepare your data, insert a histogram, change bins, format the chart, and troubleshoot the issues that usually confuse students, teachers, researchers, and analysts.
Histogram Maker
Create clean histograms and distribution charts from a text prompt or dataset for reports, teaching, and research visuals.
Create a histogram ->Quick Answer: How Do You Make a Histogram in Google Sheets?
To make a histogram in Google Sheets:
- Put your raw numeric data in one column.
- Select the data range.
- Click
Insert > Chart. - In the Chart editor, open the
Setuptab. - Change
Chart typetoHistogram chart. - Open
Customize > Histogram. - Adjust
Bucket sizeif the default bins are too wide or too narrow. - Add a clear title and axis labels.
Use the built-in histogram chart when you have raw values such as scores, ages, delivery times, rainfall amounts, or reaction times. Use a manual frequency table when you already have grouped counts or need exact class intervals for an assignment or report.
A histogram groups continuous numeric values into bins so the reader can see the shape of the distribution.
What a Histogram Shows
A histogram shows the distribution of one numeric variable. Instead of one bar per category, it groups values into intervals, often called bins or buckets, and counts how many values fall into each interval.
Tableau's histogram guide describes histograms as charts that use bins to show frequency distributions. That is the core idea: the bars are not separate categories. They are ranges of a continuous scale.
| Question | Better chart |
|---|---|
| How many students scored in each score range? | Histogram |
| Which product category sold the most? | Bar chart |
| How is delivery time distributed? | Histogram |
| What percent of budget went to each department? | Pie chart |
| Are two variables correlated? | Scatter plot |
If your x-axis is a set of names, labels, or categories, you probably need a bar chart. If your x-axis is a numeric scale split into ranges, a histogram is usually the right choice.
For more on the distinction, see our bar chart vs histogram guide.
Step 1: Prepare Your Google Sheets Data
Google Sheets works best when the source data is a single column of raw numbers.
Recommended structure:
| Exam Score |
|---|
| 52 |
| 61 |
| 68 |
| 71 |
| 74 |
| 76 |
| 81 |
| 88 |
| 91 |
| 95 |
Before charting, check these details:
- The column contains numeric values, not text.
- There are no blank rows inside the selected range.
- All values use the same unit.
- The header is short and meaningful.
- You are using raw observations, not already summarized counts.
This last point is important. The built-in Google Sheets histogram expects raw values. If you already have a frequency table such as 0-10: 4, 10-20: 9, and 20-30: 6, the built-in histogram may not interpret it the way you expect. In that case, use the manual frequency-table method later in this guide.
Step 2: Insert the Histogram Chart
Google's official Add and edit a chart or graph documentation gives the general Sheets chart workflow: select the data, insert a chart, and edit the chart from the Chart editor. For histograms, the workflow is:
- Select your numeric data column.
- Click
Insert. - Click
Chart. - In the Chart editor, go to
Setup. - Open the
Chart typedropdown. - Scroll to the
Othersection. - Select
Histogram chart.
Google Sheets may guess the histogram automatically, especially if the selected data is a single numeric column. Still, confirm the chart type manually. If Sheets chooses a column chart or line chart, switch it to Histogram chart.
Step 3: Understand Bucket Size
In Google Sheets, the setting most users call "bin size" appears as Bucket size. It controls the width of each interval.
For example, if your values are exam scores from 50 to 100:
| Bucket size | Approximate result |
|---|---|
| Auto | Sheets chooses the interval |
| 5 | 50-55, 55-60, 60-65, etc. |
| 10 | 50-60, 60-70, 70-80, etc. |
| 20 | 40-60, 60-80, 80-100, etc. |
Statology's tutorial on changing histogram bins in Google Sheets notes the practical tradeoff: increasing bucket size creates fewer, wider bins; decreasing bucket size creates more, narrower bins. That is exactly what you should test when the default chart looks wrong.
To change bucket size:
- Double-click the chart.
- Open the Chart editor.
- Click
Customize. - Open
Histogram. - Change
Bucket sizefromAutoto the interval you want.
Changing bucket size can make the same dataset look clearer, smoother, or more detailed.
How to Choose a Good Bucket Size
There is no perfect bucket size for every dataset. Choose based on the story you need the chart to tell.
Use wider buckets when:
- The dataset is small.
- The chart looks noisy.
- You only need a high-level summary.
- The audience is not doing detailed statistical inspection.
Use narrower buckets when:
- You have many observations.
- You need to reveal clusters or multiple peaks.
- Small changes in the distribution matter.
- The chart is for analysis rather than a quick presentation.
For classroom or reporting work, choose intervals people naturally understand:
- Exam scores: 10-point bins
- Ages: 5-year or 10-year bins
- Time duration: 1-minute, 5-minute, or 10-minute bins
- Money: round intervals such as 100, 500, 1,000, or 10,000
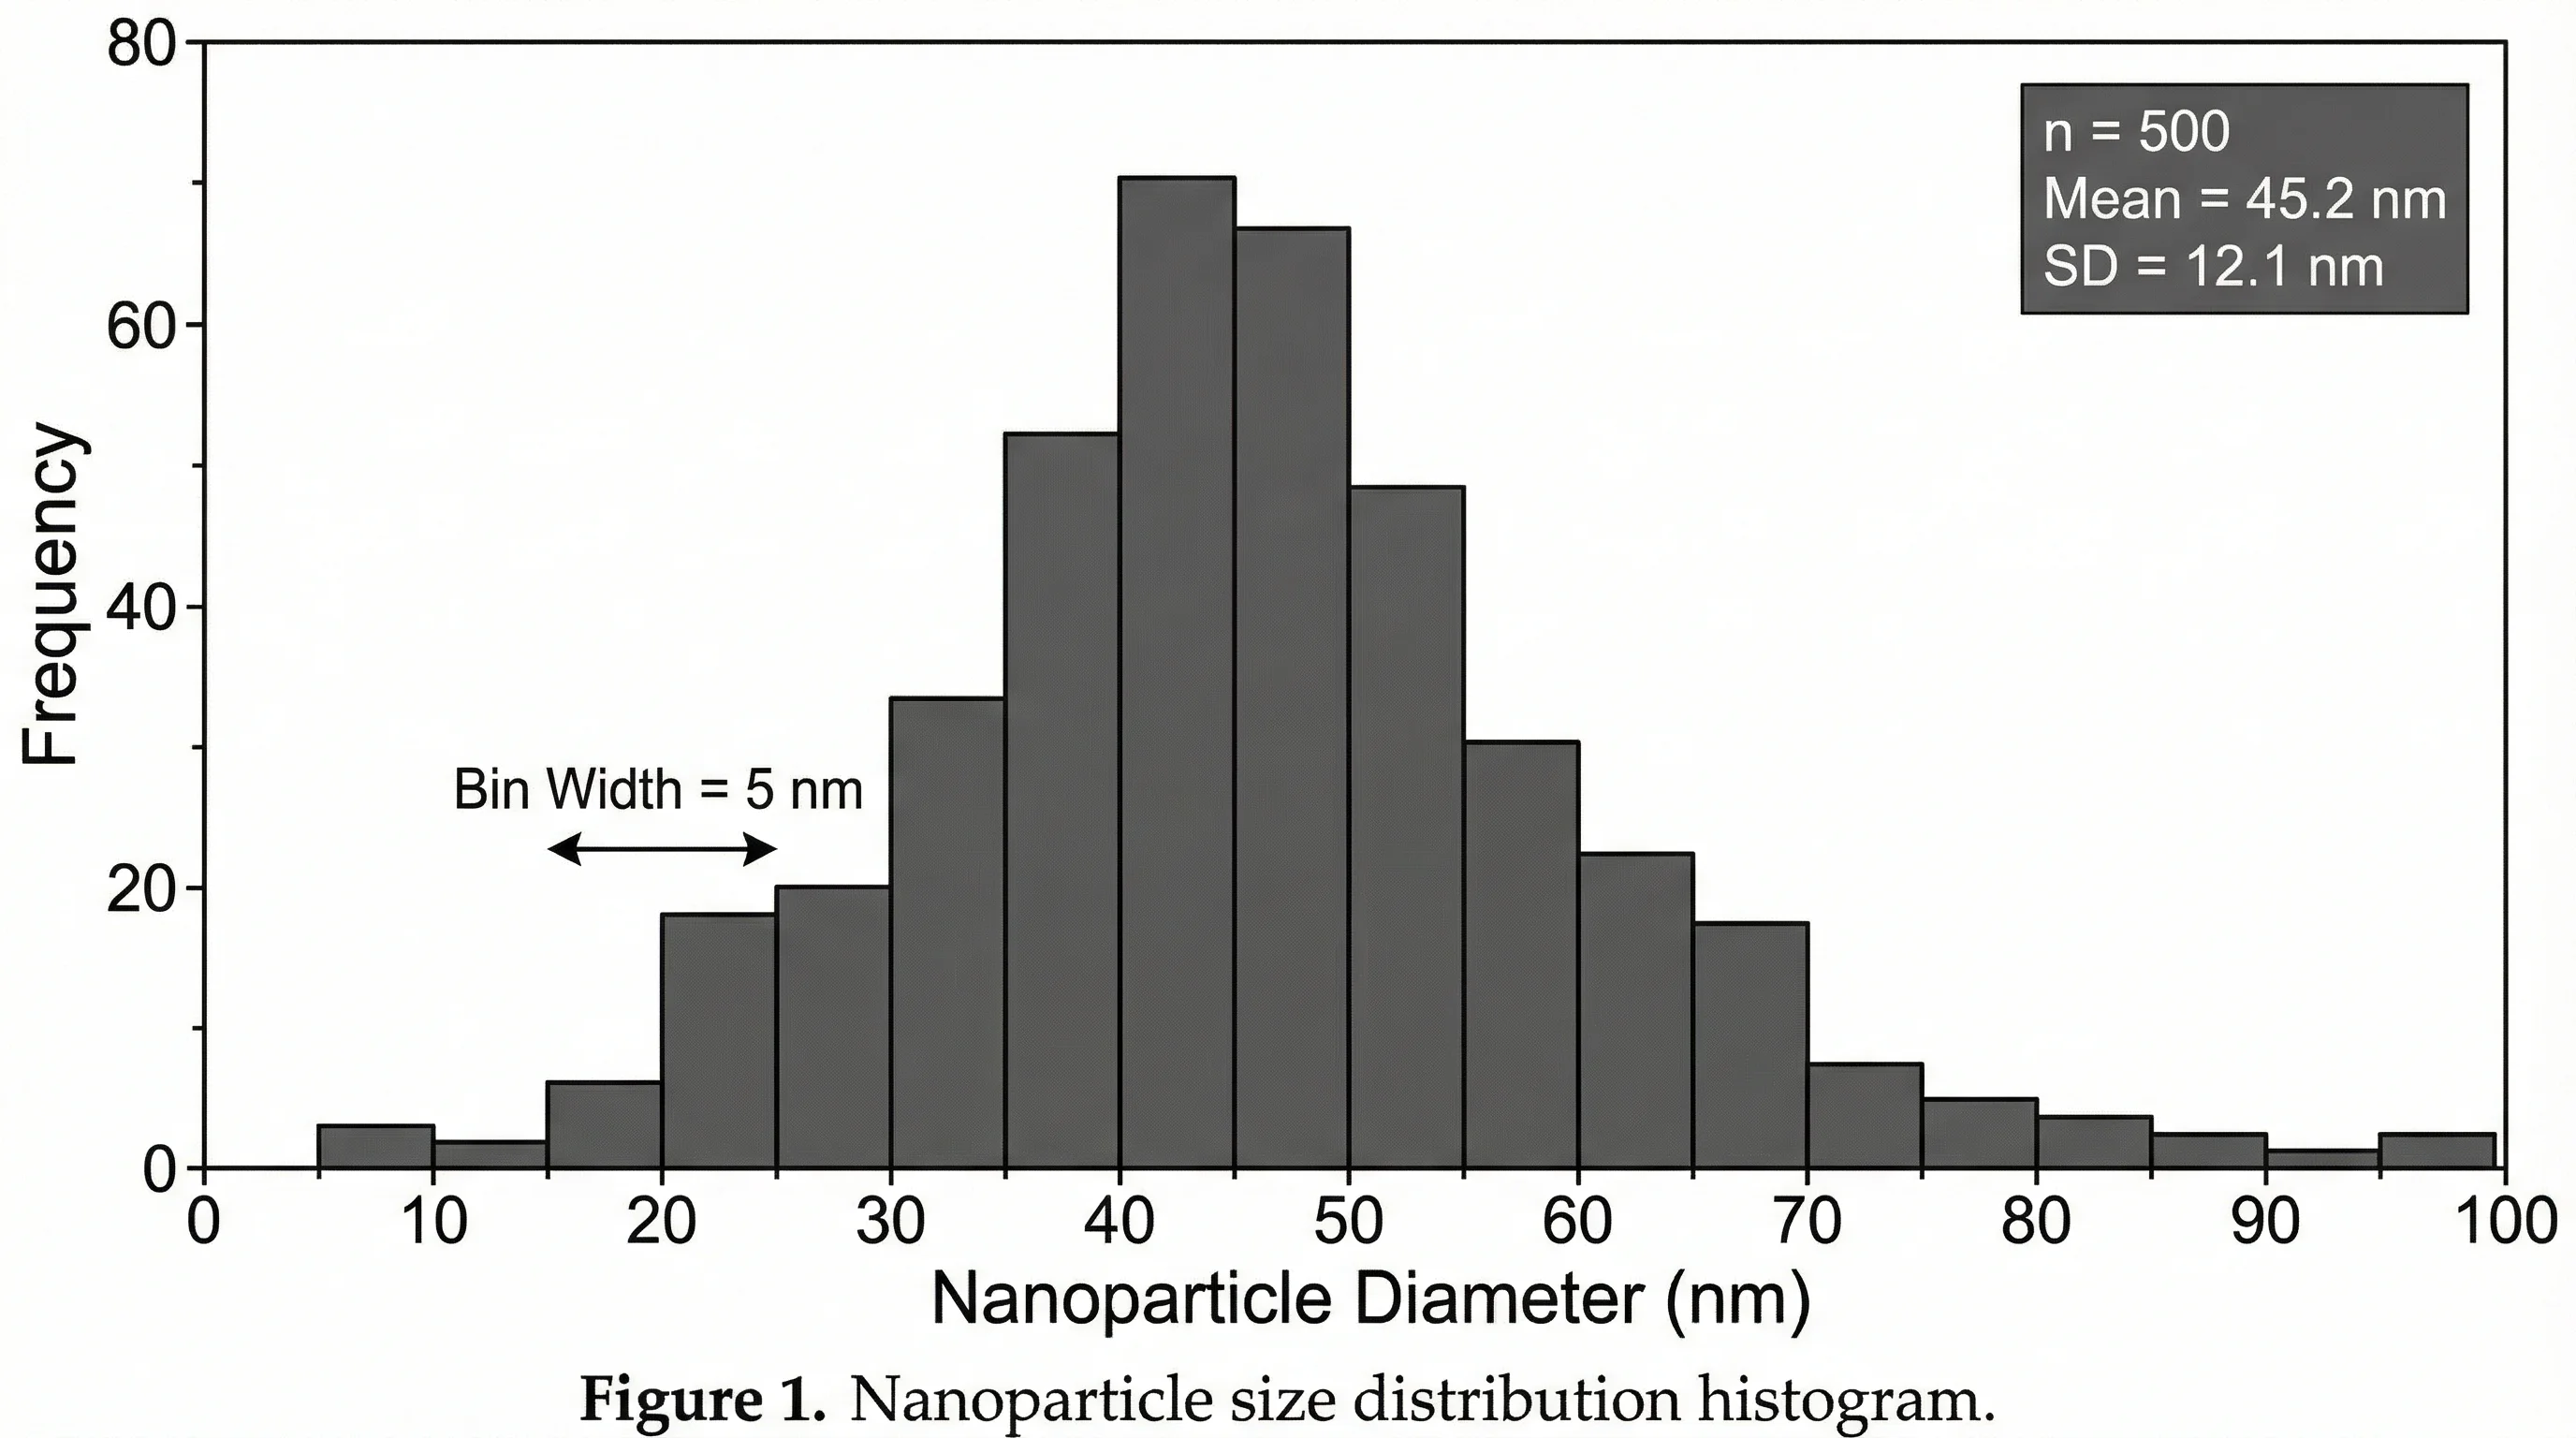
If the chart is for a statistics assignment, follow the bin requirement given by the instructor. If the chart is for a research report, state the bin width in the caption or axis label.
Step 4: Customize the Histogram
After the bins make sense, format the chart so readers can understand it quickly.
Chart title
Use a title that names the variable and context:
Distribution of Exam ScoresCustomer Wait Time DistributionRainfall Frequency by Daily TotalReaction Time Distribution in Control Group
Avoid titles like Histogram or Chart 1.
Horizontal axis
The x-axis should name the variable and unit:
ScoreAge (years)Delivery Time (minutes)Reaction Time (ms)
Vertical axis
The y-axis is usually frequency:
FrequencyNumber of StudentsNumber of OrdersCount of Observations
Colors
Histograms usually work best with one main color. If you use too many colors, readers may assume each bar is a different category, which is not how a histogram works.
For research visuals, keep the color restrained. If you need a publication or poster chart, our research data visualization guide and scientific color palette guide cover more detailed formatting choices.
Method 2: Make a Histogram from a Frequency Table
Sometimes you already have bins and counts:
| Bin | Frequency |
|---|---|
| 0-10 | 3 |
| 10-20 | 7 |
| 20-30 | 11 |
| 30-40 | 5 |
The built-in histogram chart is not ideal for this structure because it expects raw values. To display a frequency table, use a column chart and format it to behave like a histogram.
Basic workflow:
- Put bin labels in one column.
- Put frequency counts in the next column.
- Select both columns.
- Click
Insert > Chart. - Choose
Column chart. - Reduce spacing between bars if available.
- Label the x-axis with the bin ranges.
This is technically a column chart, but it is the practical solution when your source data is already summarized. The important thing is to make sure the intervals are equal width. Unequal bin widths can make a frequency display misleading because bar height alone no longer represents the distribution fairly.
If you need exact reporting intervals, build a frequency table first and then chart the counts carefully.
Method 3: Use the FREQUENCY Function for Exact Bins
If you have raw data but want exact control over bin boundaries, create a frequency table with the FREQUENCY function.
Example:
- Raw values are in
A2:A101 - Bin upper limits are in
C2:C7 - Frequencies will appear in
D2:D8
Formula:
=FREQUENCY(A2:A101,C2:C7)Google Sheets returns the count of values that fall into each bin. The final output includes an extra count for values above the highest bin limit.
Use this method when:
- Your assignment requires exact intervals.
- You need the frequency table for later calculations.
- The built-in histogram chooses awkward buckets.
- You want to report both the table and the chart.
After creating the table, chart it as a column chart with bin labels. This gives you more control than the automatic histogram chart.
Common Problems and Fixes
Google Sheets made the wrong chart type
Open Setup in the Chart editor and manually choose Histogram chart. Sheets often guesses correctly, but not always.
The histogram has too few bars
Open Customize > Histogram and reduce Bucket size. Smaller buckets create more bars.
The histogram has too many bars
Increase Bucket size. Larger buckets create fewer bars and a smoother chart.
The x-axis labels look strange
Check whether your values are stored as text. Also check whether the data range includes headers, blank cells, or non-numeric values.
The chart does not match my frequency table
The built-in histogram is designed for raw data. For a frequency table, use a column chart or rebuild the raw data if your assignment specifically requires a histogram chart type.
I want an average line on the histogram
Google Sheets does not make this as simple as some dedicated charting tools. The workaround is to create an additional series or use a separate annotation, but for many reports it is cleaner to state the mean in the caption or a nearby summary table.
AI Chart Generator
Create clean chart visuals from data descriptions when the Google Sheets chart editor is too limiting.
Built-In Histogram vs. Manual Frequency Table
Use this decision table:
| Situation | Best method |
|---|---|
| You have one column of raw values | Built-in histogram chart |
| You need quick distribution insight | Built-in histogram chart |
| You need exact class intervals | FREQUENCY table plus chart |
| You already have grouped counts | Column chart based on frequency table |
| You need a polished report figure | Build in Sheets, then recreate or refine in a chart tool |
| You need publication-style labels | Use a dedicated chart or design workflow |
The built-in histogram is fastest. The frequency table method is more transparent. For teaching and assignments, transparency often matters more than speed.
Histogram Formatting Checklist
Before you submit or share the chart, check:
- The chart uses numeric raw data or a valid frequency table.
- The bucket size makes sense for the dataset.
- The x-axis names the variable and unit.
- The y-axis says frequency or count.
- The title explains the dataset, not just the chart type.
- The bars are not colored as if they were categories.
- The bin choice does not hide outliers or create fake patterns.
- The chart caption states the bin width if that matters.
A readable histogram should make skew, spread, clusters, and outliers easy to notice.
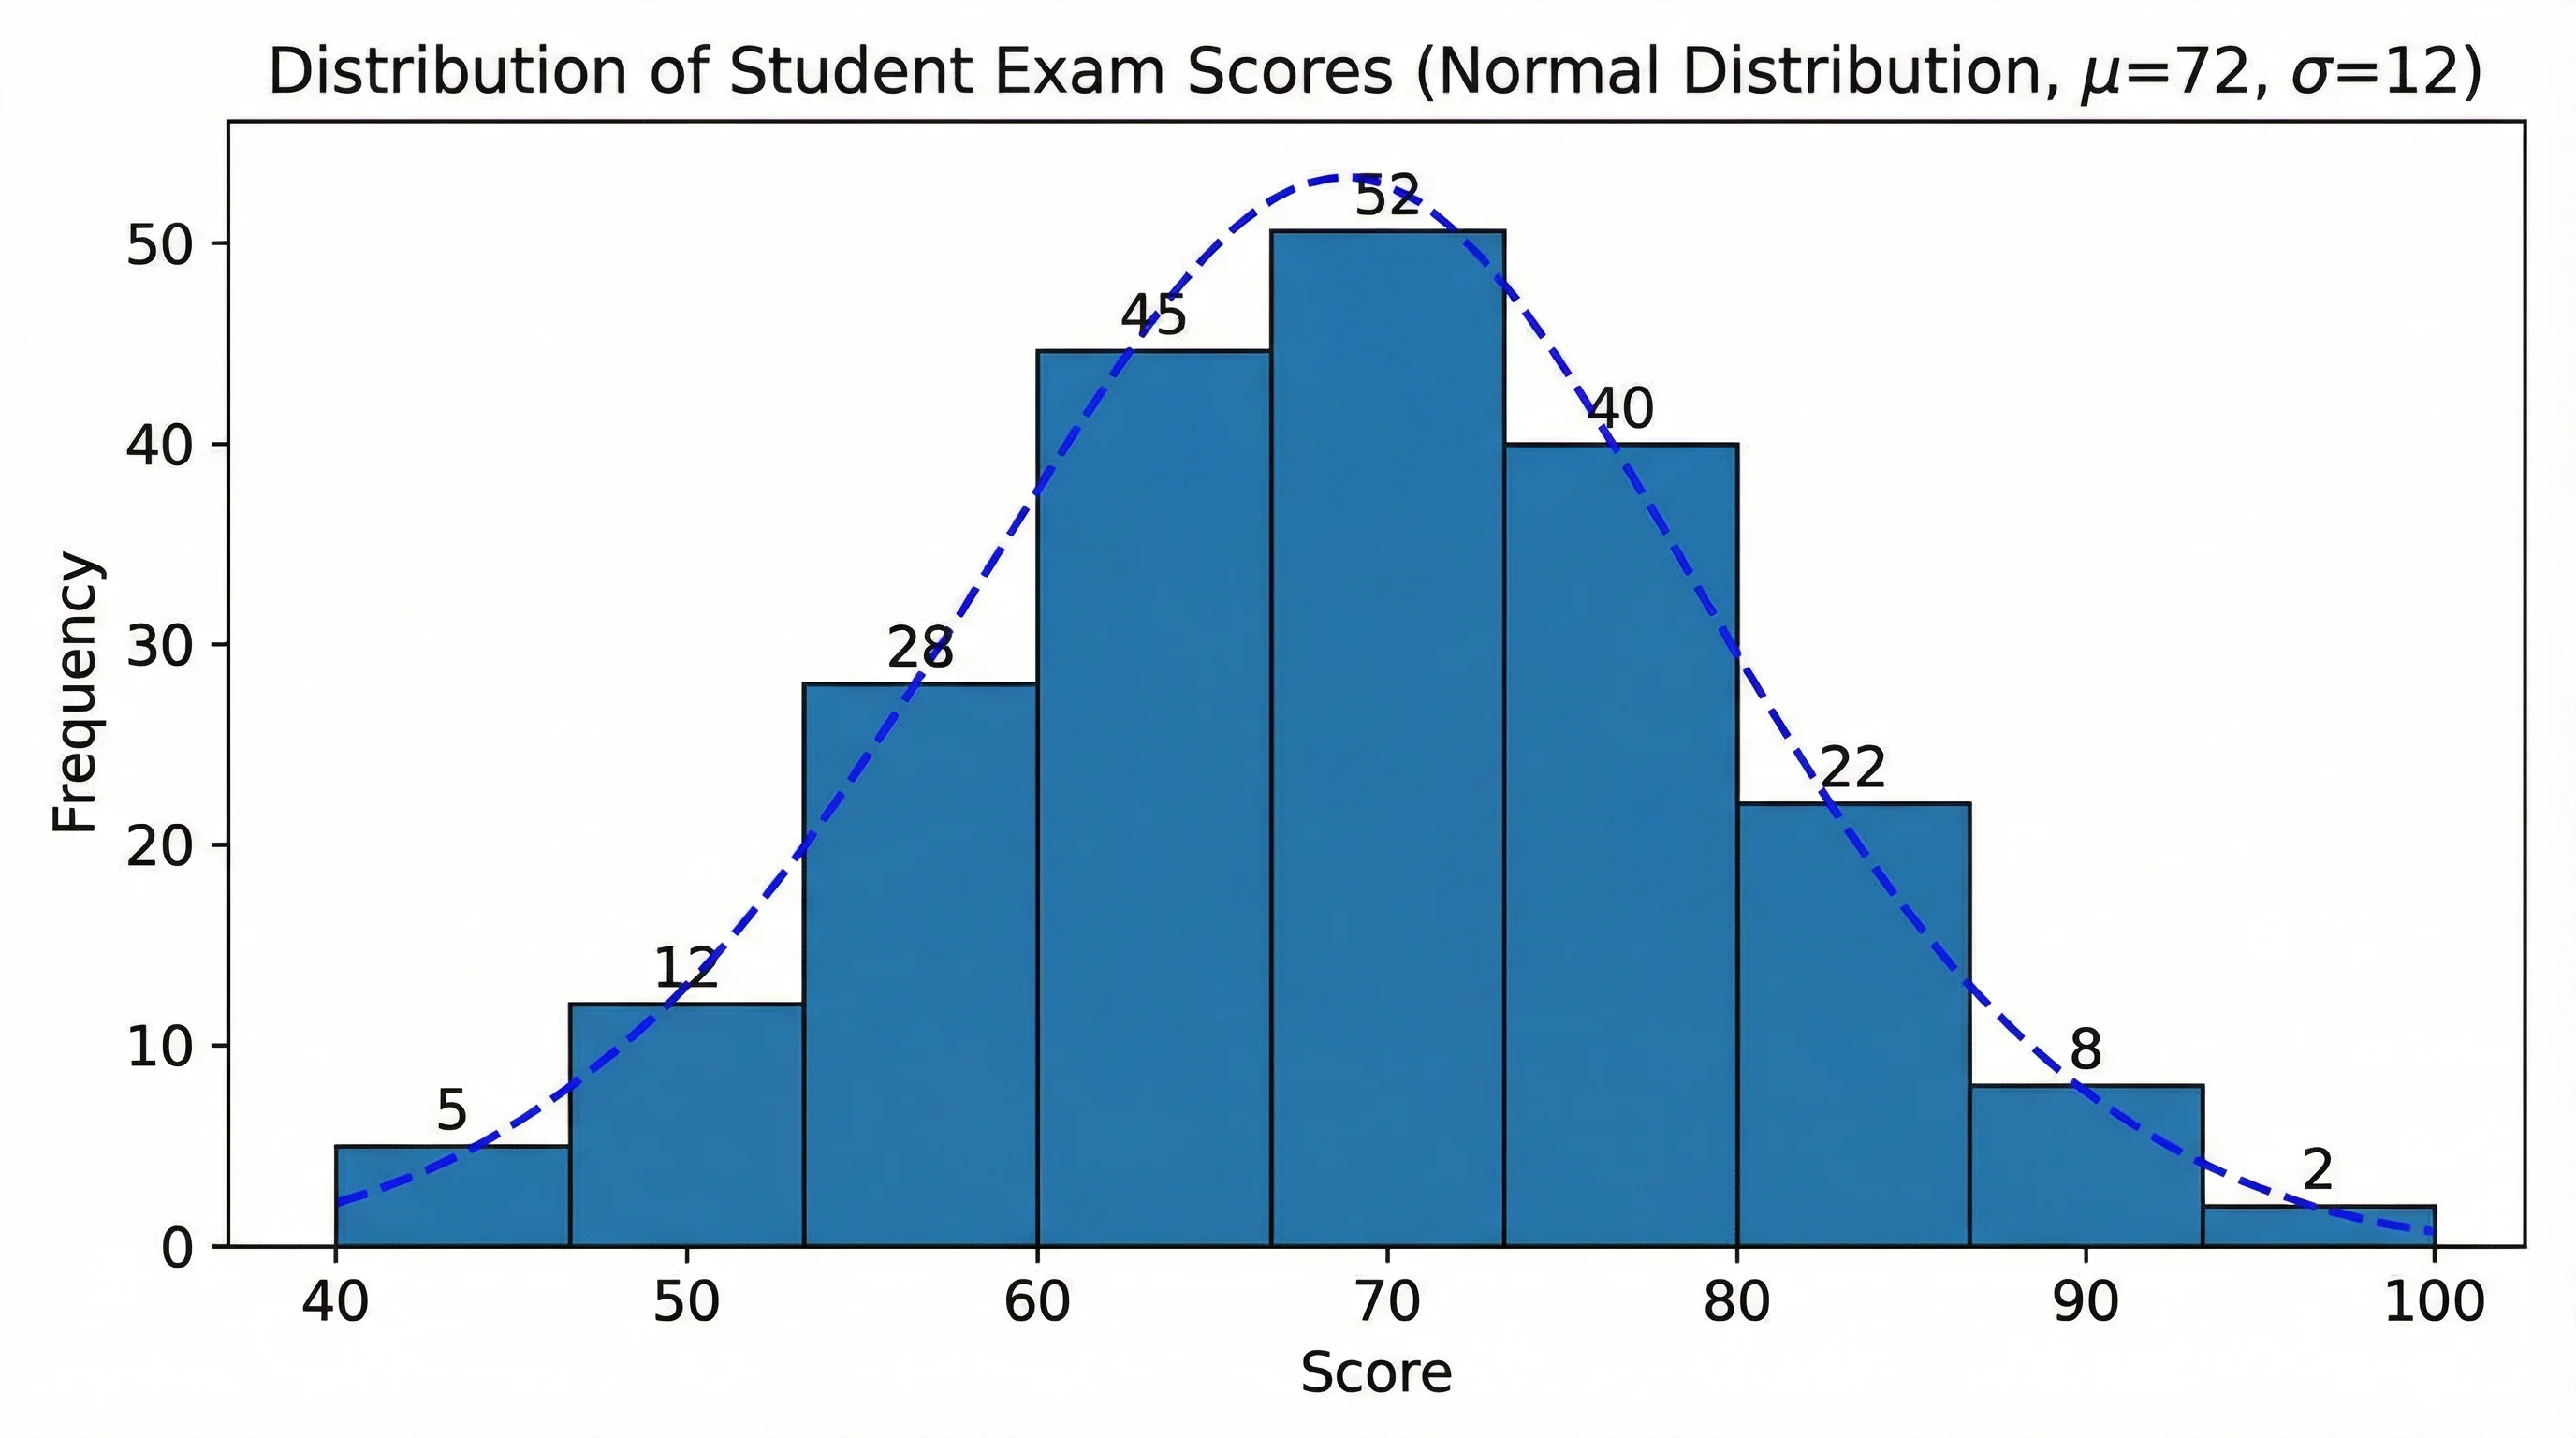
Example: Student Exam Scores
Suppose you have 80 exam scores in Google Sheets.
Start with the built-in histogram:
- Select the score column.
- Insert a histogram chart.
- Check the default bucket size.
- Try bucket sizes of
5and10. - Pick the version that best shows the distribution.
If the class is graded on a 10-point scale, a bucket size of 10 may be easiest for students and teachers to understand. If you are analyzing performance in more detail, a bucket size of 5 may reveal clusters around pass/fail thresholds or high-scoring groups.
For a formal report, you might write:
Figure 1 shows the distribution of final exam scores using 10-point bins. Most scores fall between 70 and 89, with a smaller left tail below 60.That caption helps the reader interpret the chart instead of merely seeing it.
When Google Sheets Is Not Enough
Google Sheets is excellent for fast classroom and lightweight analysis. It is less ideal when you need:
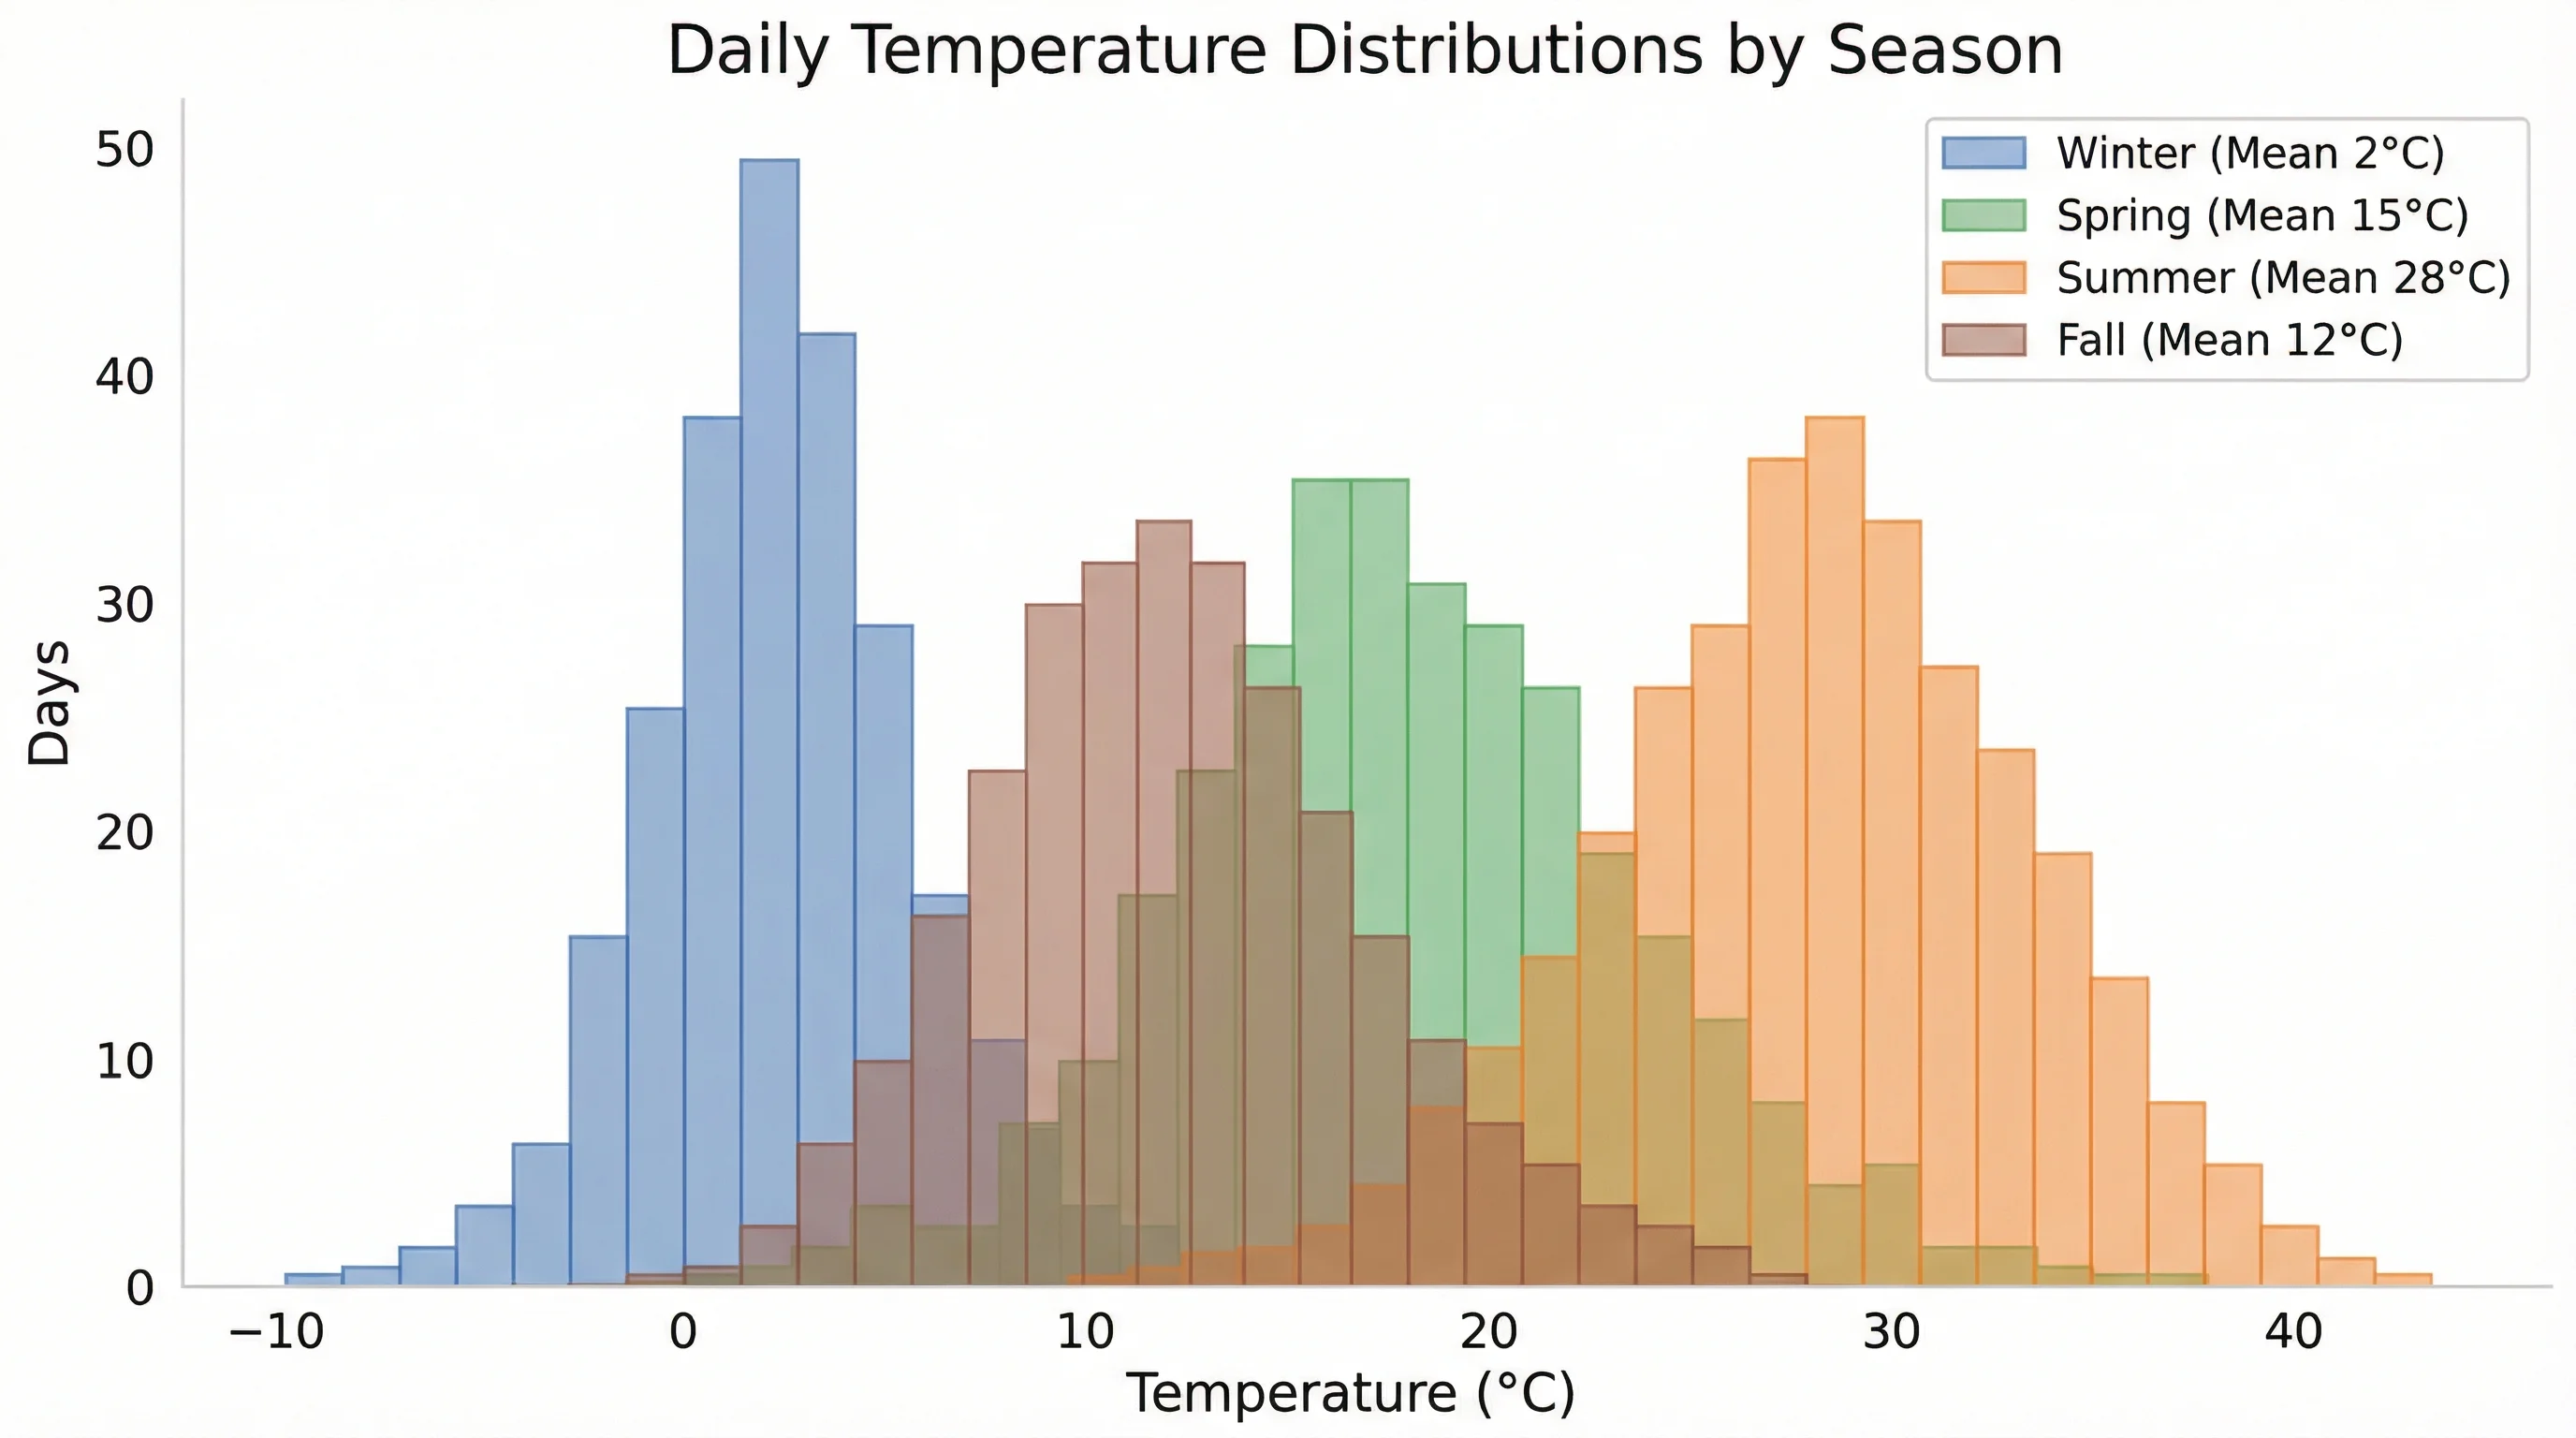
- multiple grouped histograms
- publication-grade typography
- exact annotation placement
- combined mean or threshold lines
- journal-style export quality
- consistent design across many figures
In those cases, use Sheets for data preparation and a dedicated visualization tool for the final figure. ConceptViz's Histogram Maker is useful when you want a clean visual draft quickly, while our Excel histogram guide is better if your workflow is Microsoft-based.
Conclusion
Making a histogram in Google Sheets is straightforward: select one numeric column, insert a chart, choose Histogram chart, and adjust Bucket size until the distribution is readable. The part that requires judgment is not clicking the menu. It is choosing bins that match your data and your audience.
Use the built-in histogram for raw data and quick analysis. Use FREQUENCY or a manual table when you need exact intervals. Always label the axes clearly, keep color simple, and make sure the chart explains the distribution rather than just decorating the spreadsheet.
FAQ
Can Google Sheets make a histogram?
Yes. Select a column of numeric data, click Insert > Chart, and choose Histogram chart in the Chart editor. Google Sheets will group the values into bins automatically.
How do I change histogram bins in Google Sheets?
Double-click the chart, open Customize > Histogram, and change Bucket size. A larger bucket size creates fewer wider bins, while a smaller bucket size creates more narrower bins.
Why does Google Sheets call bins buckets?
Google Sheets uses the term Bucket size for the interval width in a histogram. In practice, bucket and bin refer to the same idea: a numeric range that groups values.
Can I make a histogram from a frequency table in Google Sheets?
The built-in histogram chart works best with raw data. If you already have bin labels and counts, use a column chart or create a frequency table with the FREQUENCY function and chart the result.
What is the difference between a histogram and a bar chart in Google Sheets?
A histogram groups continuous numeric values into ranges and shows frequency. A bar chart compares separate categories such as products, departments, or survey options.
What bucket size should I use for a histogram?
Use a bucket size that reveals the distribution without creating too much noise. Round, meaningful intervals such as 5, 10, 25, or 100 are often easier for readers to understand.
Why does my Google Sheets histogram look wrong?
Common causes include selecting non-numeric data, including blank cells, using summarized counts instead of raw values, or relying on an automatic bucket size that does not fit the dataset.
Can I add an average line to a Google Sheets histogram?
Google Sheets does not provide a simple built-in average-line option for histograms. You can add a helper series or annotation, but many reports are clearer if the mean is stated in a caption or summary table.
カテゴリー
もっと読む

What Is a Dot Plot? Statistics Examples and How to Make One
A dot plot shows the frequency of data with stacked dots over a number line. Learn how to make and read dot plots, find mean, median, mode, and range, with examples.
")
5 Best Free BioRender Alternatives in 2026 (For Science Illustrations)
Free BioRender alternatives for science illustrations. Compare Canva, ConceptViz AI, draw.io + Bioicons, Mind the Graph & more. No $420/year subscription needed.

How to Design an Award-Winning Scientific Poster: Complete Guide
Master the art of scientific poster design with proven strategies used by award winners. Learn layout principles, visual hierarchy, and presentation tips.