")
8 Best Free Visme Alternatives in 2026 (No Watermark)
Best free Visme alternatives: Canva, ConceptViz, Piktochart, Google Slides, Design.com & more. Create infographics and presentations without watermarks or subscriptions.
8 Best Free Visme Alternatives in 2026 (No Watermark)
Visme is a popular visual content creation platform used by marketers, educators, and businesses to create infographics, presentations, and interactive content. But at $12.25/month for the Starter plan or $24.75/month for Pro, many users find the pricing hard to justify — especially when the free plan has significant limitations like watermarks and low-resolution exports.
In this guide, we'll compare the 8 best free Visme alternatives for creating infographics, presentations, diagrams, and visual content without watermarks or expensive subscriptions.
AI Infographic Generator
Create stunning infographics with AI. No watermarks, no design skills needed.
Try it freeWhy You Need Visme Alternatives
Before diving into alternatives, let's understand why Visme might not be the best fit for everyone:
| Issue | Details |
|---|---|
| Pricing | Starter $12.25/month, Pro $24.75/month |
| Free Plan Limits | Limited templates, low-resolution exports, Visme watermark |
| Export Restrictions | Free plan cannot download high-quality PNG/PDF |
| Storage | Free plan has limited storage |
| Education Discount | Requires .edu email, still $3/month minimum |
According to Piktochart's comparison, many users find Visme's free plan too restrictive because downloads begin only on paid plans.
Quick Comparison: Top 8 Free Visme Alternatives
| Tool | Price | Best For | Ease of Use |
|---|---|---|---|
| Canva for Education | Free | All-around design needs | Very Easy |
| ConceptViz | Free tier + paid | AI-generated science diagrams | Very Easy |
| Piktochart | Free tier + paid | Data-driven infographics | Easy |
| Google Slides | Free | Presentations & collaboration | Very Easy |
| Design.com | Free tier available | AI presentation creation | Easy |
| Adobe Express | Free tier | AI-powered design | Easy |
| Venngage | Free tier | Infographic templates | Easy |
| Infogram | Free tier | Charts & data visualization | Moderate |
1. Canva — Best Free All-Around Option
Price: Free tier + Pro from $12.99/month (Free for verified educators)
Canva is arguably the best free Visme alternative. The free tier offers extensive templates and features, and verified educators get full access to all Canva Pro features at no cost.
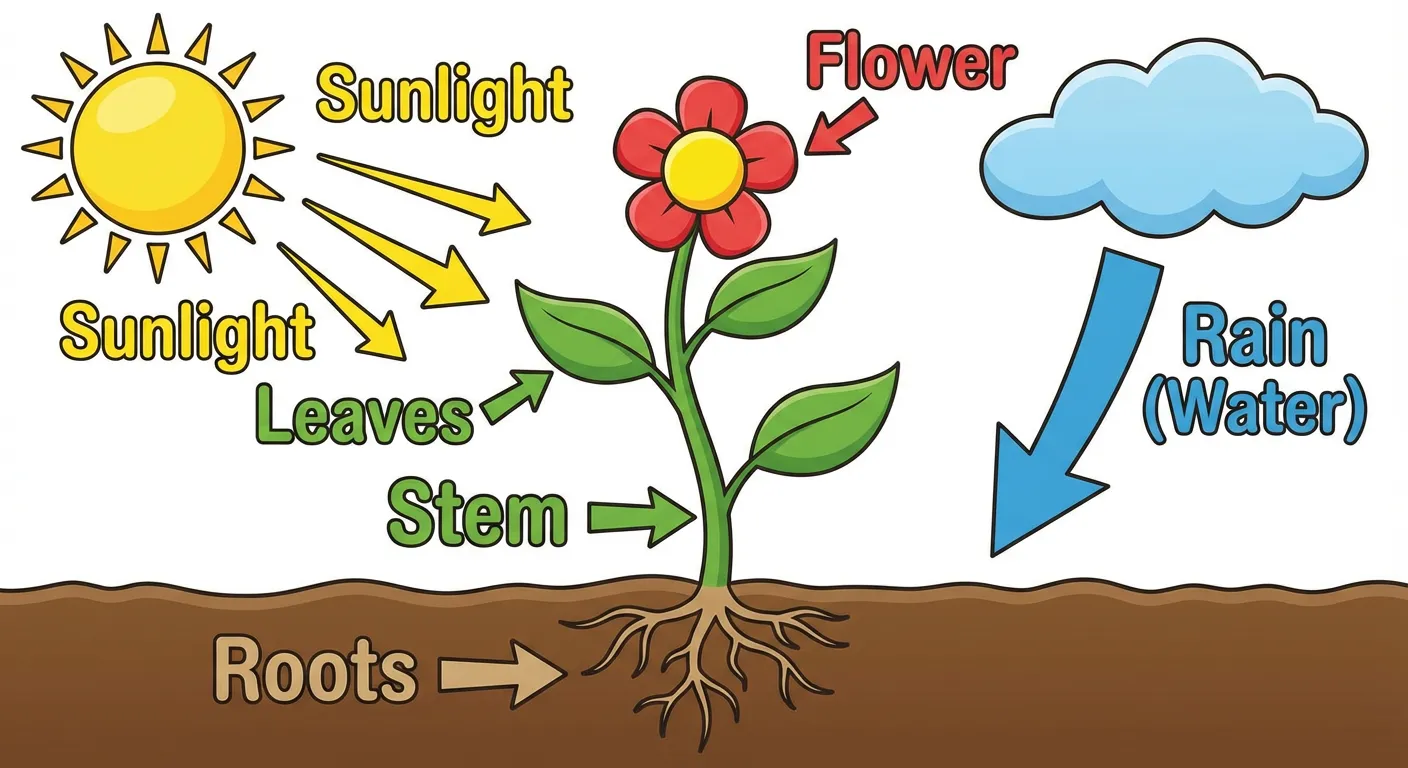 Visual learning materials like this plant diagram can enhance your science lessons.
What You Get:
- 100,000+ educational templates — including infographics, presentations, posters, and worksheets
- Full export capabilities — high-resolution PNG, PDF, and even video on the free education plan
- LMS integration — works with Google Classroom, Canvas, Schoology, and more
- Real-time collaboration — students and teachers can work together
- Brand Kit — maintain consistent school colors and fonts
- Magic Write AI — AI-powered text generation
Key Advantages Over Visme:
According to SkyWork's comparison:
- Canva free tier has no watermarks on exports
- Better export options on free tier
- More extensive template library (100,000+)
- Stronger integrations with productivity tools
Best For:
- Anyone who needs versatile design tools
- Creating presentations, posters, and infographics
- Collaborative team projects
- Those who want everything in one platform
Limitations:
- Less advanced animation features than Visme
- Data visualization tools not as powerful
- Science-specific templates are limited
Verdict: If you want a versatile Visme replacement with extensive free features, Canva is the best choice for most users.
2. ConceptViz — Best for AI-Generated Diagrams
Price: Free tier (3 credits) + Paid plans from $9.90/month
ConceptViz takes a unique approach: instead of manually designing from templates, you describe what you need in plain English, and AI generates a professional diagram instantly.
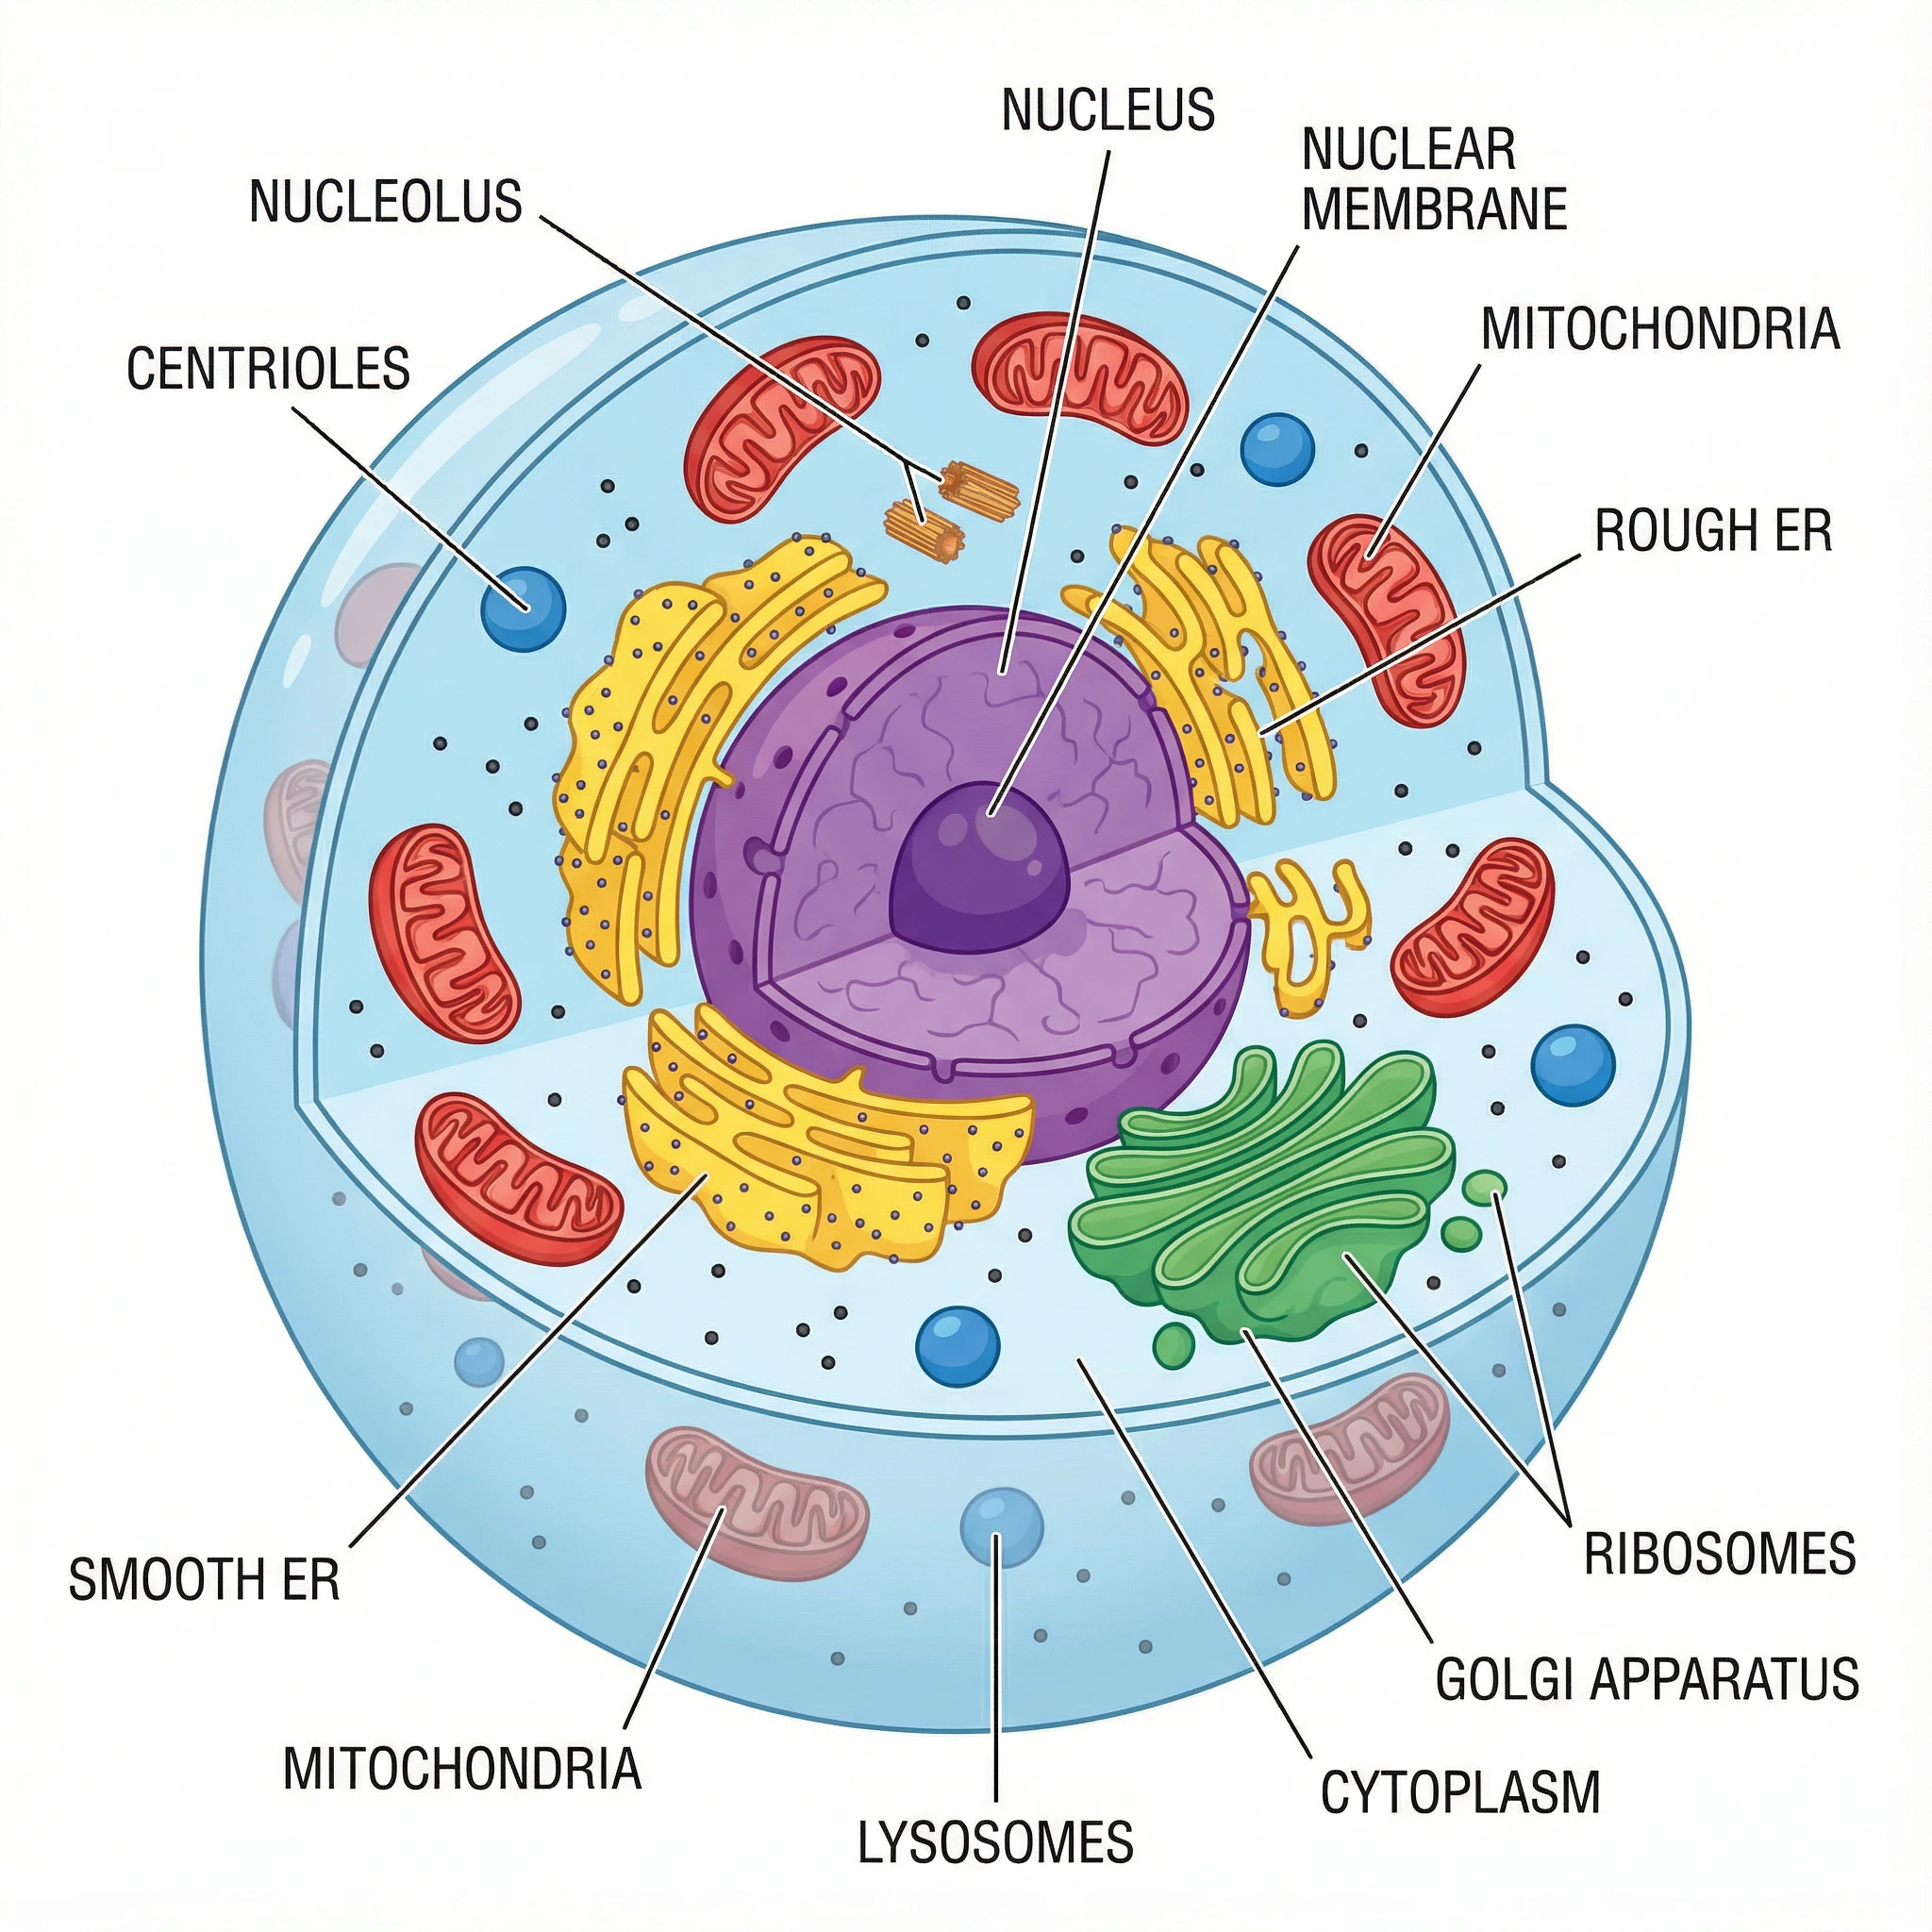 AI-generated animal cell diagram — created in seconds with ConceptViz.
What Makes It Unique:
- AI-powered generation — describe your diagram, get results in seconds
- No design skills needed — just describe what you want
- Ready-to-use outputs — generates both labeled and unlabeled versions
- High-resolution exports — up to 4K quality, no watermarks
- Specialized diagram tools:
Example Use Cases:
- Generate a labeled photosynthesis diagram for a presentation
- Create an unlabeled water cycle diagram for educational materials
- Make a food chain poster with custom complexity levels
- Produce black-and-white diagrams for printing
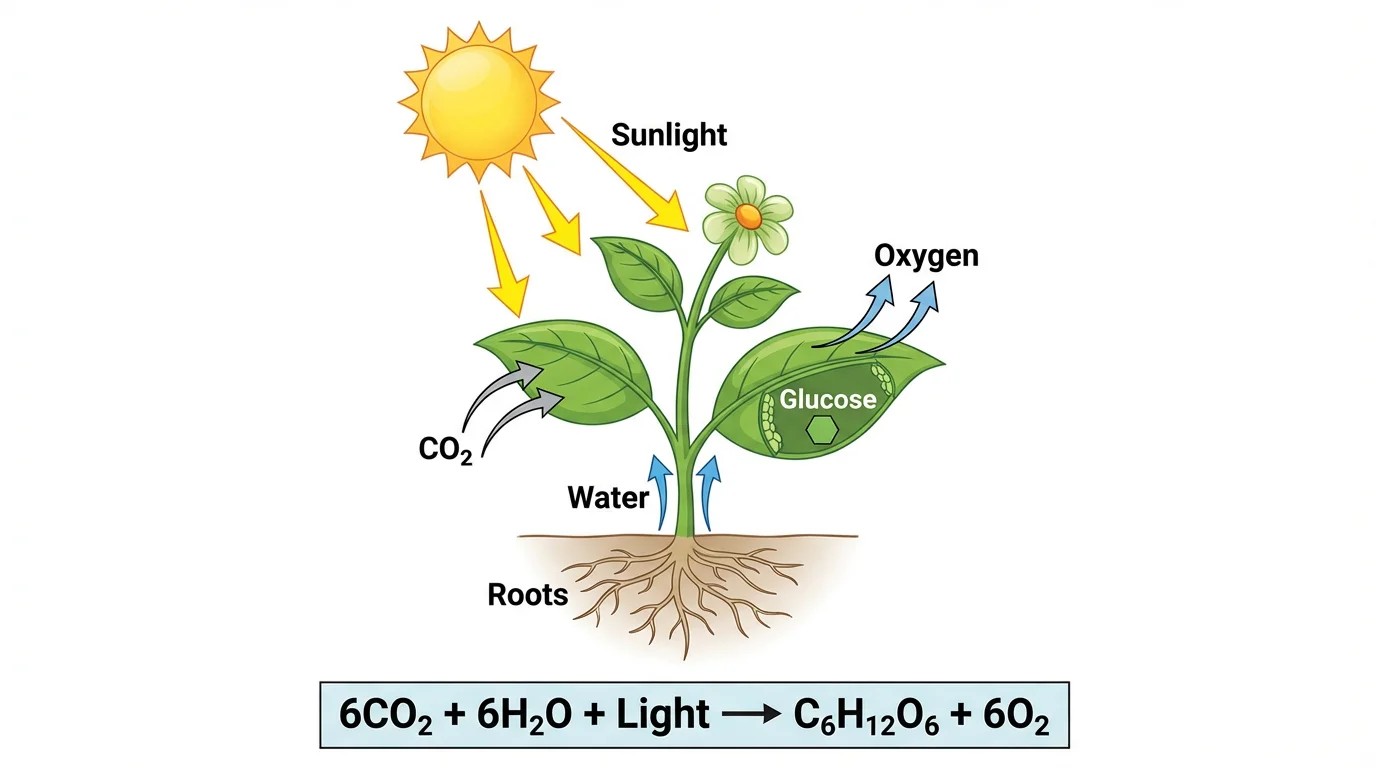 Photosynthesis diagram — perfect for explaining the process to students.
Best For:
- Anyone who needs scientific diagrams regularly
- Creating multiple variations quickly (labeled, unlabeled, different styles)
- Busy professionals who need materials fast
- Those without design skills
Limitations:
- Focused on scientific diagrams rather than general infographics
- AI-generated content should be reviewed for accuracy
- Free tier has limited generations
Verdict: If you need professional diagrams without design skills, ConceptViz is a game-changer.
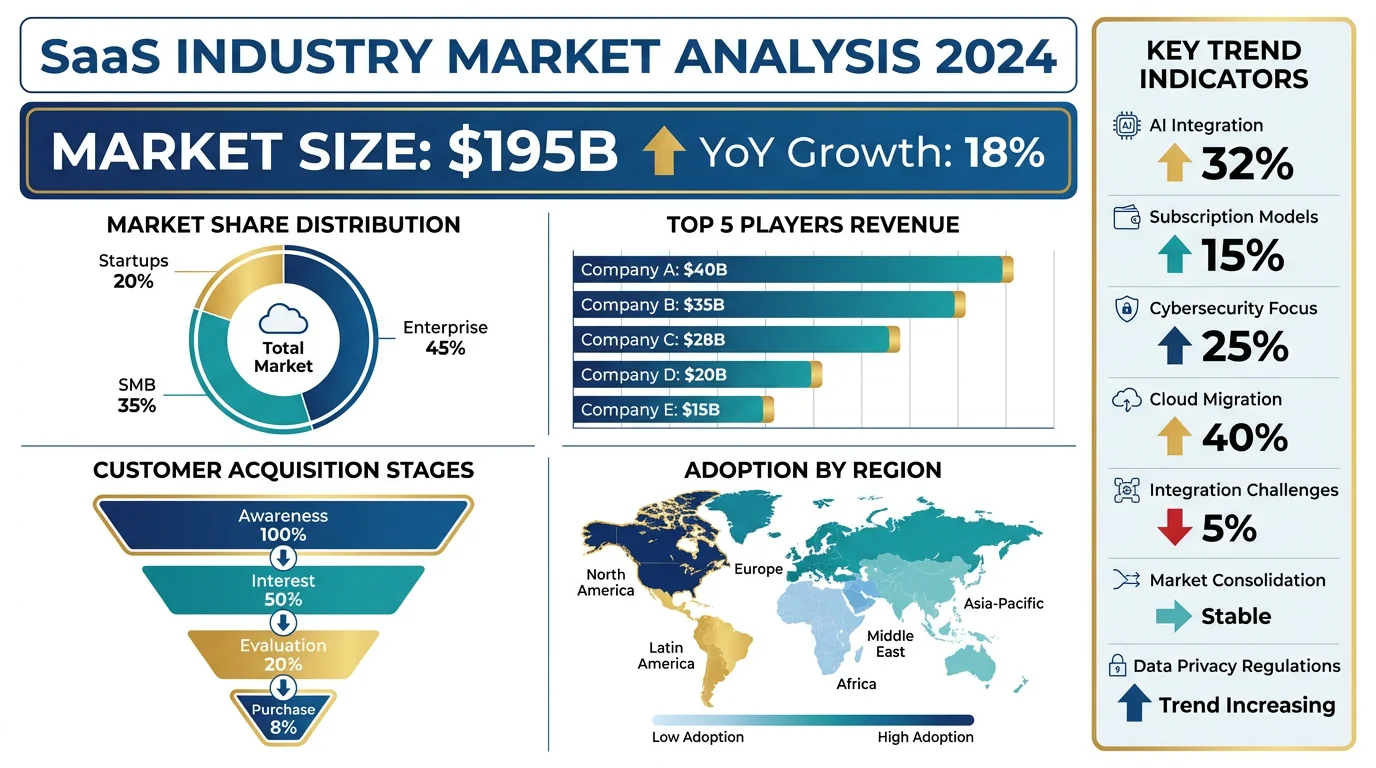
3. Piktochart — Best for Data-Driven Infographics
Price: Free tier (watermark) + Paid from $14/month
Piktochart is specifically designed for creating infographics, making it a strong Visme competitor. They offer 600+ templates and robust data visualization features.
What You Get:
- 2,000+ templates — infographics, presentations, reports, posters
- Design Components — pre-built sections like headers, timelines, comparisons
- Data visualization — charts, graphs, and maps
- Easy drag-and-drop interface — no design experience needed
- Team collaboration — work together in real-time
Key Advantages Over Visme:
According to Piktochart's blog:
- More focused on infographics (Visme tries to do everything)
- Simpler interface for non-designers
- Better pre-built layout sections
- Cleaner data visualization
Best For:
- Creating data-driven infographics
- Marketers who present statistics and research
- Visual reports and newsletters
- Those who want infographic-specific tools
Limitations:
- Free plan includes watermark
- Less versatile than Canva
- Fewer animation features than Visme
Verdict: If infographics are your main need, Piktochart is more focused and easier to use than Visme.
4. Google Slides — Best Free Presentation Tool
Price: 100% Free
Google Slides is the most accessible option for teachers already using Google Workspace. While it's primarily a presentation tool, it can also create simple infographics and diagrams.
 Science diagrams can enhance any Google Slides presentation.
What You Get:
- Completely free — no premium tiers or limits
- Real-time collaboration — built-in Google Workspace integration
- Gemini AI — AI assistance for drafting and content generation
- Chromebook compatible — perfect for school devices
- Version history — track all changes
- Easy sharing — link sharing and permissions
Best For:
- Teams already using Google Workspace
- Collaborative presentations
- Anyone who needs simple, reliable tools
- Chromebook users
Limitations:
- Limited infographic templates
- No advanced data visualization
- Less visually polished than Visme or Canva
- Not designed for infographics
Verdict: If you're in the Google ecosystem and need basic presentations, Google Slides is free and works great for collaboration.
5. Design.com — Best for AI Presentation Creation
Price: Free tier available
Design.com's Presentation maker uses AI to turn a simple text description into a fully designed slide deck in seconds. With thousands of templates and a drag-and-drop editor, you can quickly customize fonts, colors, layouts, and add shapes or gradient effects to match your brand.
What You Get:
- AI presentation generation — describe your topic and get a complete slide deck instantly
- Thousands of templates — wide variety of themes and designs for different industries
- Full customization — fonts, colors, layouts, shapes, curved text, and gradients
- Flexible exports — download as PowerPoint, Google Slides, PNG, JPG, SVG, EPS, or PDF
- Part of a design ecosystem — access logo, social media, and print design tools in one platform
Best For:
- Business professionals who need branded presentations fast
- Entrepreneurs and small business owners
- Anyone who wants AI to handle the slide design work
- Those who need to export in multiple formats (especially PowerPoint and Google Slides)
Limitations:
- Primarily focused on business presentations rather than educational content
- Less established than Canva or Google Slides
- Advanced features may require a paid plan
Verdict: A solid choice if you need AI-powered presentation creation with flexible export options, especially for business use cases.
6. Adobe Express — Best for AI-Powered Design
Price: Free tier + Premium from $9.99/month
Adobe Express (formerly Adobe Spark) combines Adobe's design expertise with AI capabilities. It offers a generous free tier with access to Adobe Firefly AI.
What You Get:
- Adobe Firefly AI — generate images and text effects with AI
- Remove background — one-click background removal
- Adobe fonts — access to professional typography
- Brand Kit — maintain consistent design
- Templates — presentations, flyers, social media, and more
- Easy sharing — Social media, email, and direct links
Key Advantages:
According to SkyWork's analysis:
- Firefly AI is industry-leading for image generation
- Adobe Express offers commercially safe AI-generated content
- Better integration with other Adobe tools
Best For:
- Anyone who wants AI-powered design features
- Teams already using Adobe products
- Creating social media content
- Those who need professional typography
Limitations:
- Free plan has limited AI credits
- Fewer templates than Canva
- Learning curve if unfamiliar with Adobe
Verdict: Great choice for educators who want cutting-edge AI features and are familiar with Adobe tools.
7. Venngage — Best for Infographic Templates
Price: Free tier (watermark, no download) + Paid from $10/month
Venngage was built specifically for infographics and has one of the largest template libraries for this format.
What You Get:
- 7,500+ infographic templates — the largest selection
- Drag-and-drop editor — simple interface
- Icon library — thousands of icons included
- Chart maker — built-in data visualization
- Wide variety — business, marketing, educational templates
Best For:
- Anyone who creates lots of infographics
- Visual data presentation
- Those who want infographic-specific tools
Limitations:
- Free plan cannot download — only shareable links
- Watermark on free plan
- Less versatile than all-in-one tools
Verdict: Best template selection for infographics, but the free plan's download limitation is significant.
8. Infogram — Best for Data Visualization
Price: Free tier + Paid from $19/month
Infogram specializes in data visualization with a focus on charts, dashboards, and interactive content.
What You Get:
- 35+ chart types — more than most competitors
- Interactive elements — animated charts and maps
- Dashboard creation — combine multiple visualizations
- Real-time data — connect to spreadsheets
- Embed anywhere — share interactive content
Best For:
- Professionals who work with lots of data
- Creating interactive presentations
- Analysts and researchers
- Data-driven reports
Limitations:
- Steeper learning curve
- More expensive than alternatives
- Less template variety for non-data content
Verdict: The best choice if data visualization is your primary need, but overkill for simple infographics.
Free Icon Libraries for DIY Infographics
If you prefer building infographics in PowerPoint or Google Slides, these free resources provide professional elements:
Flaticon
- 16 million+ icons in multiple styles
- Free with attribution
- Visit Flaticon
Unsplash
- High-quality free photos for backgrounds
- No attribution required
- Visit Unsplash
Bioicons
- 2,700+ science icons in SVG format
- Perfect for biology infographics
- Visit Bioicons
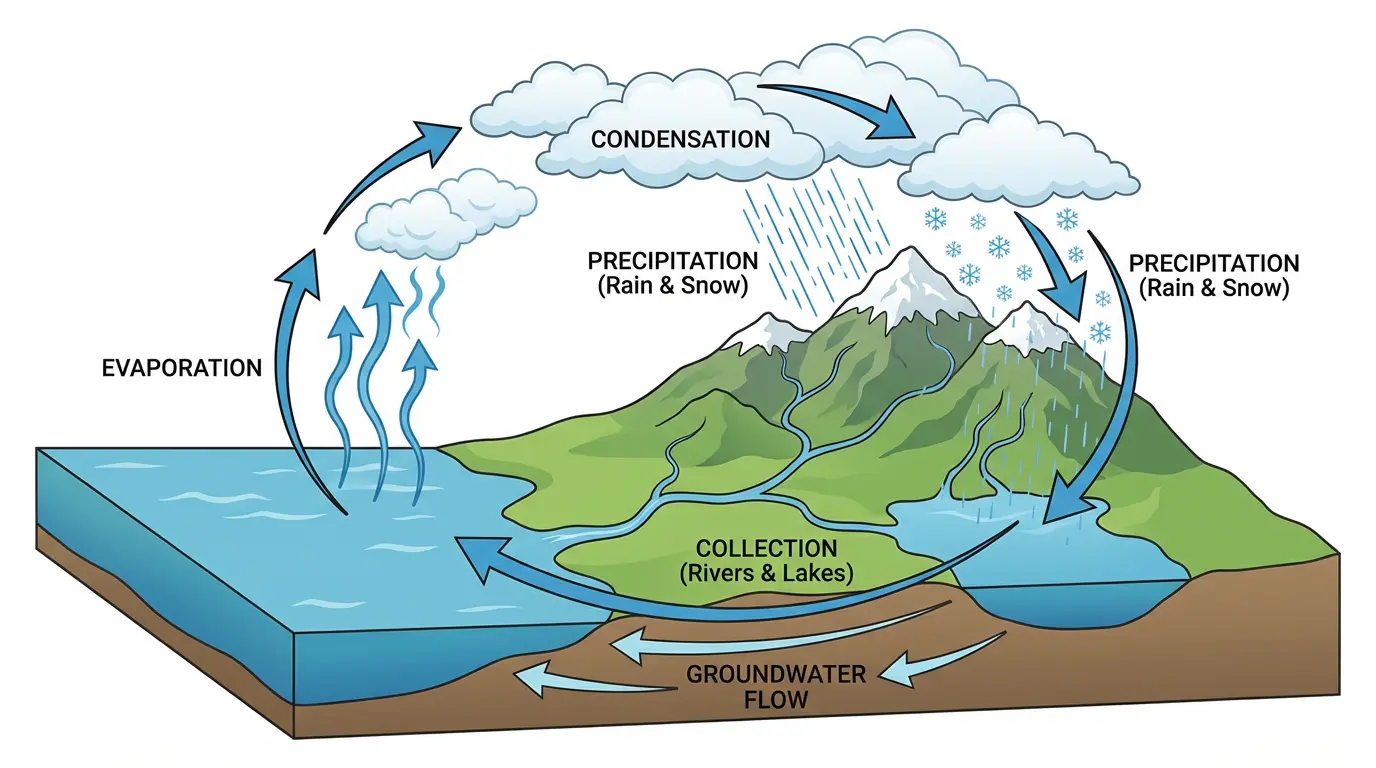 Science diagrams like this water cycle can make your infographics more educational.
Which Tool Should You Choose?
Here's a quick decision guide:
Choose Canva if:
- You want a generous free tier with full-featured design tools
- You need versatile templates for many purposes
- Team collaboration is important
- You want the most templates and features
Choose ConceptViz if:
- You primarily need scientific diagrams
- You need labeled and unlabeled diagram versions
- You want AI to do the design work
- You need diagrams quickly without design skills
Choose Piktochart if:
- Infographics are your main focus
- You prefer a simpler, more focused tool
- You work with data and statistics
- Pre-built layout sections appeal to you
Choose Google Slides if:
- You're already in the Google ecosystem
- Collaboration is your top priority
- You need the simplest possible solution
- Budget is the primary concern
Choose Design.com if:
- You need AI-generated presentations quickly
- You want to export as PowerPoint or Google Slides
- You're a business professional or entrepreneur
- You value having multiple design tools in one platform
Choose Adobe Express if:
- You want AI image generation features
- You use other Adobe products
- Professional typography matters
- You're familiar with Adobe tools
Choose Venngage if:
- You need the most infographic templates
- Template variety is more important than download freedom
- You can work with shareable links instead of downloads
Choose Infogram if:
- Data visualization is your primary need
- You create interactive dashboards
- Real-time data connections matter
Visme vs Alternatives: Feature Comparison
| Feature | Visme (Free) | Canva | ConceptViz | Design.com | Piktochart |
|---|---|---|---|---|---|
| Templates | Limited | 100,000+ | AI Generated | Thousands | 600+ |
| Export Quality | Low-res | High-res | Up to 4K | High-res | Watermarked |
| AI Features | Limited | Magic Write | Full AI Generation | AI Slide Generation | Basic |
| Watermark-Free | No | Yes | Yes | Yes | Paid only |
| Collaboration | Limited | Full | N/A | N/A | Full |
| Price | $12.25/mo | Free tier | Free tier | Free tier | $14/mo |
Conclusion
You don't need to pay $12-25/month for Visme to create professional infographics and presentations. Whether you choose Canva's comprehensive free platform, ConceptViz's AI-powered diagrams, Design.com's AI presentations, or Piktochart's infographic focus, there are excellent free alternatives for every need.
Our top recommendations:
- Best free all-around: Canva
- Best for AI diagrams: ConceptViz
- Best for infographics: Piktochart
- Best for collaboration: Google Slides
- Best for AI presentations: Design.com
- Best for AI design: Adobe Express
Ready to create your first diagram? Try ConceptViz's free AI infographic generator — describe what you need, and AI creates it for you.
 Mitosis phases diagram — perfect for cell division lessons.
FAQ
Is Visme free?
Visme offers a free plan, but it has significant limitations: watermarks on exports, low-resolution downloads, and limited templates. The paid plans start at $12.25/month. For a truly free option without watermarks, Canva and ConceptViz are better choices.
What's the best free alternative to Visme?
Canva is the best completely free Visme alternative for most users. It offers extensive templates, high-resolution exports without watermarks, and real-time collaboration. For AI-generated diagrams, ConceptViz offers instant creation from text descriptions.
Can I create infographics without design skills?
Yes! Canva, Piktochart, and Venngage all offer drag-and-drop interfaces with pre-made templates. ConceptViz goes even further — just describe what you need in plain English, and AI creates it for you.
Which tool has the best templates?
Canva has the largest overall template library (100,000+). Venngage has the most infographic-specific templates (7,500+). For custom diagrams, ConceptViz generates unique diagrams based on your text descriptions.
Do these tools work on Chromebooks?
Yes! Canva, ConceptViz, Piktochart, Google Slides, Design.com, Adobe Express, Venngage, and Infogram all work in web browsers and are fully compatible with Chromebooks.
Can teams collaborate on projects?
Yes. Canva, Google Slides, Piktochart, and Infogram all support real-time collaboration. ConceptViz focuses on individual diagram generation rather than collaboration.
Which tool is best for data visualization?
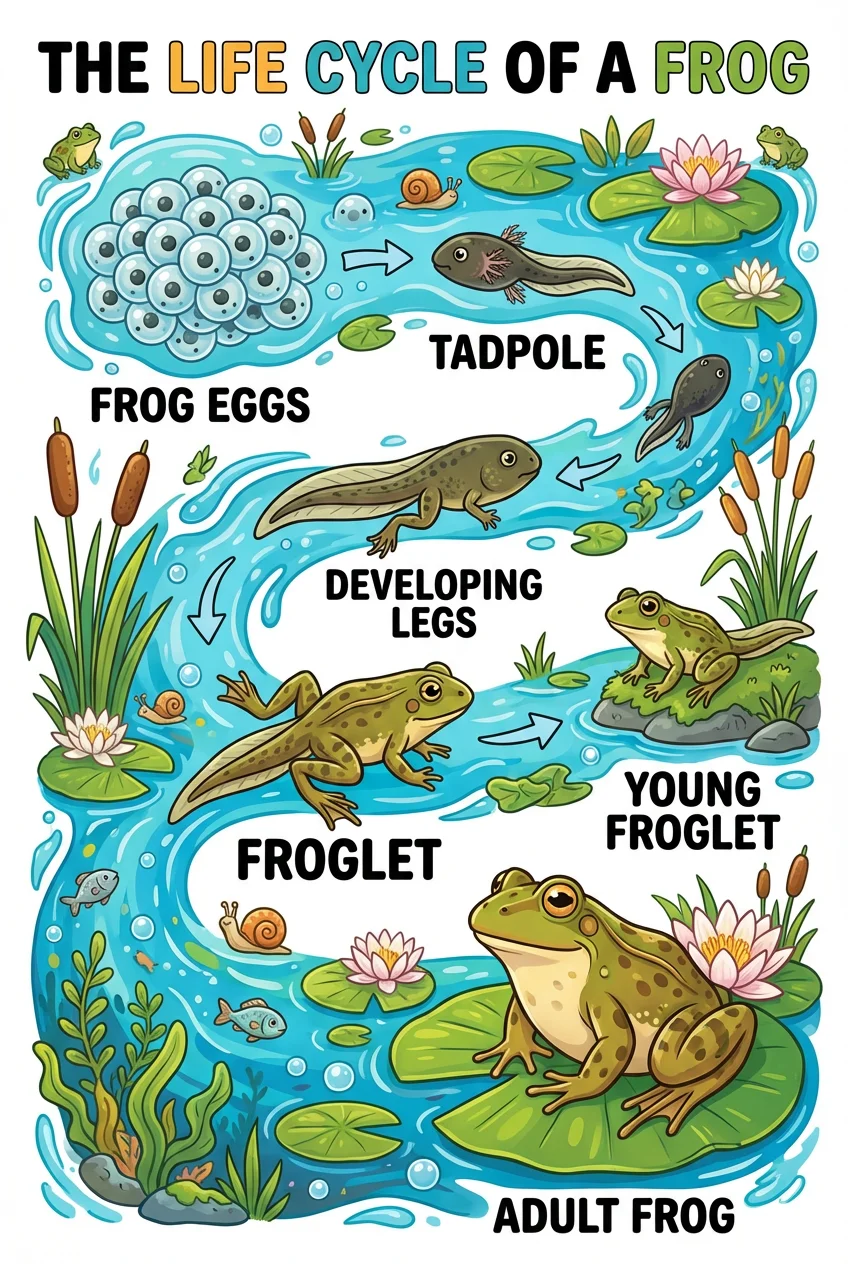
Infogram is the best for data visualization with 35+ chart types and interactive features. Piktochart is also strong for data-driven infographics. For scientific visualizations, ConceptViz can generate diagrams like food chains and life cycles with AI.
Categories
More Posts
")
Free Printable Cell Diagram Worksheets: Unlabeled & Labeled (2026)
Download free printable cell diagram worksheets. Includes unlabeled plant cell, animal cell, and comparison diagrams for classroom quizzes and study guides.
")
How to Create a Scatter Plot Diagram: Complete Guide for Researchers & Students (2026)
Learn how to draw a scatter diagram in Excel, Python, R, and with AI tools. Step-by-step scatter plot guide with best practices, examples, and common mistakes to avoid.
")
Free Printable Life Cycle Worksheets for Teachers (2026)
Download free printable life cycle worksheets for plants, butterflies, frogs, and chickens. Includes labeled diagrams, blank worksheets for quizzes, and hands-on activities aligned with NGSS standards.