Food Chain Diagram Maker for Food Chains & Food Webs
Make a food chain or food web diagram in seconds. Show producers, consumers, and decomposers across trophic levels, with arrows pointing the way energy flows — labeled for study or blank for worksheets. Describe any ocean, forest, grassland, or desert ecosystem and download it free.
Food Chain Diagram Generator
Free to try ·
Your food chain diagram will appear here
AI-generated illustration — review the organisms, levels, and arrow directions for accuracy
Food Chain & Food Web Examples
Labeled and blank diagrams across ocean, forest, grassland, and pond ecosystems
Labeled Grassland Food Chain
A classic linear food chain — each organism labeled with its trophic level and arrows pointing toward the eater.
Blank Ocean Food Web
A blank version for worksheets — students label each organism and trace the feeding relationships themselves.
Forest Food Chain Poster
A bright classroom poster pairing a forest food chain with the 10% energy-transfer rule.
Pond Ecosystem Food Chain
A freshwater example — algae and plants are the producers, with a heron as the apex predator.
Complex Savanna Food Web
A full food web with crossing arrows — many chains interconnect, including scavengers and decomposers.
Energy Pyramid by Trophic Level
Why chains are short: only about 10% of energy passes up to the next trophic level.
What is a food chain?
A food chain is a simple, linear diagram that shows who eats whom in an ecosystem and how energy passes from one organism to the next. It starts with a producer — usually a plant or alga that makes its own food from sunlight — and moves up through the animals that eat it. Each link is connected by an arrow, and the chain shows a single path of energy through the ecosystem. This generator draws that path with each organism in order, labeled by its role, so the flow of energy is easy to follow.
Trophic levels: producers, consumers, and decomposers
- Producers: plants, algae, and some bacteria that make their own food through photosynthesis. They sit at the base of every food chain.
- Primary consumers: herbivores that eat producers — a grasshopper, a rabbit, or a zooplankton.
- Secondary consumers: carnivores or omnivores that eat the primary consumers, such as a frog or a small fish.
- Tertiary consumers: larger predators that eat secondary consumers — a snake, a tuna, or a hawk; the top one is often called the apex predator.
- Decomposers: fungi and bacteria that break down dead organisms and waste, returning nutrients to the soil so producers can grow again.
Energy flow and which way the arrows point
The single most-missed detail in a food chain is the direction of the arrows. Arrows always point from the organism being eaten toward the organism that eats it — in other words, they follow the energy. Grass → grasshopper means energy flows from the grass to the grasshopper, not the other way around. Energy enters the chain from the Sun, is captured by producers, and is passed upward; about 90% is lost as heat at each step, so only roughly 10% reaches the next level. That 10% rule is why food chains are usually only four or five links long. This tool draws the arrows in the correct, energy-following direction every time.
Food chain vs food web
A food chain shows one straight path of energy, while a food web links many overlapping food chains to show how an entire ecosystem is connected. In reality most animals eat more than one thing and are eaten by more than one predator, so a food web — with its branching, crossing arrows — is the more accurate picture. Use a food chain when you want to teach a single, clear sequence, and a food web when you want to show the bigger network of feeding relationships. You can make either one here: describe a single chain for a clean linear diagram, or describe an ecosystem to get an interconnected web.
Food chain examples by ecosystem
- Ocean / marine: phytoplankton → zooplankton → small fish → tuna → shark, with seals and seabirds branching off in a food web.
- Forest: oak tree → caterpillar → robin → fox, with fungi and insects as decomposers on the forest floor.
- Grassland: grass → grasshopper → frog → snake → hawk, a favorite for teaching the four trophic levels.
- Desert: cactus → kangaroo rat → snake → hawk, showing how even sparse ecosystems form complete chains.
- Pond / freshwater: algae → tadpole → small fish → bass → heron, a good bridge between aquatic and terrestrial examples.
Labeled diagrams for study, blank ones for worksheets
For revision and classroom display, ask for a labeled food chain so every organism is named and tagged with its trophic level. For practice and assessment, ask for a blank or unlabeled version with empty boxes or numbered lines, so students can identify the producers and consumers and add the arrows themselves. To make a diagram from a description, just write the ecosystem or the sequence you want — for example, "a grassland food chain from grass to hawk, labeled" — pick a labeled or blank style, and the generator builds it for you, ready to download as an image for a worksheet, slide, or poster.
Frequently Asked Questions
Related Biology Tools
 Biology
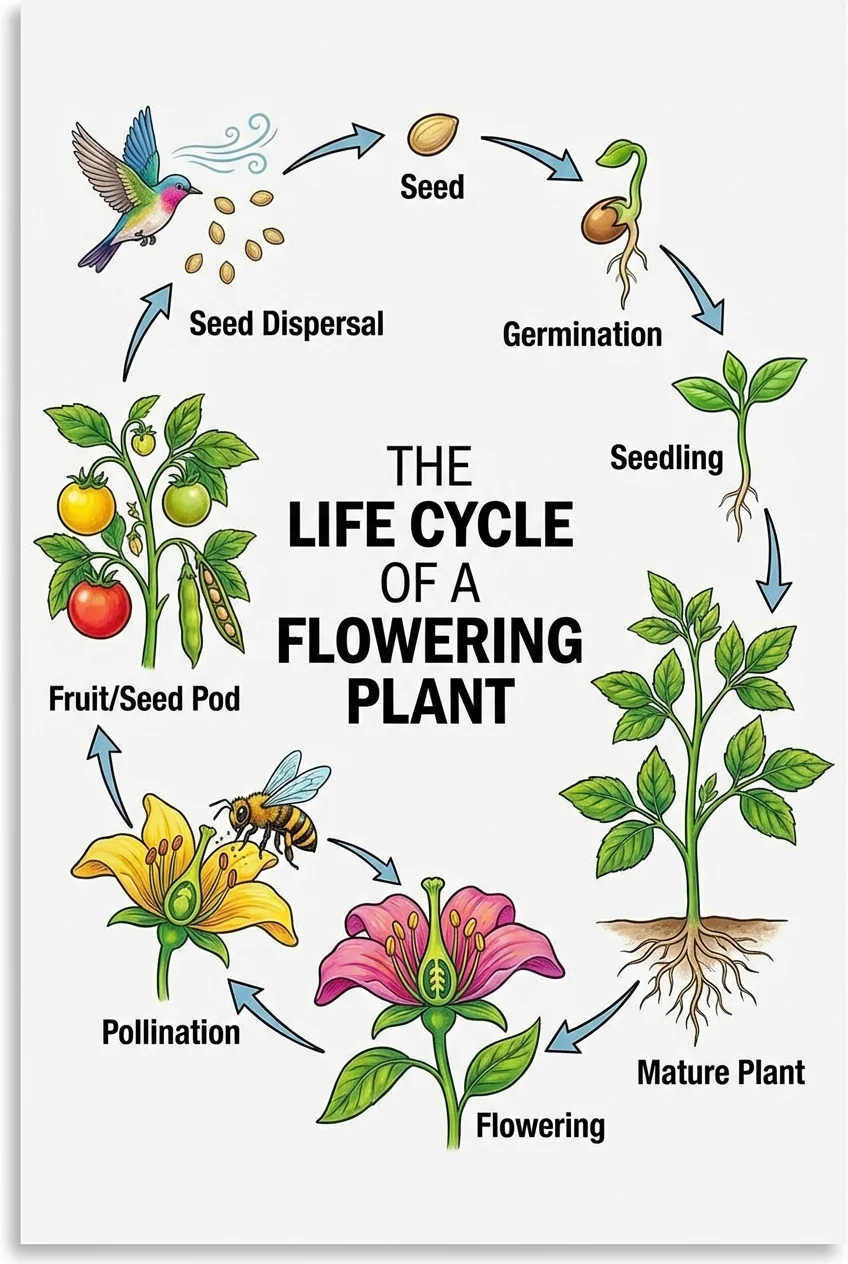
Life Cycle Diagram Generator
Draw labeled life cycles for plants, insects, and animals with stages and arrows.
 Biology
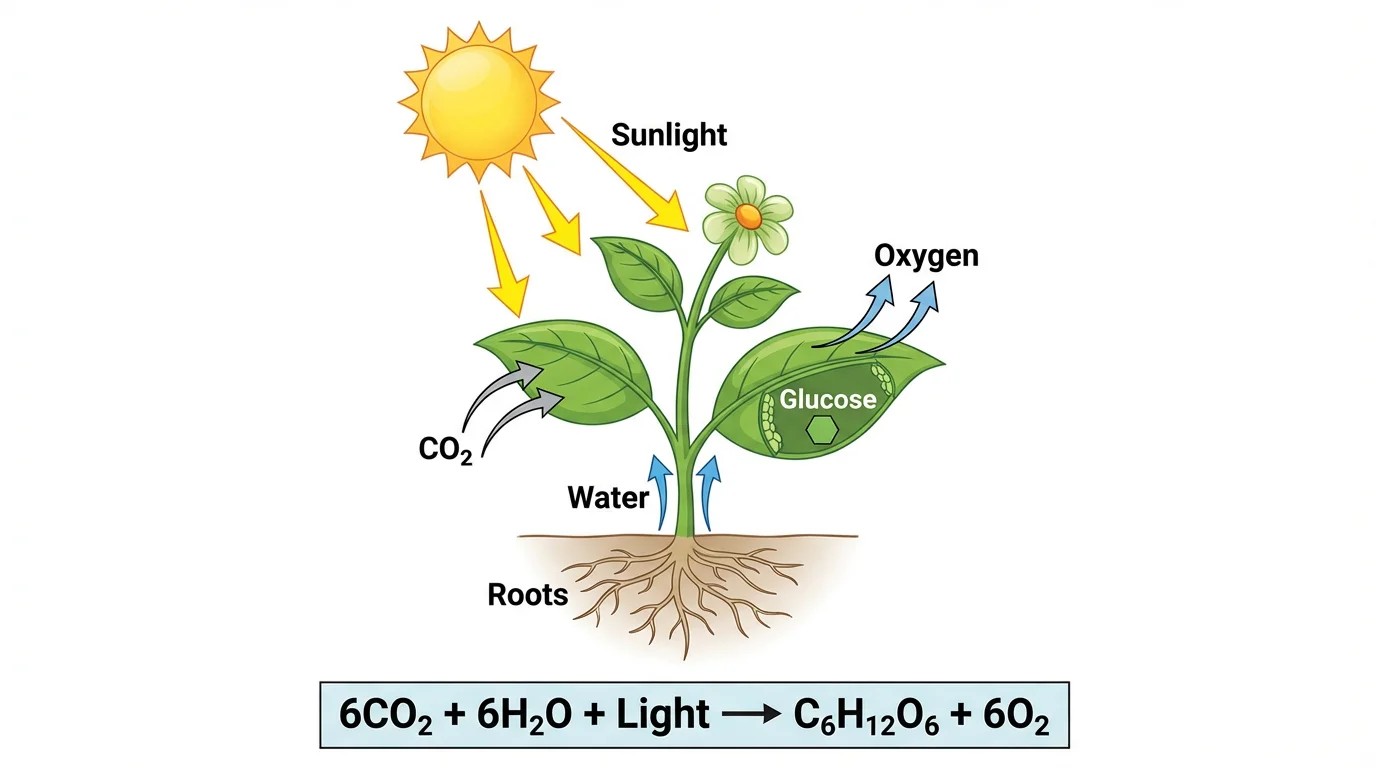
Photosynthesis Diagram Generator
Make labeled photosynthesis diagrams showing inputs, outputs, and the chloroplast.
 Earth Science
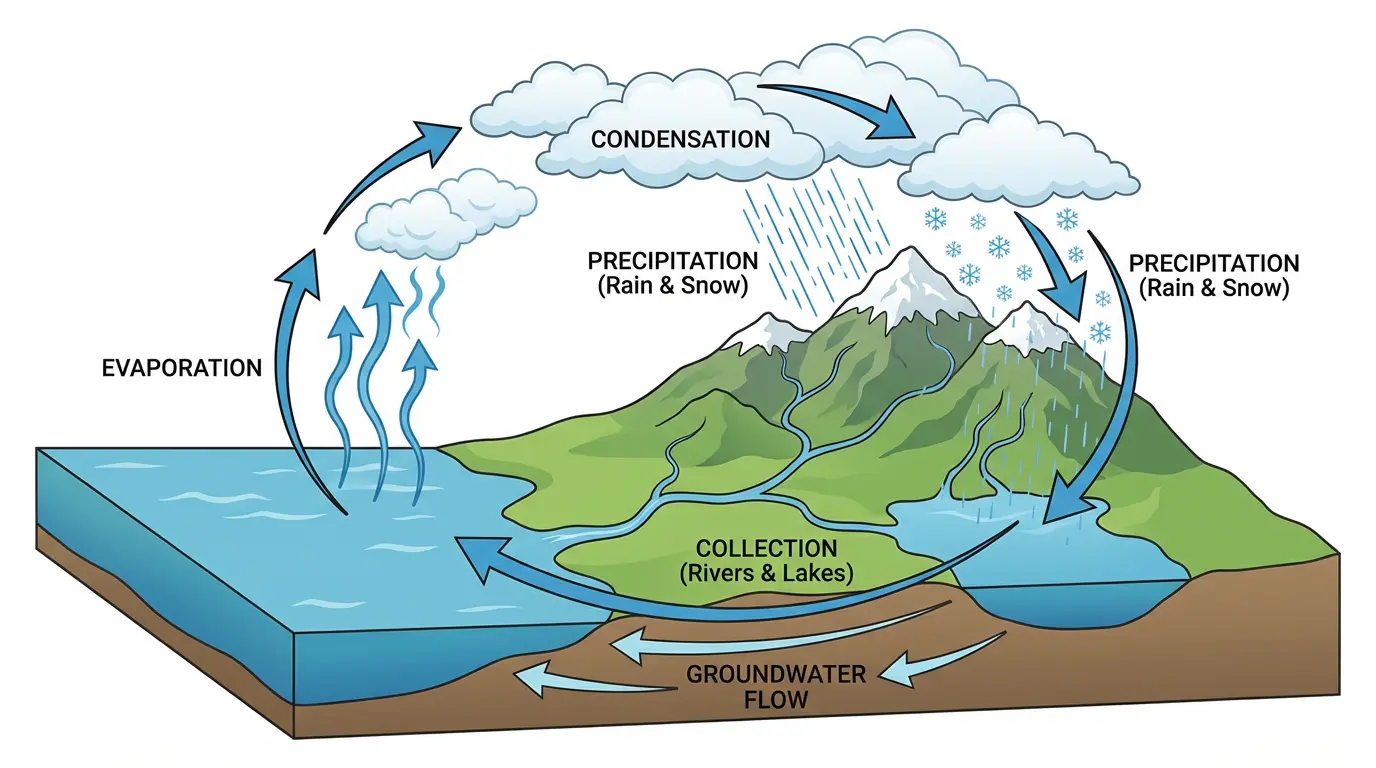
Water Cycle Diagram Generator
Create labeled water cycle diagrams with evaporation, condensation, and precipitation.