")
15 Illustration and Infographic Design Styles Explained (2026)
Explore 15 illustration and infographic design styles with examples: flat, isometric, 3D, hand-drawn, minimalist, vector, cartoon, line art and more.
Choosing the right illustration style can make or break your visual communication. Whether you're designing for websites, social media, presentations, marketing materials, or educational content, understanding different illustration styles helps you select the most effective approach for your project.
This guide explores 15 popular illustration and infographic design styles with visual examples, their characteristics, and when to use each one—from flat design and vector art to isometric, minimalist, 3D rendering, and hand-drawn styles.
AI Infographic Generator
Create professional infographics with various illustration styles. No design skills needed.
Try it free →Why Illustration Style Matters
Before diving into specific styles, understand why this choice matters:
- Communication clarity: Different styles convey information differently
- Audience expectations: Academic audiences expect different visuals than general audiences
- Brand consistency: Maintaining style across materials builds recognition
- Emotional impact: Style affects how viewers feel about your content
- Production efficiency: Some styles are faster to create than others
Infographic Design Styles: Quick Match
If you are choosing a style for an infographic, poster, presentation, or science communication visual, start with the communication goal:
| Infographic goal | Best style | Why it works |
|---|---|---|
| Explain a process | Flat design or line art | Clear shapes and labels keep steps easy to scan |
| Show systems or spatial relationships | Isometric illustration | Adds structure and depth without full 3D complexity |
| Make complex topics approachable | Hand-drawn or sketch style | Feels less formal and more human |
| Present data or research findings | Minimalist editorial style | Reduces decoration and keeps attention on the evidence |
| Create a modern product or technology visual | 3D or soft dimensional style | Adds polish for marketing, AI, and software topics |
For a deeper trend-focused breakdown, use this page as the style reference and pair it with a dedicated infographic design workflow.
According to Linearity, understanding various illustration styles helps creators "develop their unique styles" while meeting project requirements.
15 Popular Illustration Styles
1. Flat Design
Characteristics:
- Two-dimensional appearance
- Minimal shadows and gradients
- Bold, solid colors
- Simple geometric shapes
- Clean, uncluttered look
Best For:
- Infographics and data visualization
- User interface design
- Educational materials
- Quick concept communication
Scientific Applications: Flat design works well for diagrams, flowcharts, and simplified representations of complex processes. It's particularly effective when you need to show relationships without distracting details.
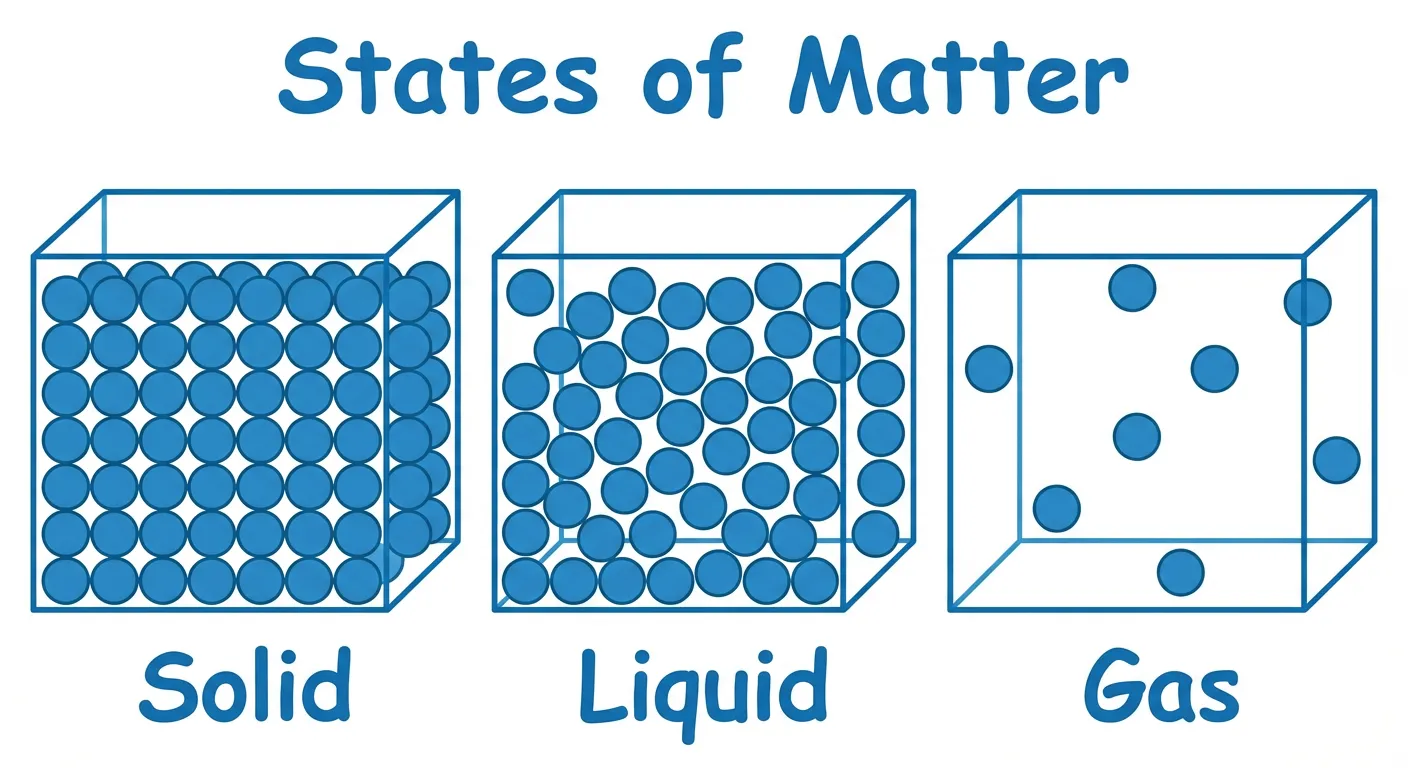
States of matter diagram using flat design principles
2. Isometric Illustration
Characteristics:
- 3D appearance using 30-degree angles
- No perspective distortion
- Equal scale on all axes
- Parallel lines (no vanishing points)
- Technical precision
According to Linearity's isometric guide, "Isometric illustration is a form of 3D drawing set out using 30-degree angles. It's a type of axonometric drawing, so the same scale is used for every axis."
Best For:
- Technical diagrams
- Architecture and engineering
- Process visualization
- Complex system representations
Scientific Applications: Excellent for showing spatial relationships in molecular structures, laboratory setups, or anatomical cross-sections where accurate proportions matter.
3. 3D Rendering
Characteristics:
- Realistic depth and perspective
- Lighting and shadows
- Material textures
- Photorealistic or stylized
- Computationally intensive
Best For:
- Product visualization
- Molecular modeling
- Anatomical illustrations
- Complex spatial concepts
Scientific Applications: Essential for molecular visualization, protein structures, and any subject where three-dimensional understanding is critical. Tools like PyMOL and Chimera specialize in scientific 3D rendering.
4. Hand-Drawn/Sketch Style
Characteristics:
- Organic, imperfect lines
- Visible brush or pencil strokes
- Personal, human feel
- Varying line weights
- Often monochromatic or limited palette
According to Creative Bloq, "In 2026, the big trend is clear: embrace the mess. It's all about being naive, imperfect and human."
Best For:
- Concept sketches
- Educational materials
- Science communication to general audiences
- Adding warmth to technical content
Scientific Applications: Hand-drawn styles can make complex science more approachable. They're particularly effective for preliminary concepts, brainstorming visuals, and communicating with non-expert audiences.
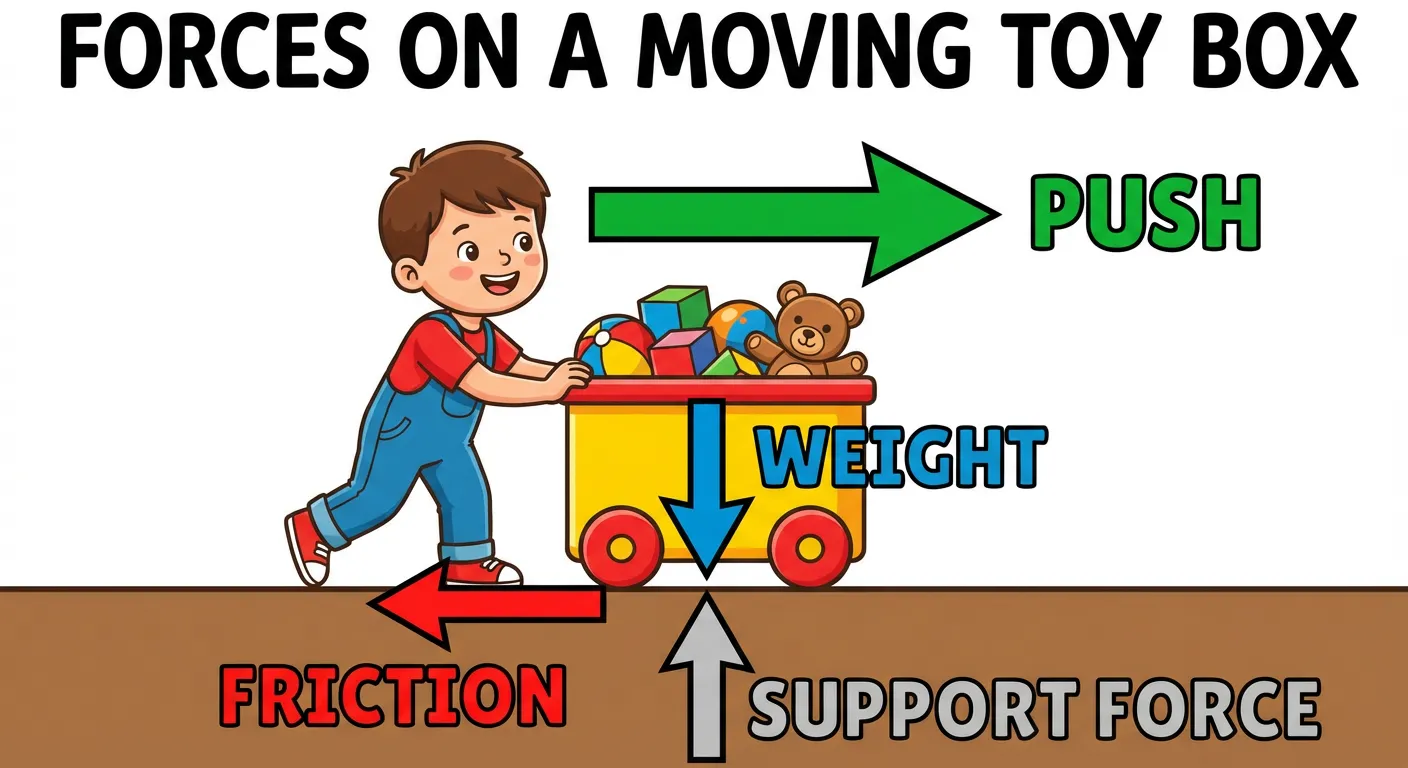
Physics concept illustrated in an approachable style
5. Line Art
Characteristics:
- Outlines only, no fills
- Clean, precise lines
- High contrast (usually black on white)
- Scalable without quality loss
- Classic, timeless appearance
Best For:
- Technical documentation
- Patent illustrations
- Coloring materials
- Print publications
Scientific Applications: Traditional scientific illustration often uses line art. It's ideal for anatomical drawings, botanical illustrations, and any subject requiring precise detail without color distraction.
6. Minimalist
Characteristics:
- Essential elements only
- Maximum white space
- Limited color palette
- Simple shapes
- Focus on core message
Best For:
- Icons and symbols
- Quick communication
- Modern, clean aesthetics
- Mobile-friendly graphics
Scientific Applications: Minimalist illustrations work well for graphical abstracts, icons in presentations, and simplified representations of complex concepts.
7. Realistic/Photorealistic
Characteristics:
- Lifelike appearance
- Detailed textures and lighting
- Accurate proportions
- Time-intensive creation
- High technical skill required
Best For:
- Medical illustration
- Natural history
- Product documentation
- When accuracy is paramount
Scientific Applications: Medical and biological illustration often requires photorealistic accuracy. This style is essential when viewers need to recognize real-world subjects.
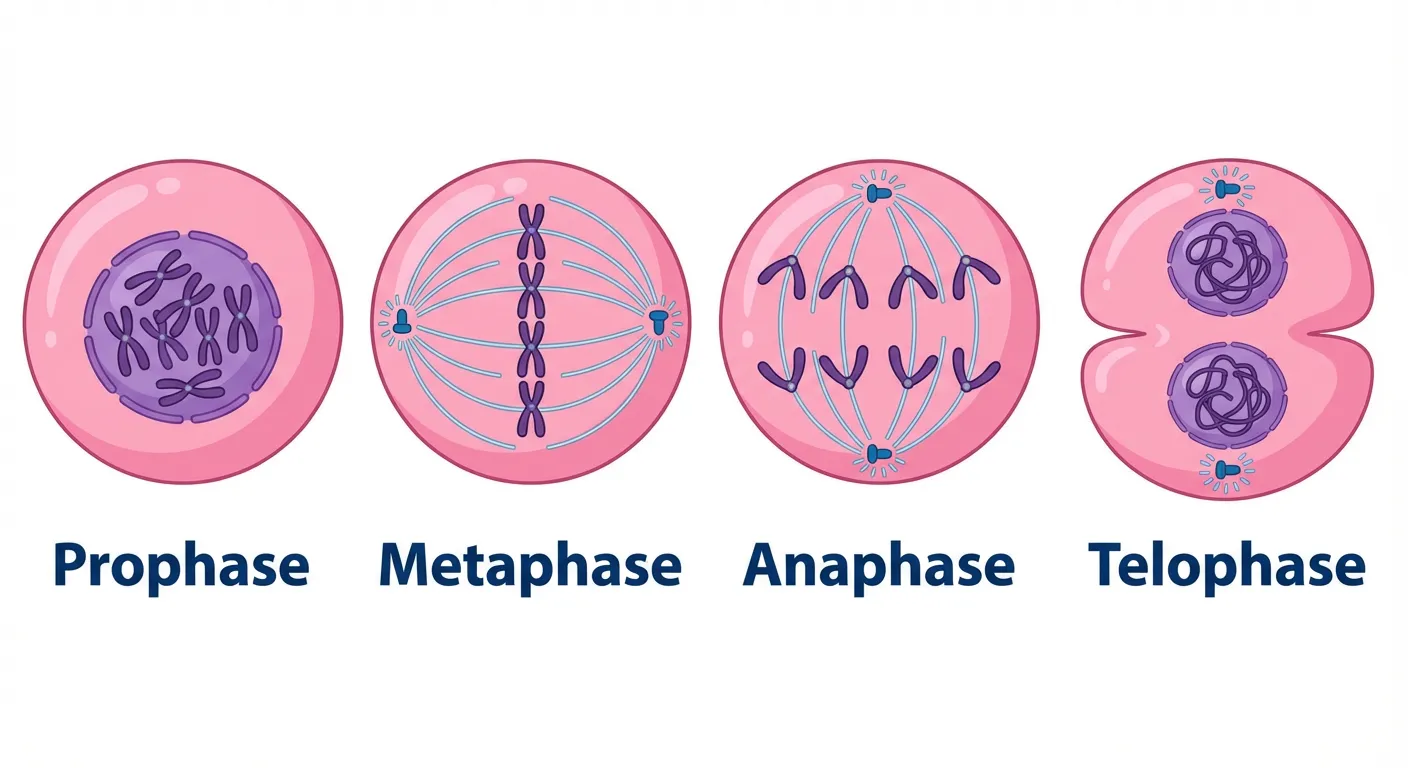
Mitosis stages illustrated with realistic detail
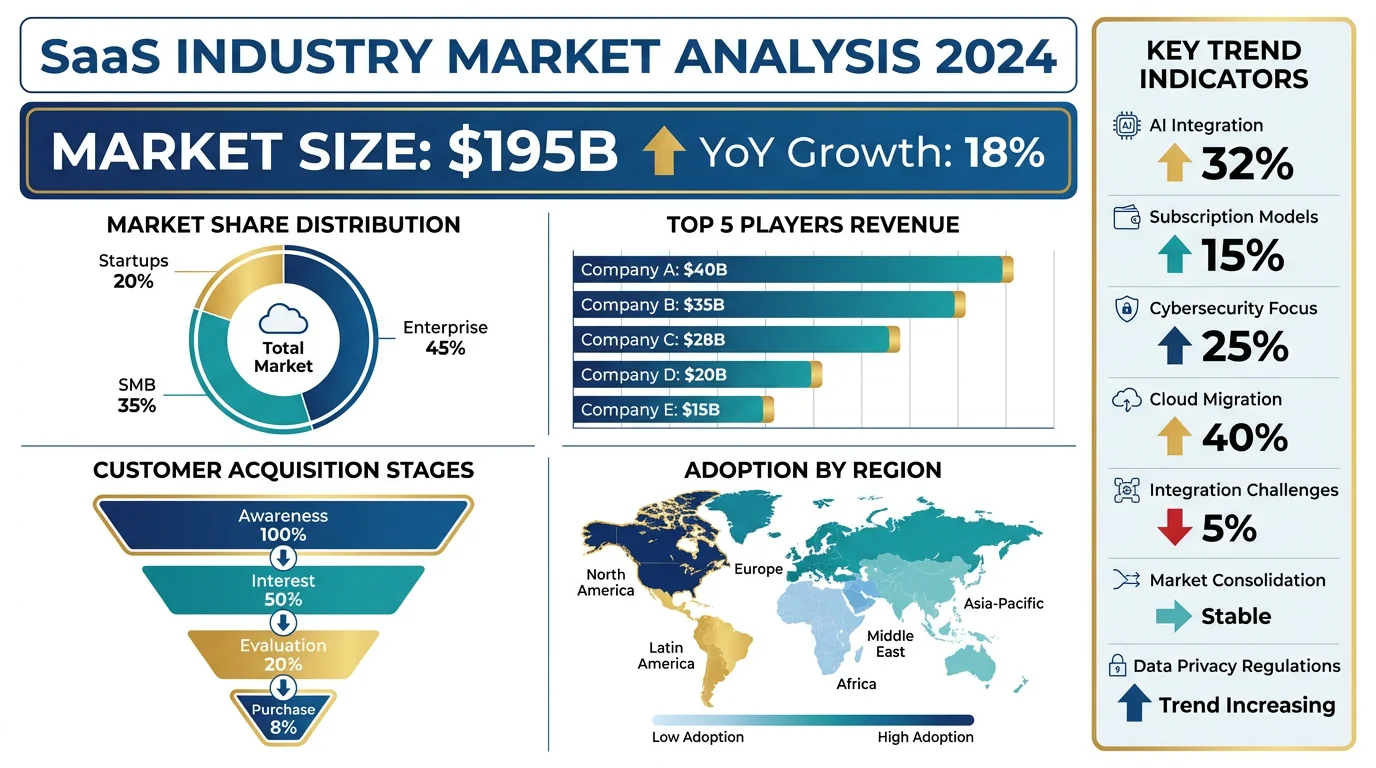
8. Infographic Style
Characteristics:
- Data-driven visuals
- Charts and graphs integrated
- Icons and symbols
- Clear hierarchy
- Designed for quick comprehension
Best For:
- Research summaries
- Statistical presentations
- Educational content
- Social media sharing
Scientific Applications: Perfect for presenting research findings, comparing data, and creating visual abstracts. See our scientific infographic design guide for detailed guidance.
9. Cartoon/Comic Style
Characteristics:
- Exaggerated features
- Bold outlines
- Bright colors
- Expressive characters
- Narrative potential
Best For:
- Science communication
- Educational materials for younger audiences
- Making complex topics approachable
- Social media content
Scientific Applications: While not appropriate for journal figures, cartoon styles excel in science outreach, educational videos, and making research accessible to general audiences.
10. Watercolor
Characteristics:
- Soft, flowing edges
- Transparent color layers
- Organic textures
- Traditional art feel
- Unique, unrepeatable results
Best For:
- Botanical illustration
- Natural history
- Artistic presentations
- Book illustrations
Scientific Applications: Traditional botanical and zoological illustration often uses watercolor. Digital watercolor effects can add warmth to scientific presentations.
11. Vector Art
Characteristics:
- Mathematically defined shapes
- Infinitely scalable
- Clean edges at any size
- Editable and flexible
- File-size efficient
Best For:
- Logos and icons
- Print materials
- Any scalable graphics
- Technical diagrams
Scientific Applications: Vector graphics are essential for publication-quality figures. They maintain quality at any size and are required by most scientific journals.
12. Geometric
Characteristics:
- Based on basic shapes
- Mathematical precision
- Abstract representation
- Modern aesthetic
- Pattern-friendly
Best For:
- Abstract concepts
- Data visualization
- Modern branding
- Pattern design
Scientific Applications: Geometric styles work well for representing abstract concepts, molecular structures, and mathematical relationships.
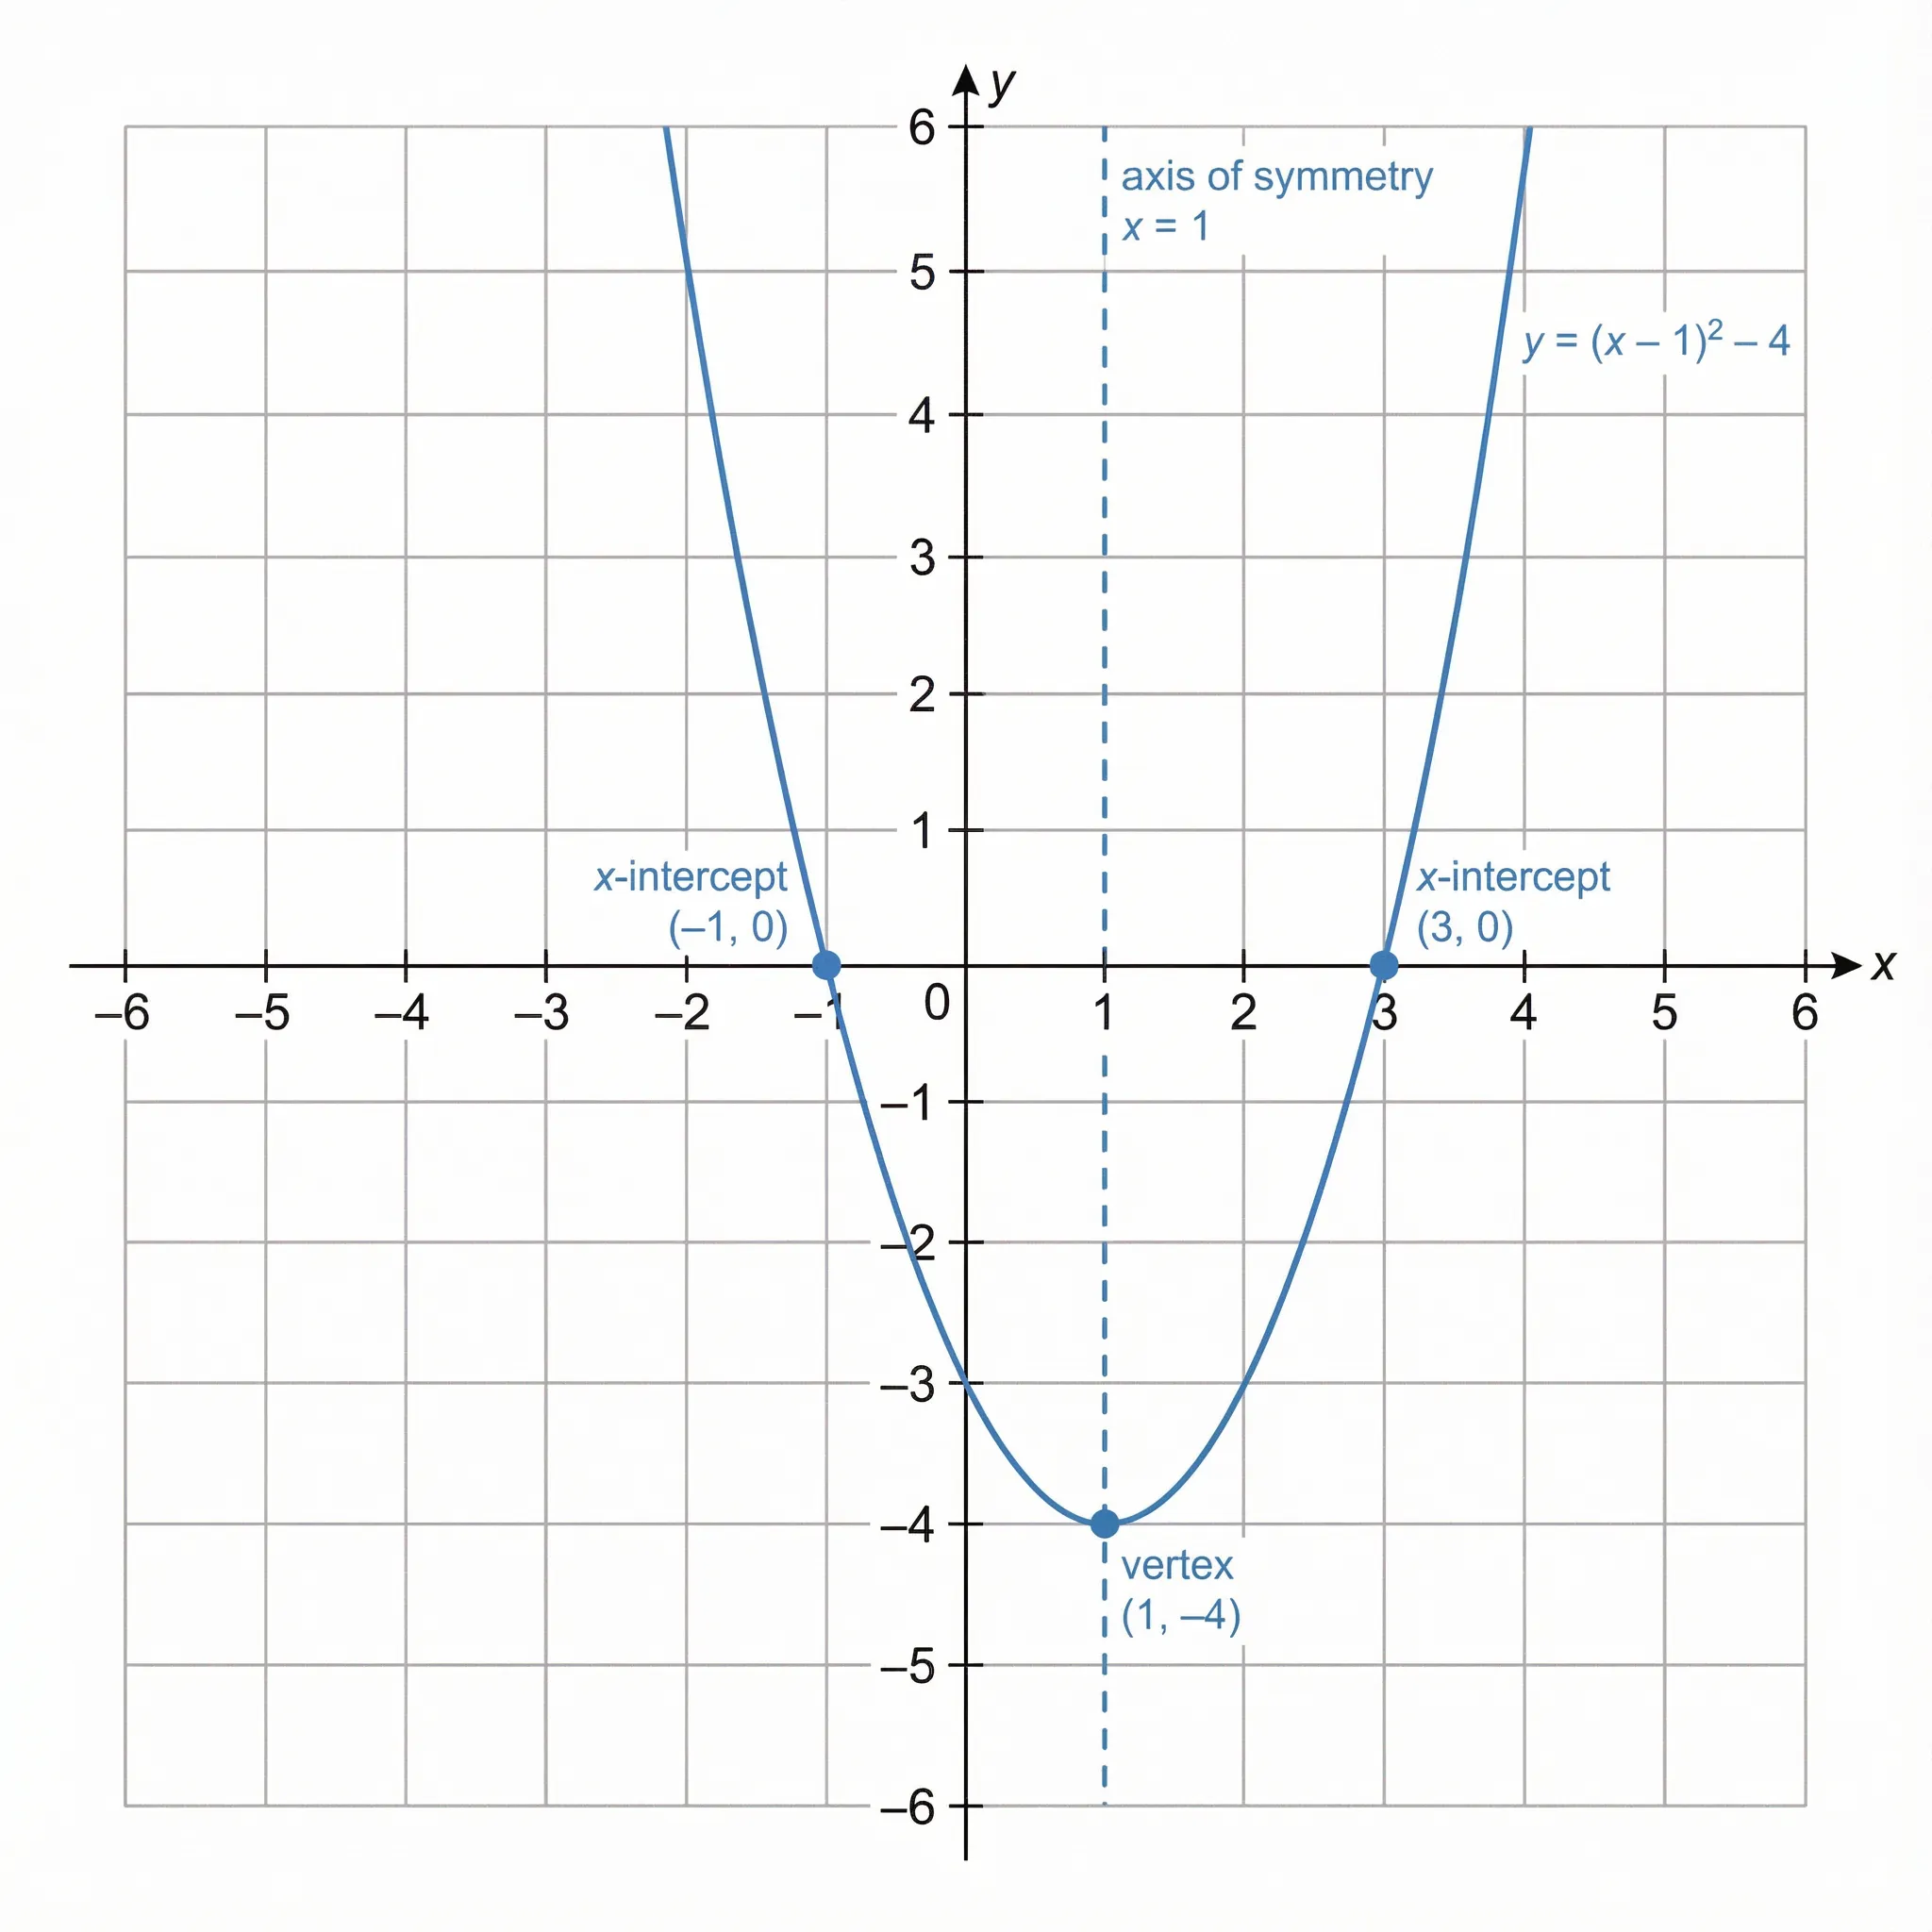
Mathematical concept using geometric illustration
13. Retro/Vintage
Characteristics:
- Historical aesthetic references
- Limited color palettes
- Textured appearances
- Nostalgic feel
- Period-specific typography
Best For:
- Historical content
- Brand differentiation
- Specific audience appeal
- Creative projects
Scientific Applications: Retro styles can be effective for science history content or when targeting specific demographics. Generally not appropriate for current research presentation.
14. Collage/Mixed Media
Characteristics:
- Combines multiple elements
- Photos with illustrations
- Layered compositions
- Unique textures
- Creative freedom
According to Get Illustrations, "Artists are mixing ink, watercolour and pencil with digital finishes to create hybrid aesthetics."
Best For:
- Creative presentations
- Science communication
- Educational materials
- Artistic expression
Scientific Applications: Mixed media can combine photographs with diagrams, creating engaging visuals for presentations and outreach materials.
15. Data Visualization
Characteristics:
- Information-driven design
- Statistical accuracy
- Clear legends and labels
- Appropriate chart types
- Accessibility considerations
Best For:
- Research papers
- Reports and presentations
- Dashboard design
- Any quantitative communication
Scientific Applications: Essential for presenting research data. See our data visualization best practices guide for detailed guidance.
Choosing the Right Style for Your Project
Consider Your Audience
| Audience | Recommended Styles |
|---|---|
| Academic peers | Realistic, Line Art, Data Viz |
| General public | Flat, Cartoon, Infographic |
| Students | Hand-drawn, Flat, Cartoon |
| Medical professionals | Realistic, 3D, Line Art |
| Technical readers | Isometric, Vector, Line Art |
Consider Your Medium
| Medium | Recommended Styles |
|---|---|
| Journal paper | Vector, Line Art, Data Viz |
| Conference poster | Flat, Infographic, Isometric |
| Presentation slides | Flat, Minimalist, Infographic |
| Social media | Cartoon, Flat, Infographic |
| Textbook | Realistic, Line Art, Flat |
Consider Your Message
| Message Type | Recommended Styles |
|---|---|
| Process/workflow | Flat, Isometric, Line Art |
| Data/statistics | Data Viz, Infographic |
| Anatomy/structure | Realistic, 3D, Line Art |
| Concepts/ideas | Flat, Minimalist, Geometric |
| Comparisons | Infographic, Flat |
Style Trends in 2026
According to ARRIVAL Gallery, current trends include:
- Naive/playful styles: "Loose lines, scribbles, simple forms, and drawings that feel spontaneous rather than engineered"
- Human imperfection: Moving away from AI-perfect aesthetics
- Mixed media: Combining traditional and digital techniques
- Meaningful content: Style serving substance
For scientific illustration, this means:
- Hand-drawn elements can add warmth to technical content
- Imperfection can make science more approachable
- Authenticity matters more than polish
Maintaining Consistency
Whatever style you choose, consistency is key:
- Within a document: All figures should share a visual language
- Across a project: Maintain style throughout related materials
- For your brand: Develop recognizable visual identity
Tools for Different Styles
| Style | Recommended Tools |
|---|---|
| Flat Design | Illustrator, Figma, Canva |
| Isometric | Illustrator, Affinity Designer |
| 3D Rendering | Blender, Cinema 4D, PyMOL |
| Hand-drawn | Procreate, Photoshop, traditional media |
| Line Art | Illustrator, Inkscape |
| Data Viz | R/ggplot2, Python/matplotlib, Tableau |
AI-powered tools like ConceptViz can generate illustrations in various styles from text descriptions, making it easier to explore different approaches.
Conclusion
Understanding illustration styles empowers you to make informed choices about your visual communication. Key takeaways:
- Match style to purpose: Different styles serve different communication goals
- Know your audience: Academic and general audiences have different expectations
- Maintain consistency: Use the same style throughout related materials
- Stay current: Trends evolve, but clarity and accuracy remain paramount
- Experiment thoughtfully: Try different styles to find what works best
For scientific communication specifically, prioritize clarity and accuracy over trendiness. The best style is the one that most effectively communicates your message to your intended audience.
For more on creating effective scientific visuals, explore our guides on scientific illustration and making figures for Nature and Science journals.
Frequently Asked Questions
What are the most popular illustration styles?
The most popular illustration styles include flat design, isometric, 3D rendering, hand-drawn/sketch, line art, minimalist, realistic, infographic, cartoon, watercolor, vector art, geometric, retro/vintage, collage/mixed media, and data visualization. Each serves different purposes and audiences.
Which illustration style is best for scientific papers?
For scientific papers, vector art, line art, and data visualization styles are most appropriate. These styles prioritize clarity, accuracy, and scalability. Realistic styles work well for medical and biological subjects. Always follow your target journal's specific guidelines.
What is flat design illustration?
Flat design is a two-dimensional illustration style characterized by minimal shadows and gradients, bold solid colors, simple geometric shapes, and a clean, uncluttered appearance. It's popular for infographics, user interfaces, and educational materials.
What is isometric illustration?
Isometric illustration is a form of 3D drawing using 30-degree angles with no perspective distortion. It maintains equal scale on all axes and uses parallel lines instead of vanishing points. It's ideal for technical diagrams, architecture, and showing spatial relationships.
How do I choose the right illustration style?
Consider your audience (academic vs. general public), medium (journal vs. social media), and message type (data vs. concepts). Academic audiences typically expect realistic or technical styles, while general audiences respond well to flat or cartoon styles. Always prioritize clarity over trendiness.
What illustration styles are trending in 2026?
2026 trends include naive/playful styles with loose lines and spontaneous feel, human imperfection moving away from AI-perfect aesthetics, mixed media combining traditional and digital techniques, and meaningful content where style serves substance.
Can I mix different illustration styles?
Yes, mixed media and collage styles intentionally combine different approaches. However, within a single document or project, maintain consistency. Mixing styles works best when done intentionally for creative effect, not accidentally due to inconsistency.
What tools are best for different illustration styles?
Adobe Illustrator and Figma work well for flat and vector styles. Blender and Cinema 4D excel at 3D rendering. Procreate is popular for hand-drawn digital work. For data visualization, R/ggplot2 and Python/matplotlib are standard. AI tools like ConceptViz can generate various styles from text.
分类
更多文章

How to Present References in a Scientific Poster: Complete Citation Guide
Learn the best practices for formatting and presenting references on scientific posters. Includes citation styles, font sizes, placement tips, and real examples.

Column Chart Maker Guide: When to Use Column Charts and How to Make One
Learn when to use a column chart, how it differs from a bar chart, and how to make clean grouped, stacked, and spreadsheet-ready column charts.
: Tips, Slide Examples & Presentation Guide (2026)")
3 Minute Thesis (3MT): Tips, Slide Examples & Presentation Guide (2026)
3MT tips and winning slide examples. Learn how to design your 3 Minute Thesis slide, structure your presentation, and avoid common mistakes.