UMAP Plot Generator for cell embeddings
Free UMAP plot generator. Paste UMAP1 and UMAP2 coordinates to draw an exact embedding scatter and download SVG.
Paste cell, UMAP1, UMAP2 coordinates — renders an exact embedding scatter as SVG, free
UMAP coordinate table
cell, UMAP1, UMAP2, and optional group. This plots embeddings you already computed — it does not run UMAP.
140 samples parsed
T cell 35 · B cell 35 · Myeloid 35 · NK cell 35
UMAP Plot Generator
Free to try ·
Your AI UMAP plot illustration will appear here
For a data-accurate plot from your coordinates, use the Precise Plot tab instead
Example UMAP plots
The first four are exact engine renders from coordinate tables. The last two are AI illustrations of Illustration mode.
PBMC cell types
Exact engine render — pasted UMAP1/UMAP2, colored by cell type.
Tumor vs stroma
Exact engine render — two islands on UMAP1 vs UMAP2.
Batch split
Exact engine render — QC view of leftover batch structure.
Labeled cells
Exact engine render — farthest cells labeled.
AI illustration — PBMCs
AI illustration of Illustration mode — visual mockup, not plotted from coordinates.
AI illustration — tumor
AI illustration of Illustration mode — visual mockup, not plotted from a matrix.
What is a UMAP plot?
A UMAP plot here is an embedding scatter: each cell or sample is a point on UMAP1 versus UMAP2. Nearby points were neighbors in the original high-dimensional space. This page draws that figure from a table of already-computed coordinates. It does not run UMAP, estimate neighbors, or choose n_neighbors / min_dist. It is not a PCA score plot, not a t-SNE plot, and not a “what is UMAP” explainer.
UMAP versus PCA
- PCA is a linear score scatter of samples. UMAP is a nonlinear embedding, often used for single-cell islands. Paste PC scores into the PCA plot generator and UMAP coordinates here.
- t-SNE is a different embedding. This page only plots UMAP1/UMAP2 columns you already have.
- This tool does not recompute the embedding. Changing colors or labels does not change the layout.
What table to paste
A header plus cell (or sample), UMAP1, and UMAP2 is enough. A cell type, cluster, or group column colors the points. Comma, tab, or semicolon separated text all work. Files are truncated to 8,000 rows.
Export
Download a scalable SVG with no watermark and no account required for the precise plot. The AI Illustration tab is only for slides when you do not have coordinates yet — it will not match your cells.
Frequently Asked Questions
Related Research Tools
 Research
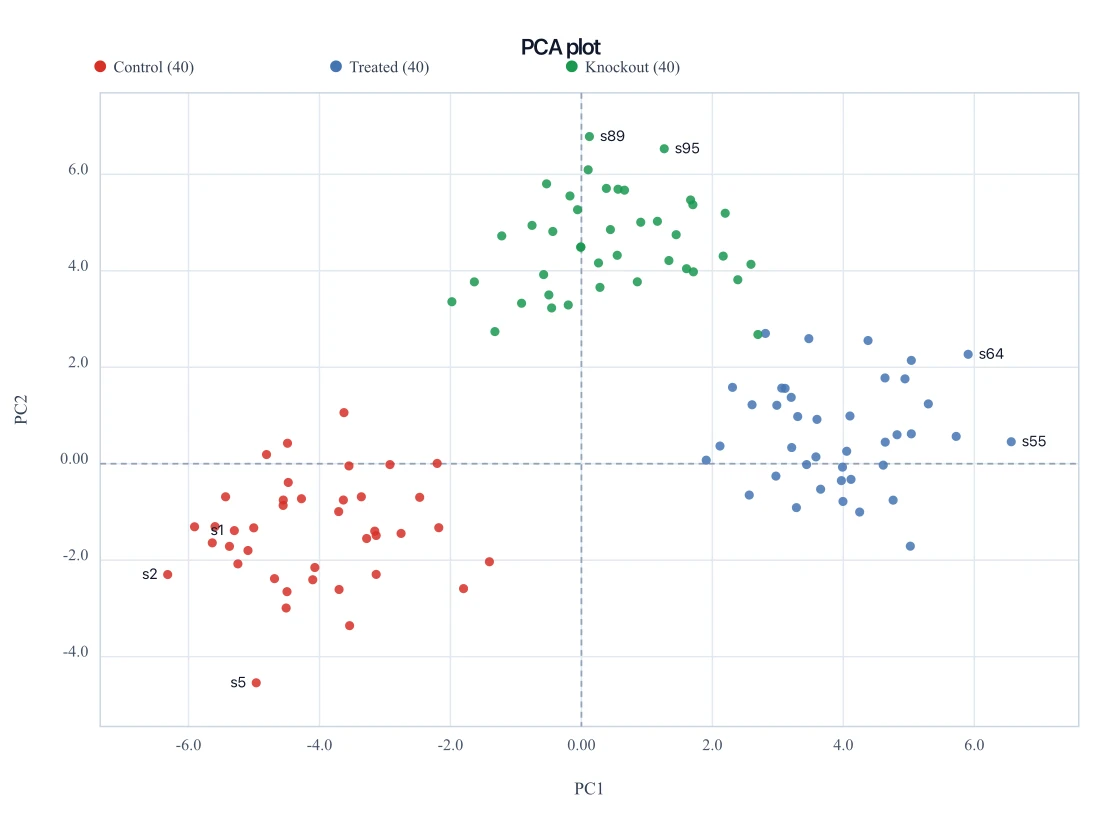
PCA Plot Generator
Paste sample PC1 and PC2 scores to draw the linear companion scatter.
 Research
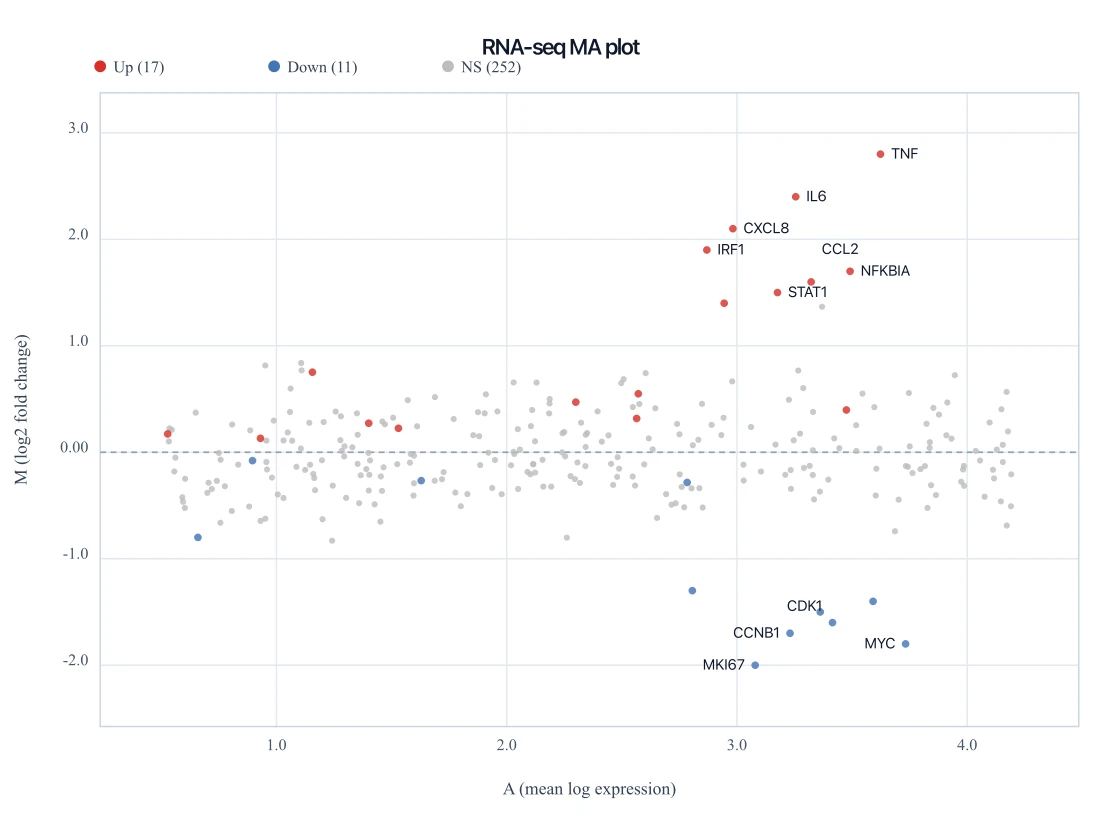
MA Plot Generator
Paste DESeq2 mean and log2 fold-change columns for the expression figure.
 Research
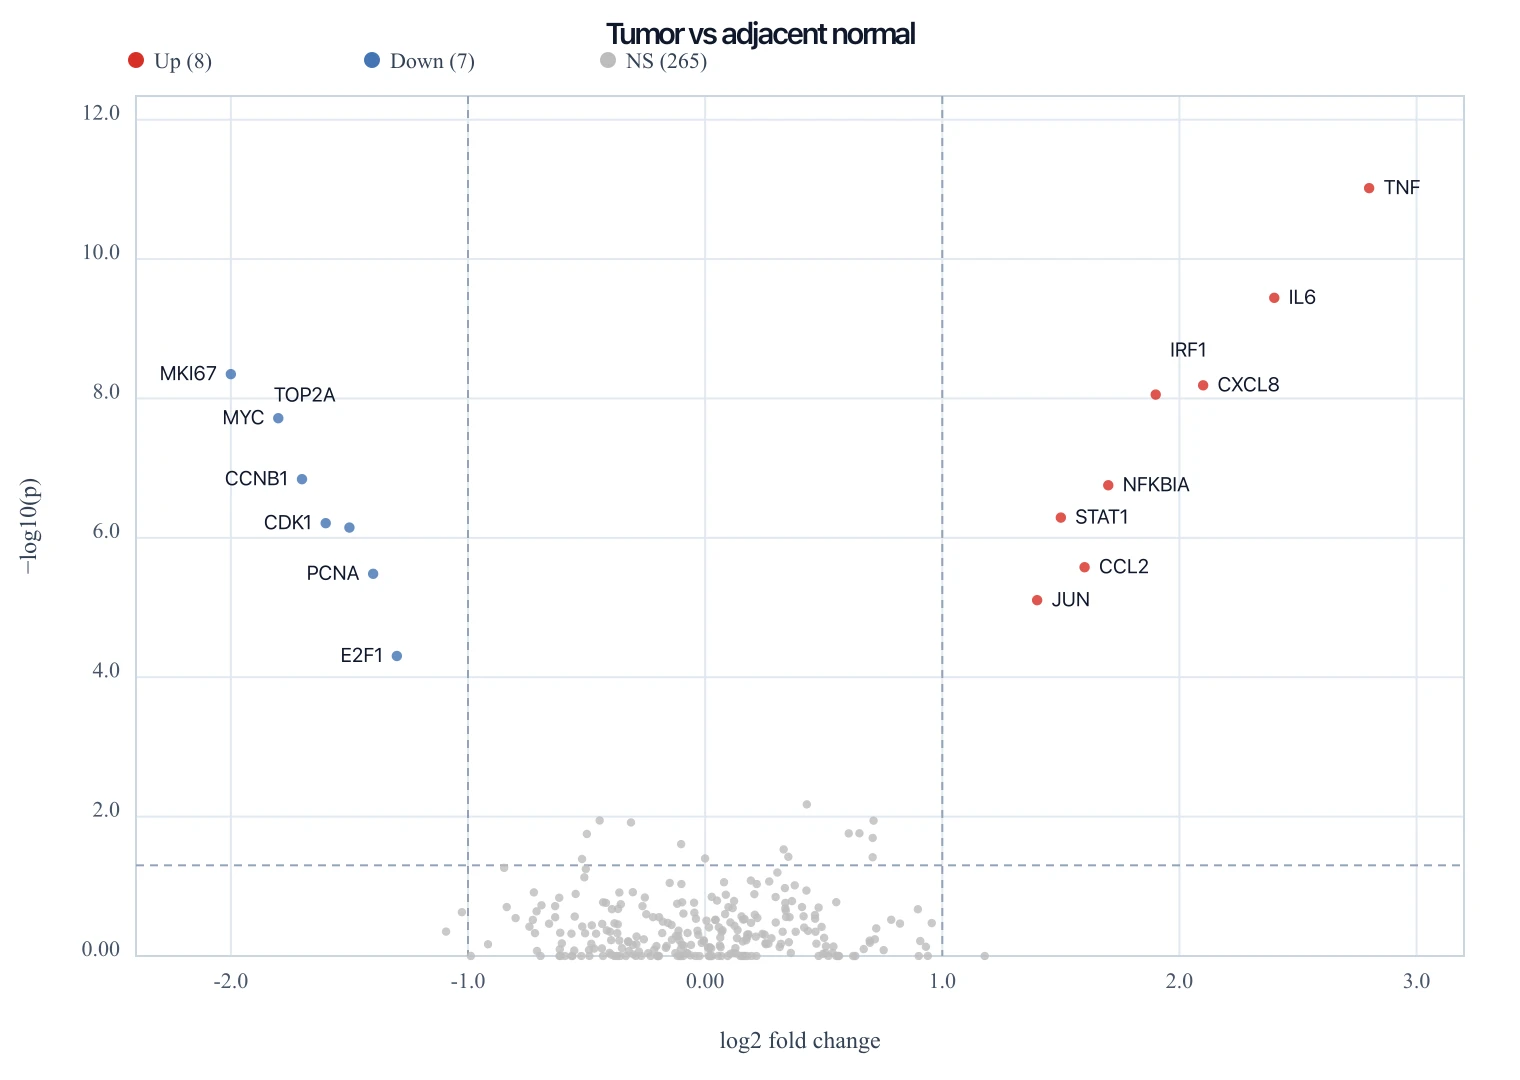
Volcano Plot Generator
Paste a DE table to draw log2 fold change versus −log10(p).
 Research
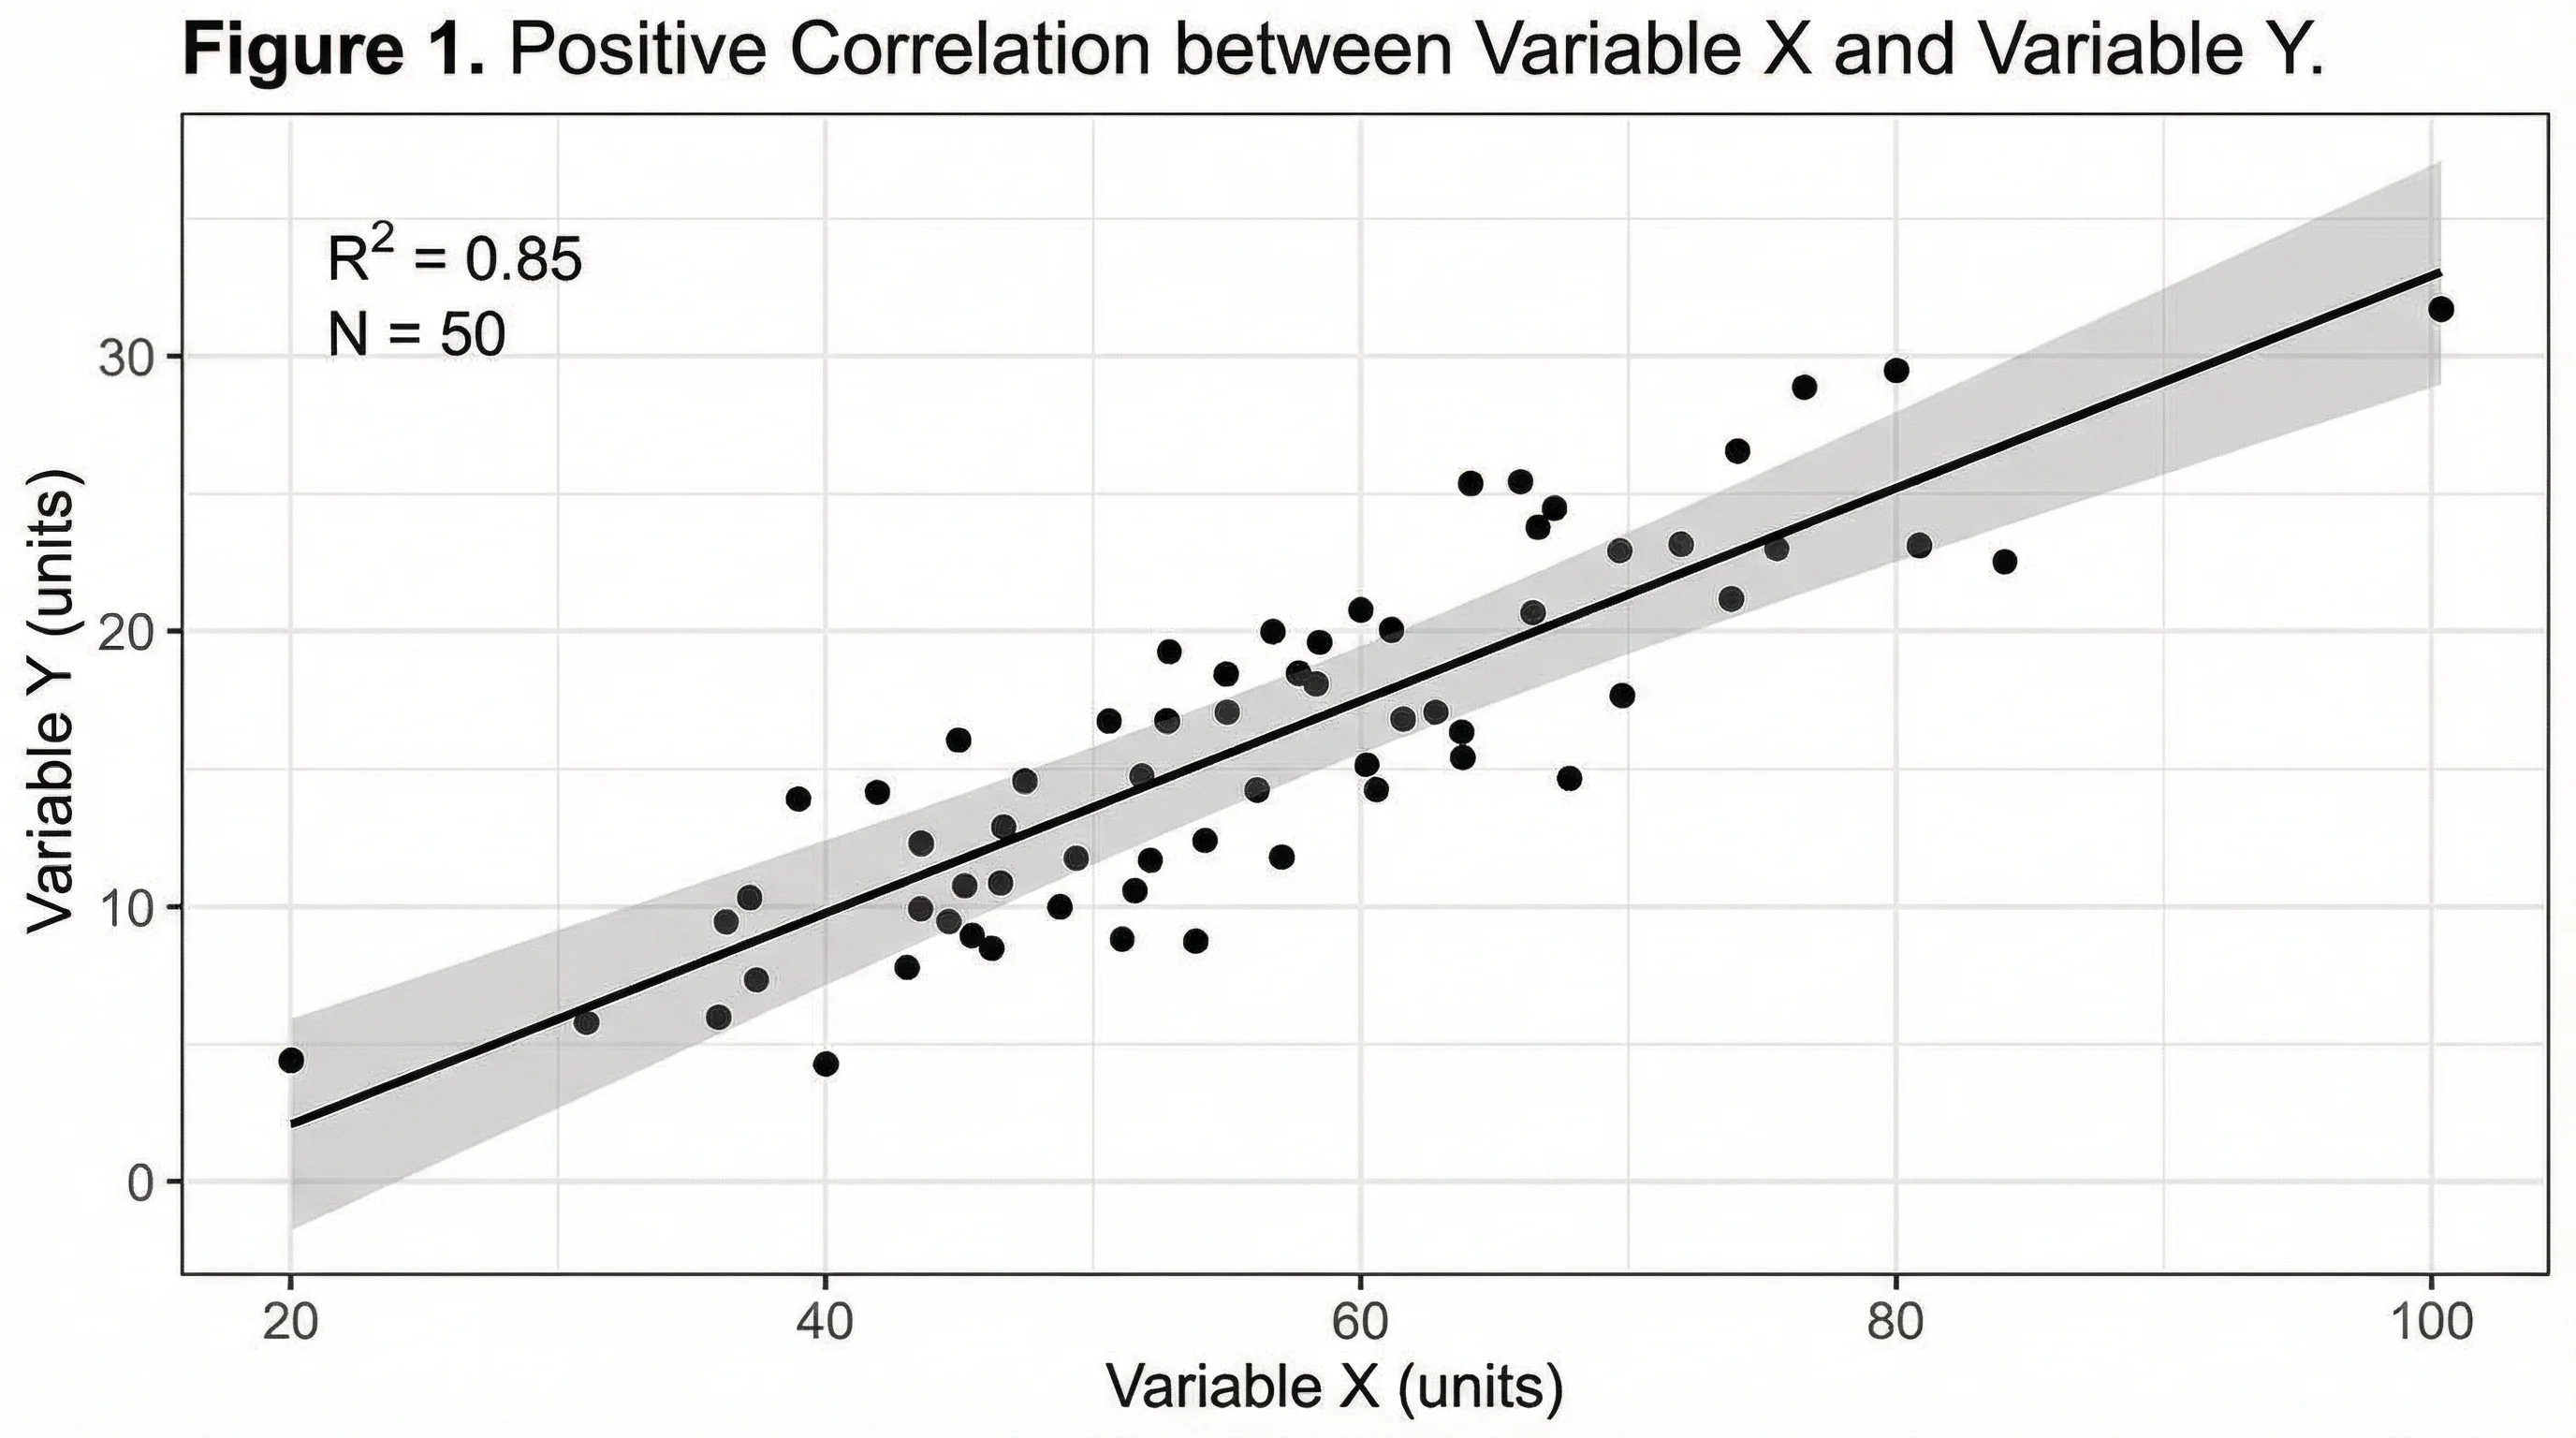
Scatter Plot Maker
Need a generic x–y scatter that is not an embedding? Use the scatter plot maker.