Solubility Curve Chart, Probe & Worksheet
Interactive solubility curve chart with real salt data (KNO₃, NaCl, KClO₃, NH₄Cl). Probe saturated vs unsaturated, export blank worksheets — free.
Probe: read the curve → saturated / unsaturated / supersaturated
unsaturated
At 40°C, KNO₃ solubility is 63.9 g/100 g. A mixture with 50 g is below the curve → unsaturated (more solute can dissolve).
Solubility Curve Examples
Rendered by the exact engine from reference solubility data — not AI guesses
Four Salts Labeled
KNO₃ steep, NaCl nearly flat — the classic classroom comparison chart.
KNO₃ vs NaCl
Why KNO₃ recrystallizes easily when cooled — huge drop in solubility.
KNO₃ Steep Curve
Single-solute focus for reading values off the steep KNO₃ curve.
NaCl Flat Curve
Table salt barely changes solubility from 0–100°C.
Probe: Saturated / Unsaturated
Mark any (T, g) point and classify it against the curve.
Blank Worksheet
Hide labels for practice — export SVG/PNG for homework.
What is a solubility curve?
A solubility curve graphs how many grams of a solute dissolve in 100 g of water at each temperature. Temperature is on the x-axis; solubility (g / 100 g H₂O) is on the y-axis. Each salt has its own curve. Classroom charts almost always include KNO₃ (steep) and NaCl (nearly flat) so students can see how temperature affects different compounds.
How to read saturated, unsaturated, and supersaturated
- On the curve — saturated: the maximum amount dissolves at that temperature.
- Below the curve — unsaturated: more solute can still dissolve.
- Above the curve — supersaturated: more solute than the equilibrium maximum (unstable; crystals may form).
Why KNO₃ and NaCl look so different
KNO₃ solubility rises sharply as water warms, so cooling a hot saturated solution produces lots of solid crystals. NaCl barely changes with temperature, so heating does little to dissolve more table salt. Matching those shapes is a common exam check — this tool uses real reference data so the shapes are correct.
Worksheets and practice
Use Worksheet mode to hide salt labels, export a blank chart, and practice reading values or classifying mixtures. Toggle Show answers for the built-in practice set. Generator/maker search volume is near zero for this topic; teachers search for “solubility curve” and “solubility curve worksheet” — hence the bare URL slug.
Solubility curve vs heating curve
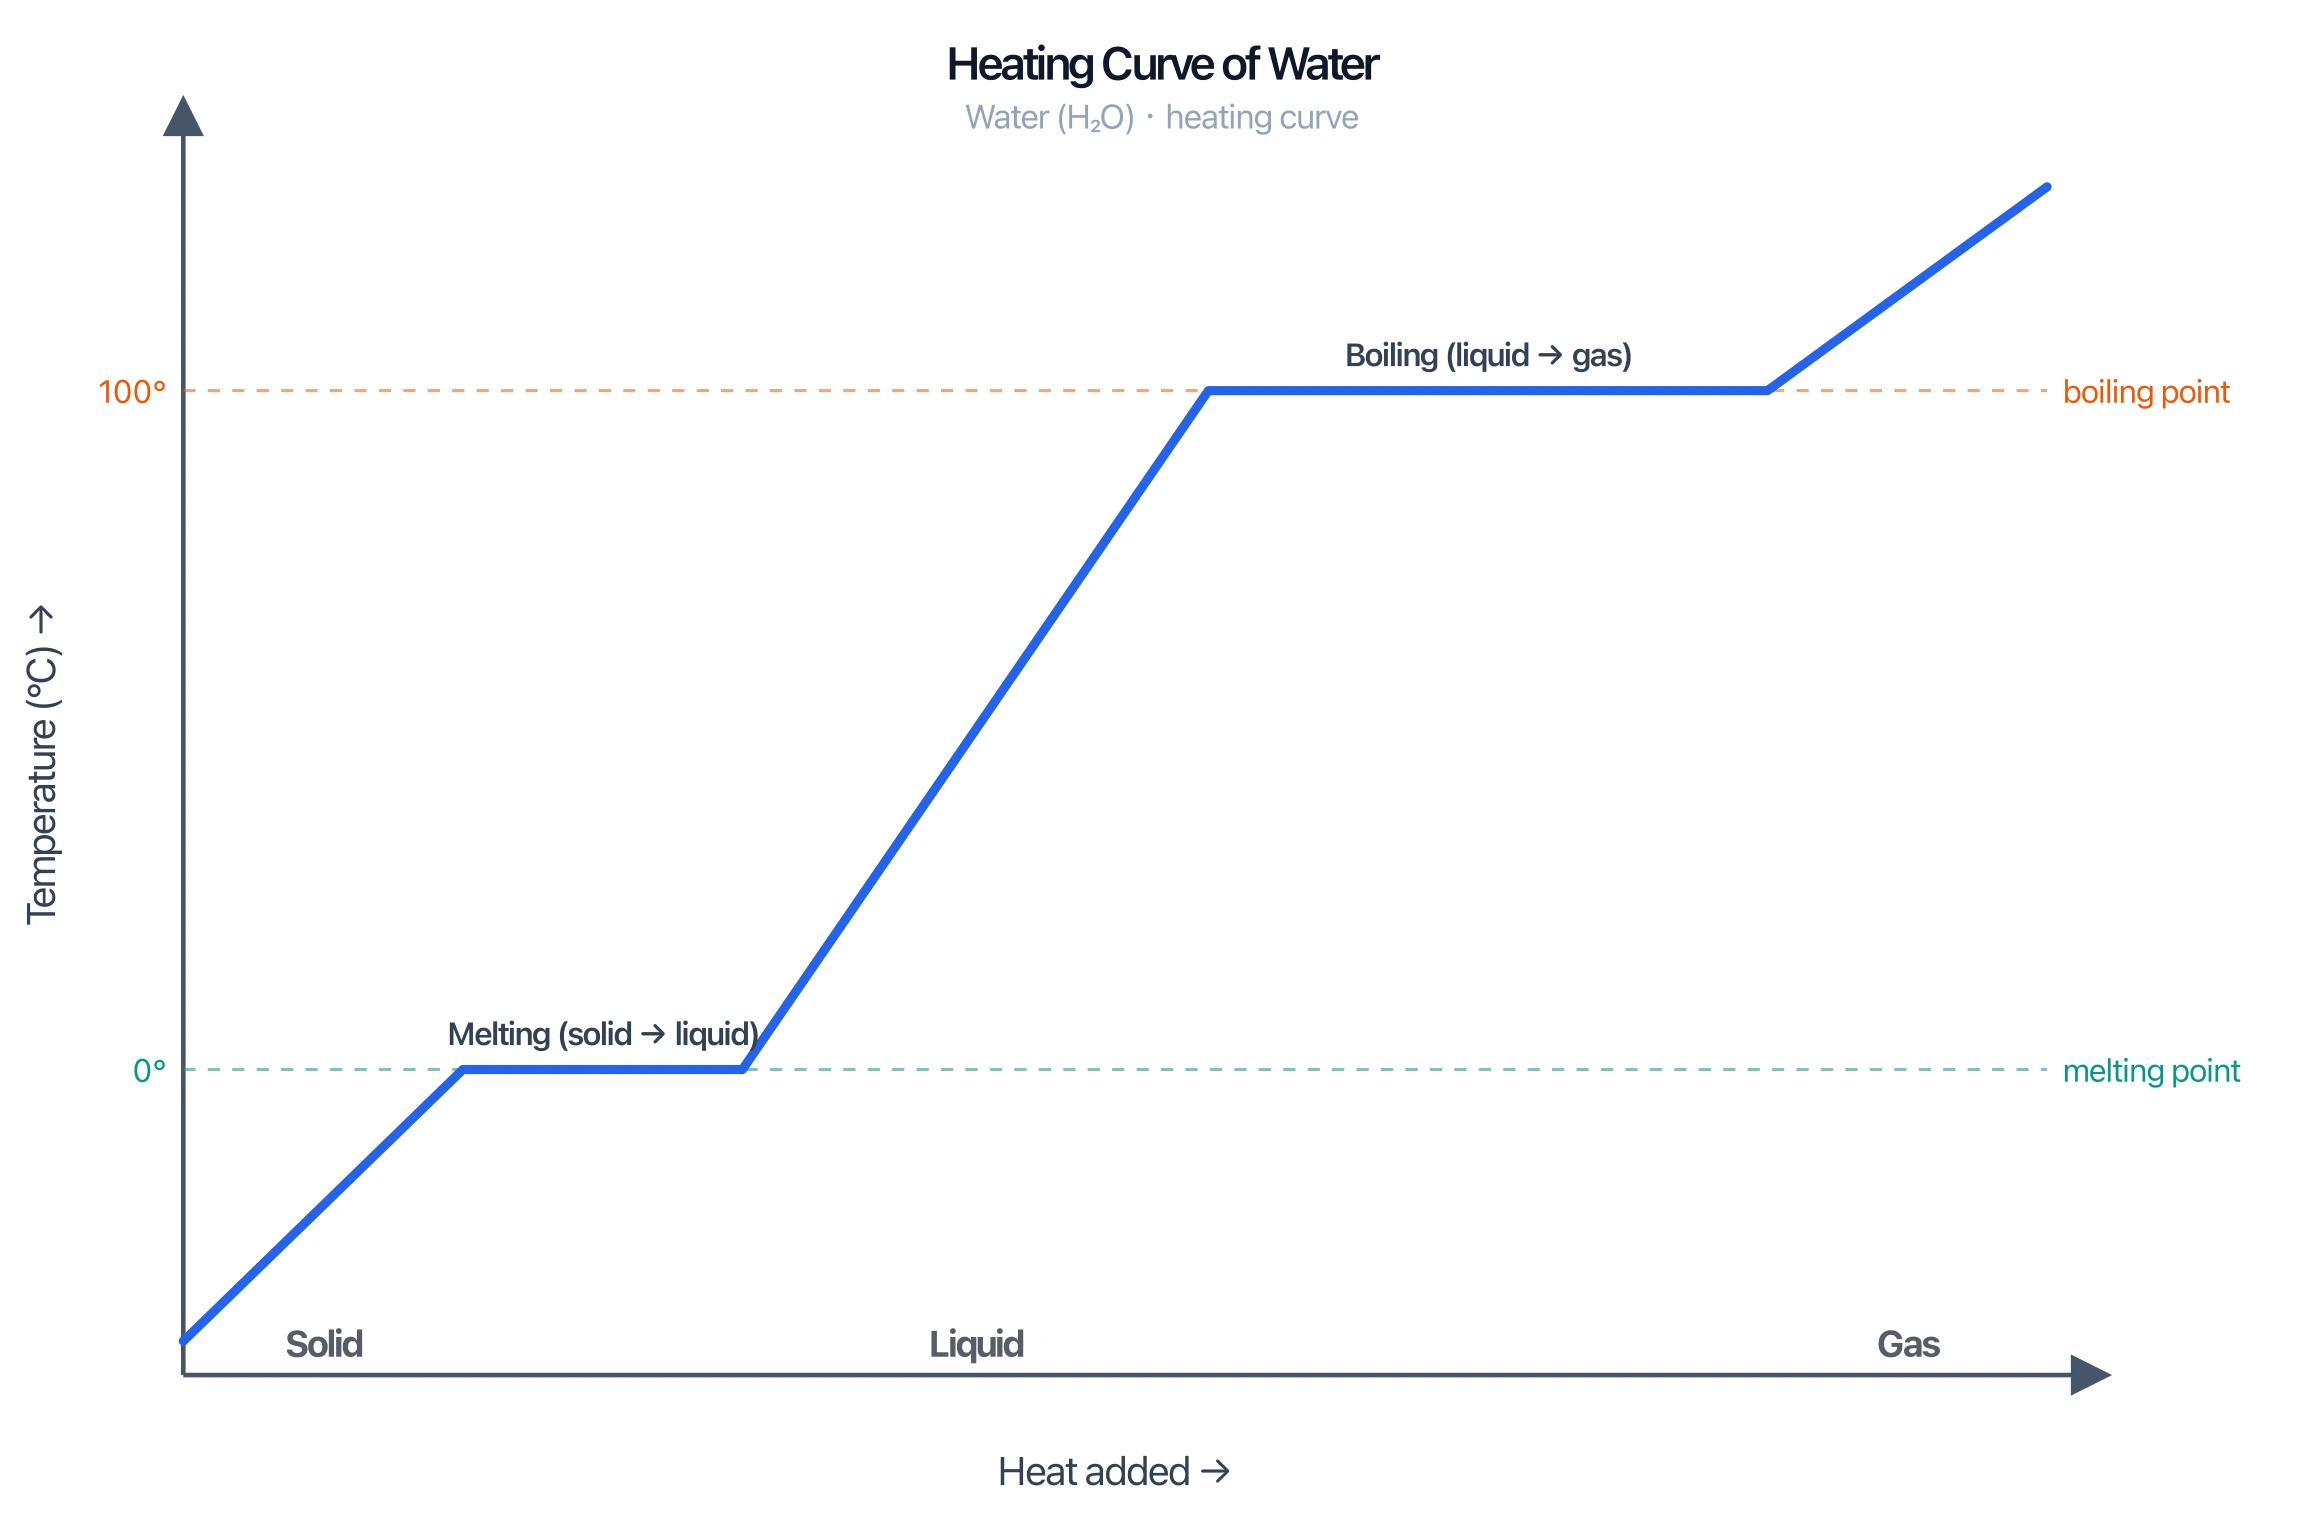
A solubility curve is about how much solid dissolves at each temperature. A heating curve (phase change diagram) is temperature versus heat added as a pure substance melts and boils. Use this page for solutions; use the Heating Curve tool for phase changes of a pure substance.
Frequently Asked Questions
Related Chemistry Tools
 Chemistry
Heating Curve Generator
Temperature vs heat added with melting and boiling plateaus.
 Chemistry
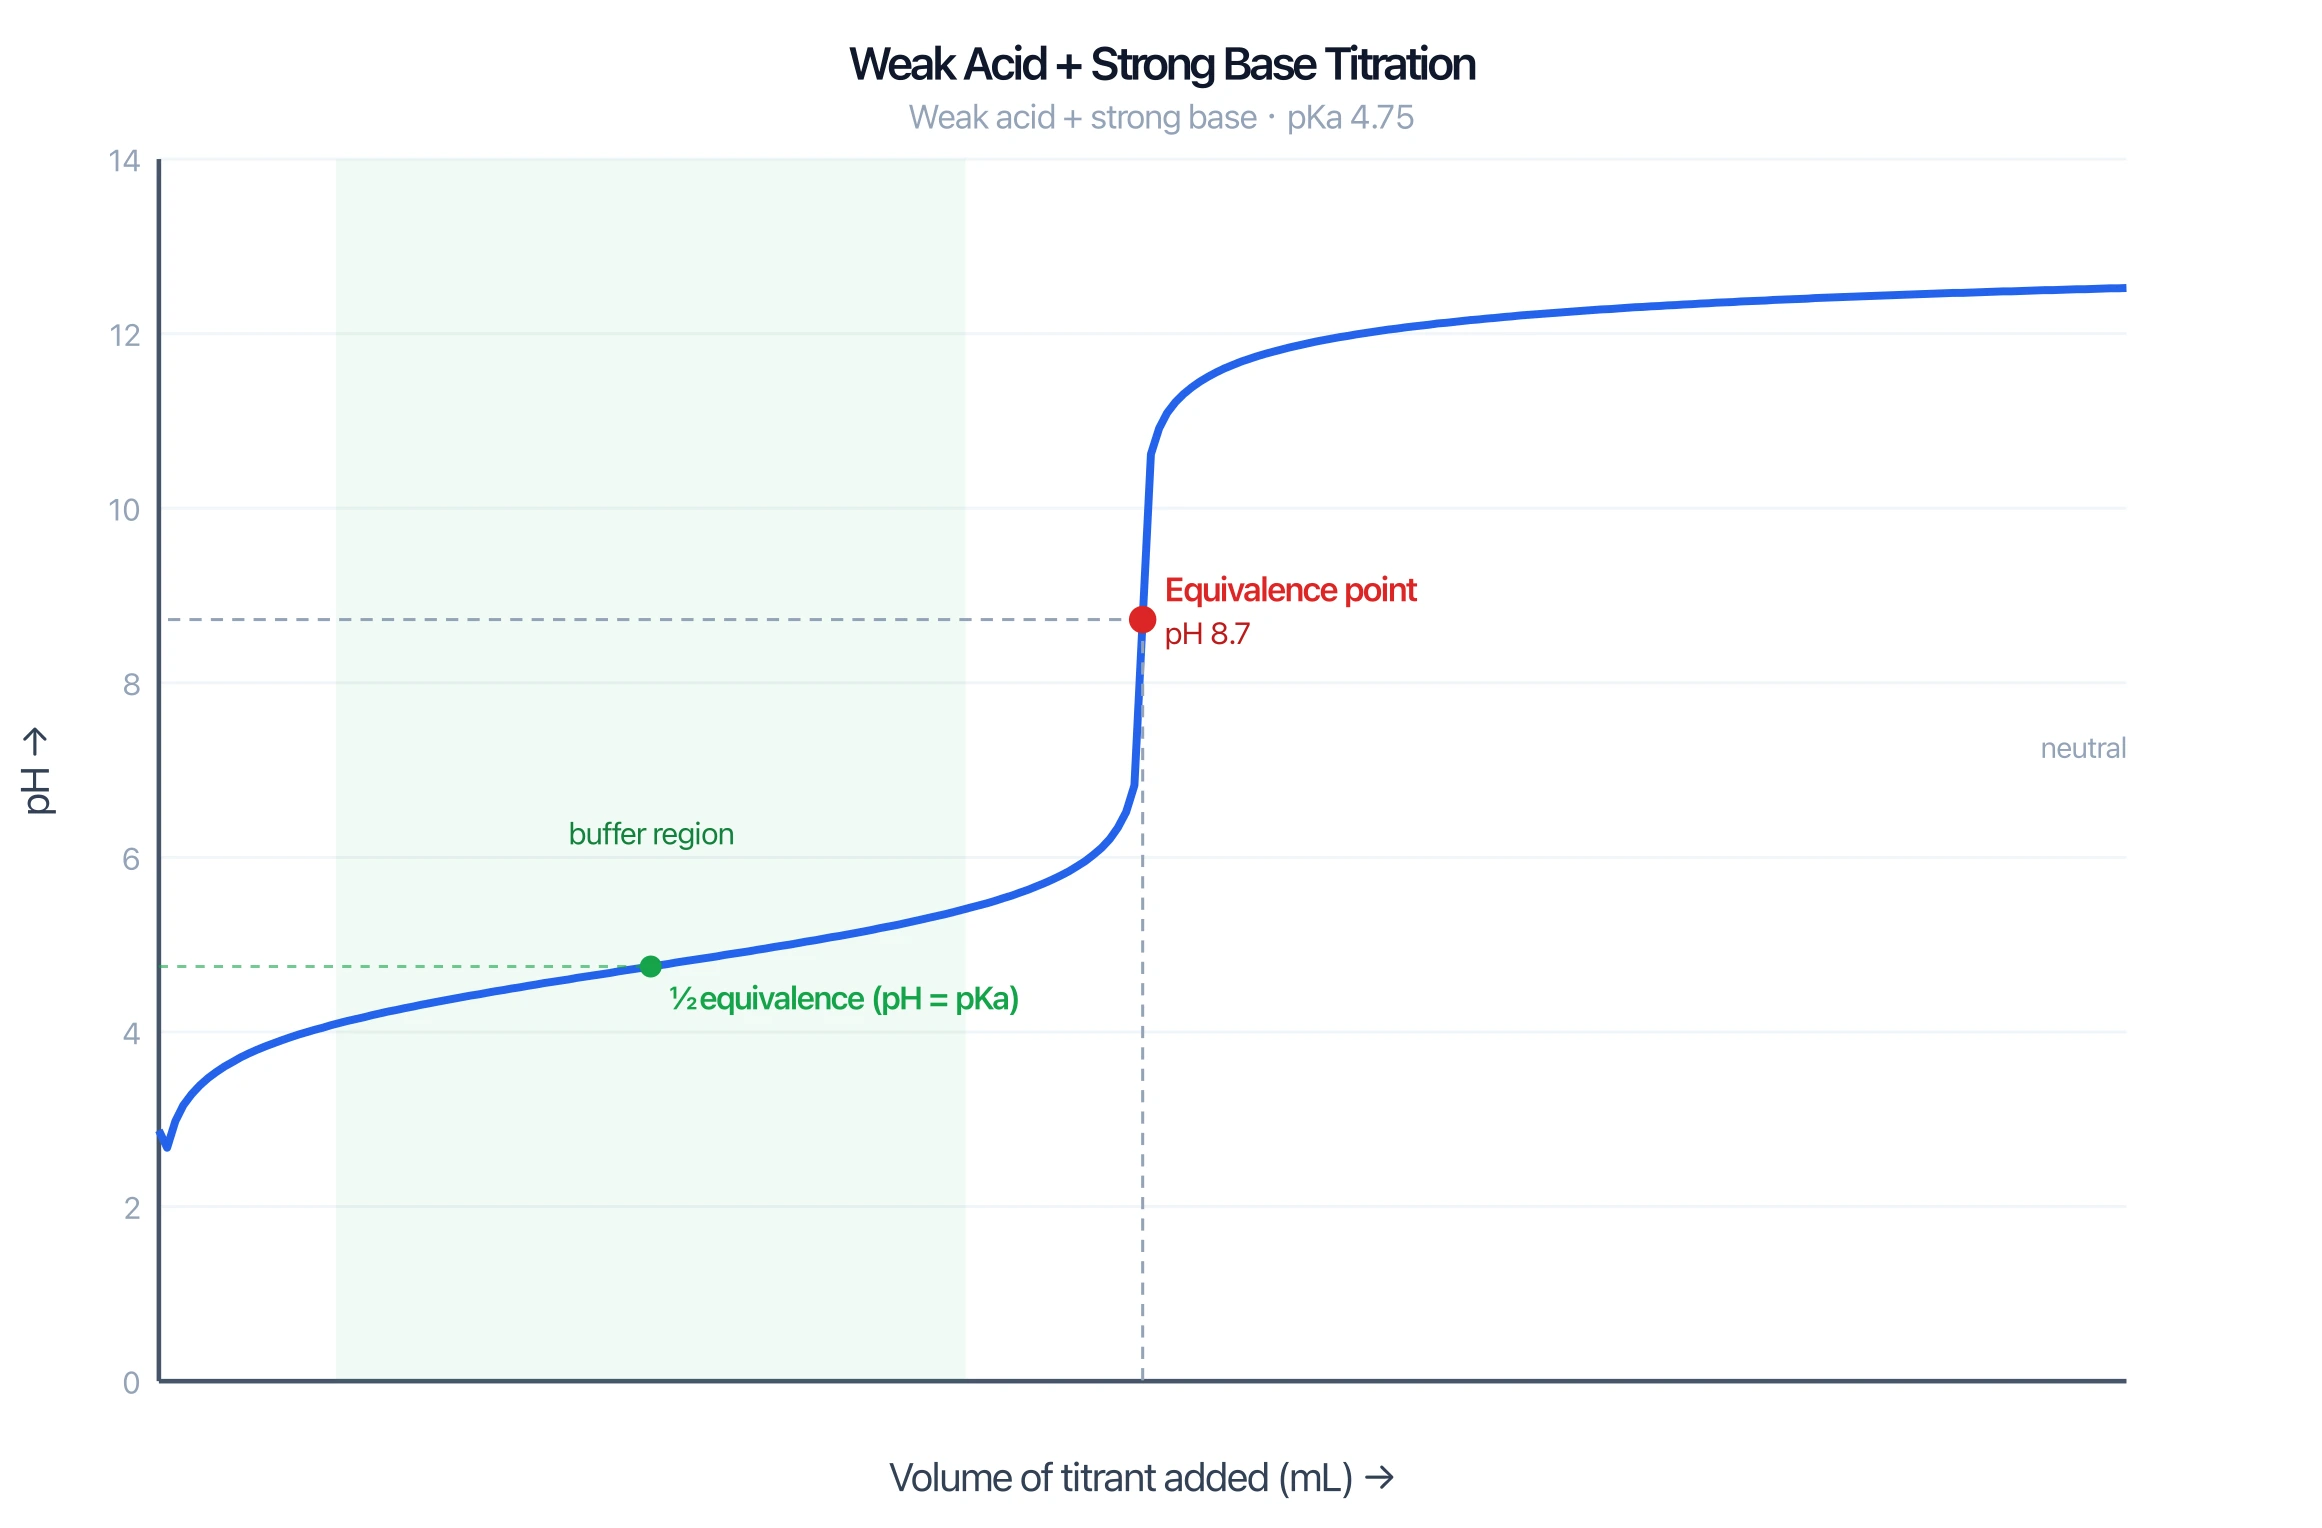
Titration Curve Generator
pH vs titrant volume with equivalence and buffer regions.
 Chemistry
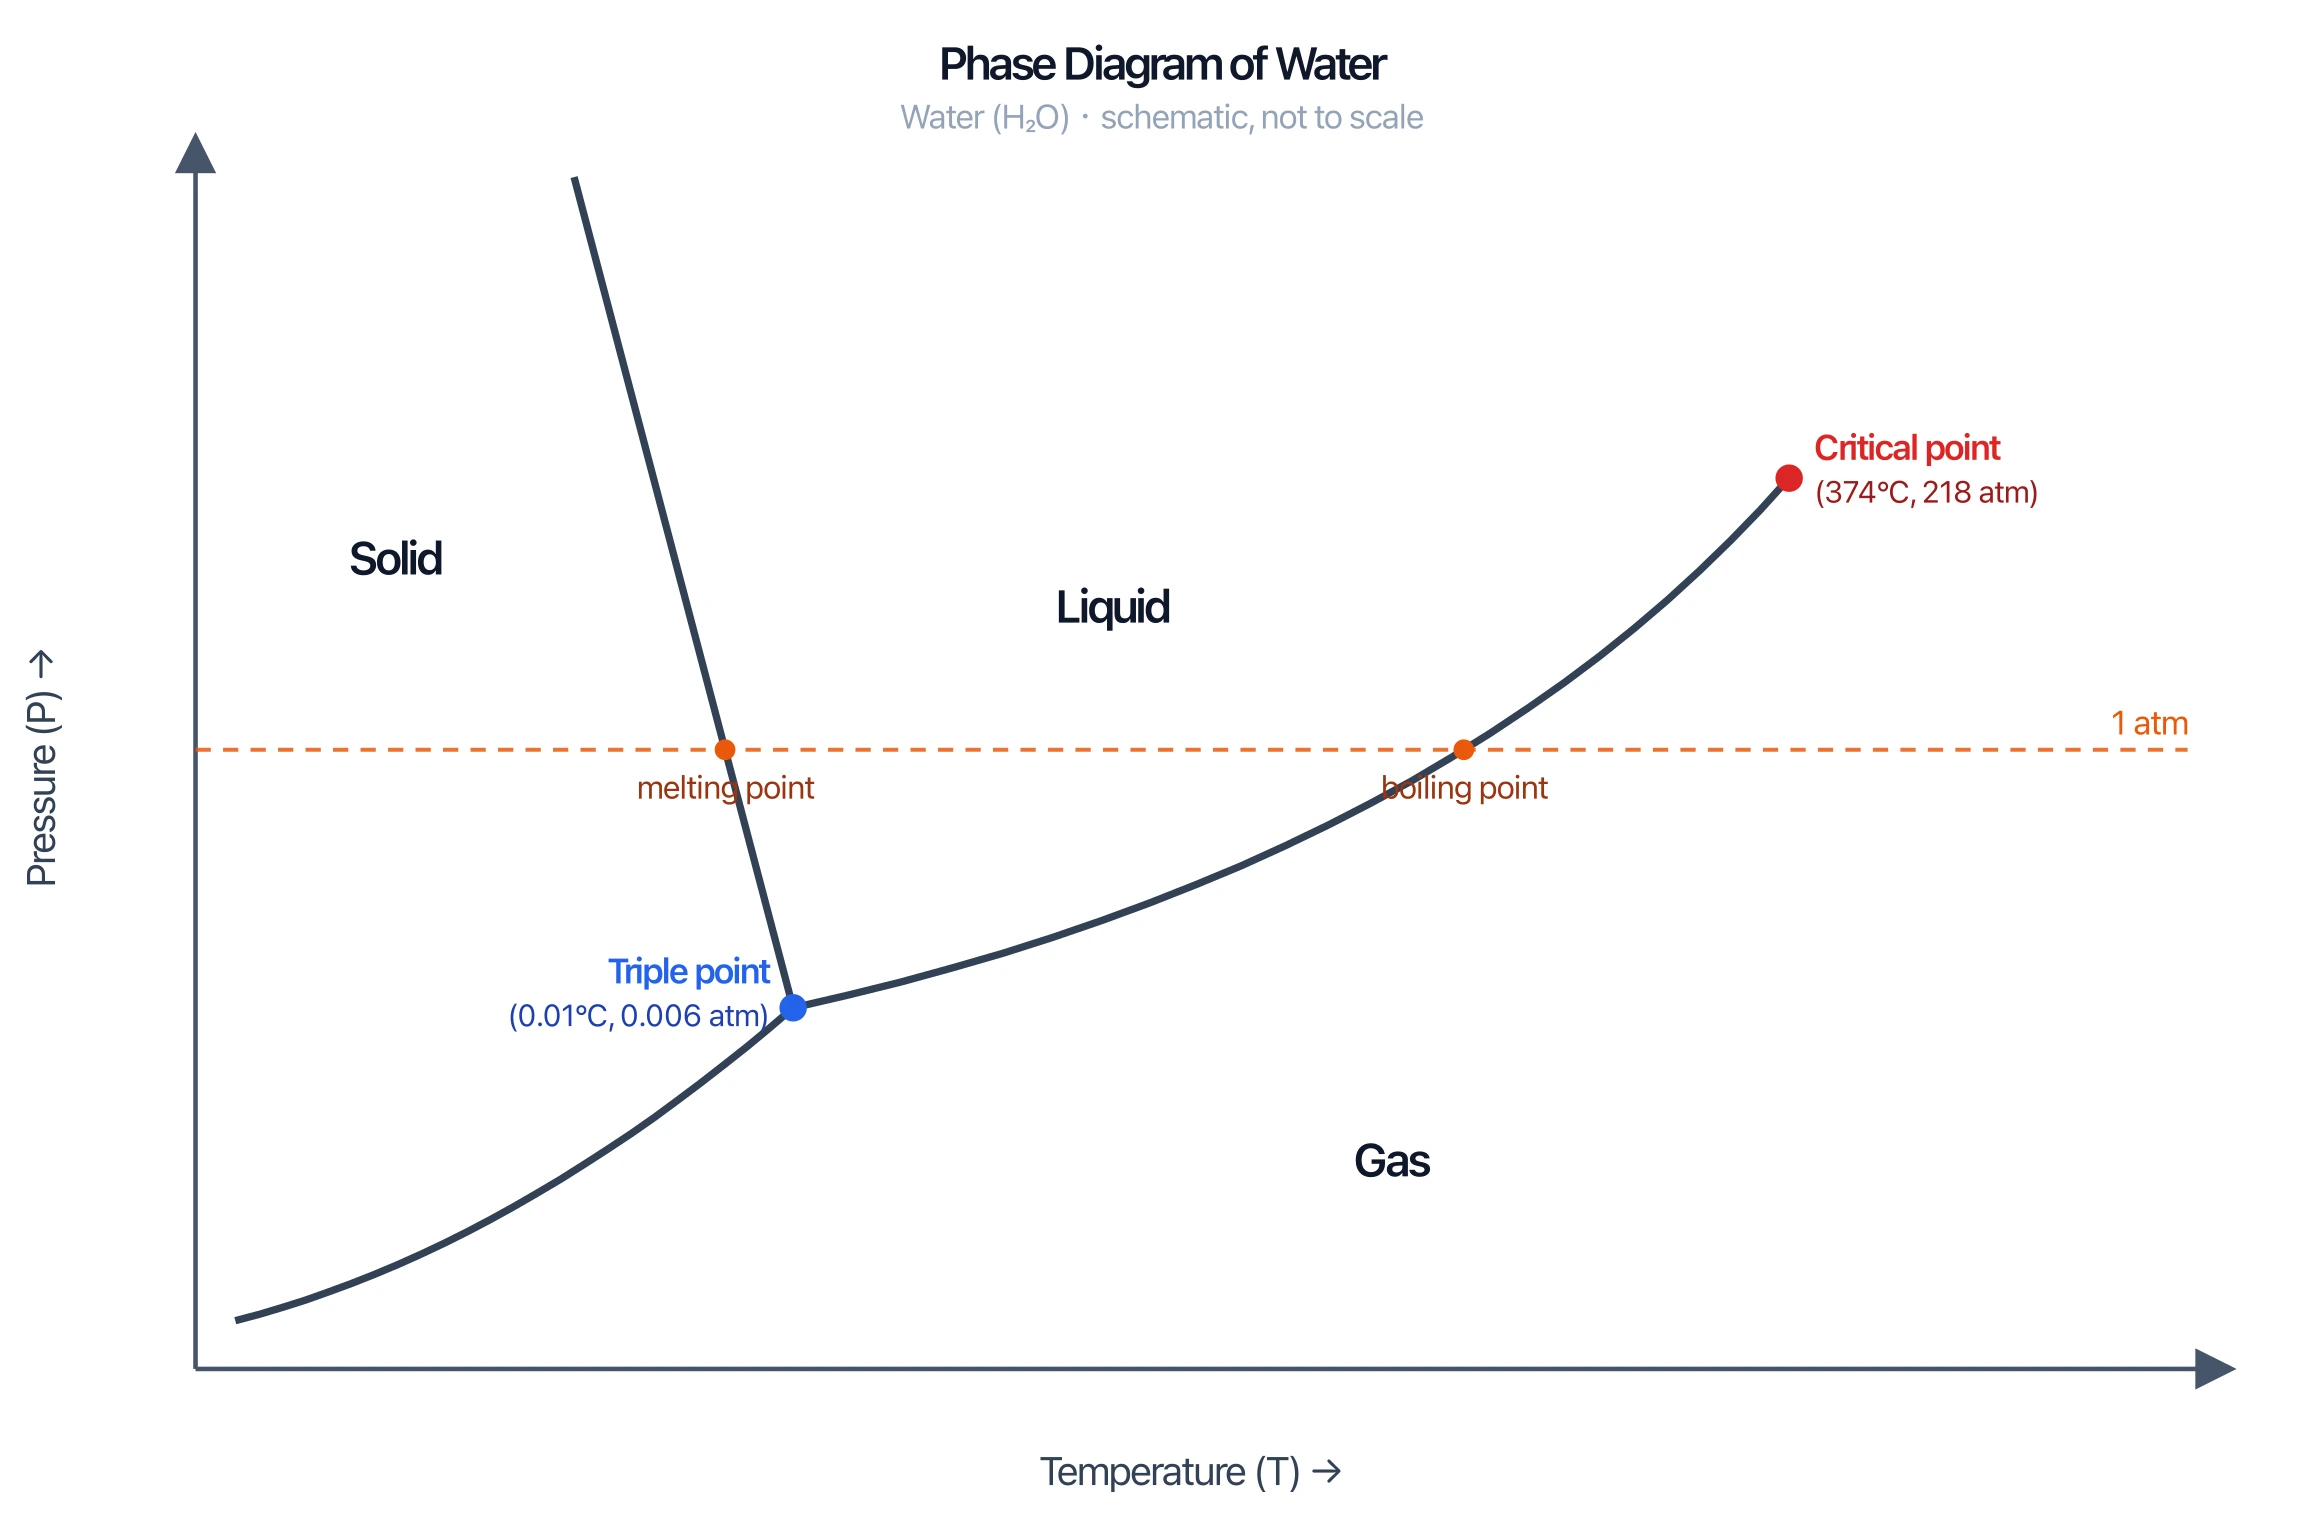
Phase Diagram Generator
Pressure–temperature phase diagrams with triple and critical points.
 Chemistry
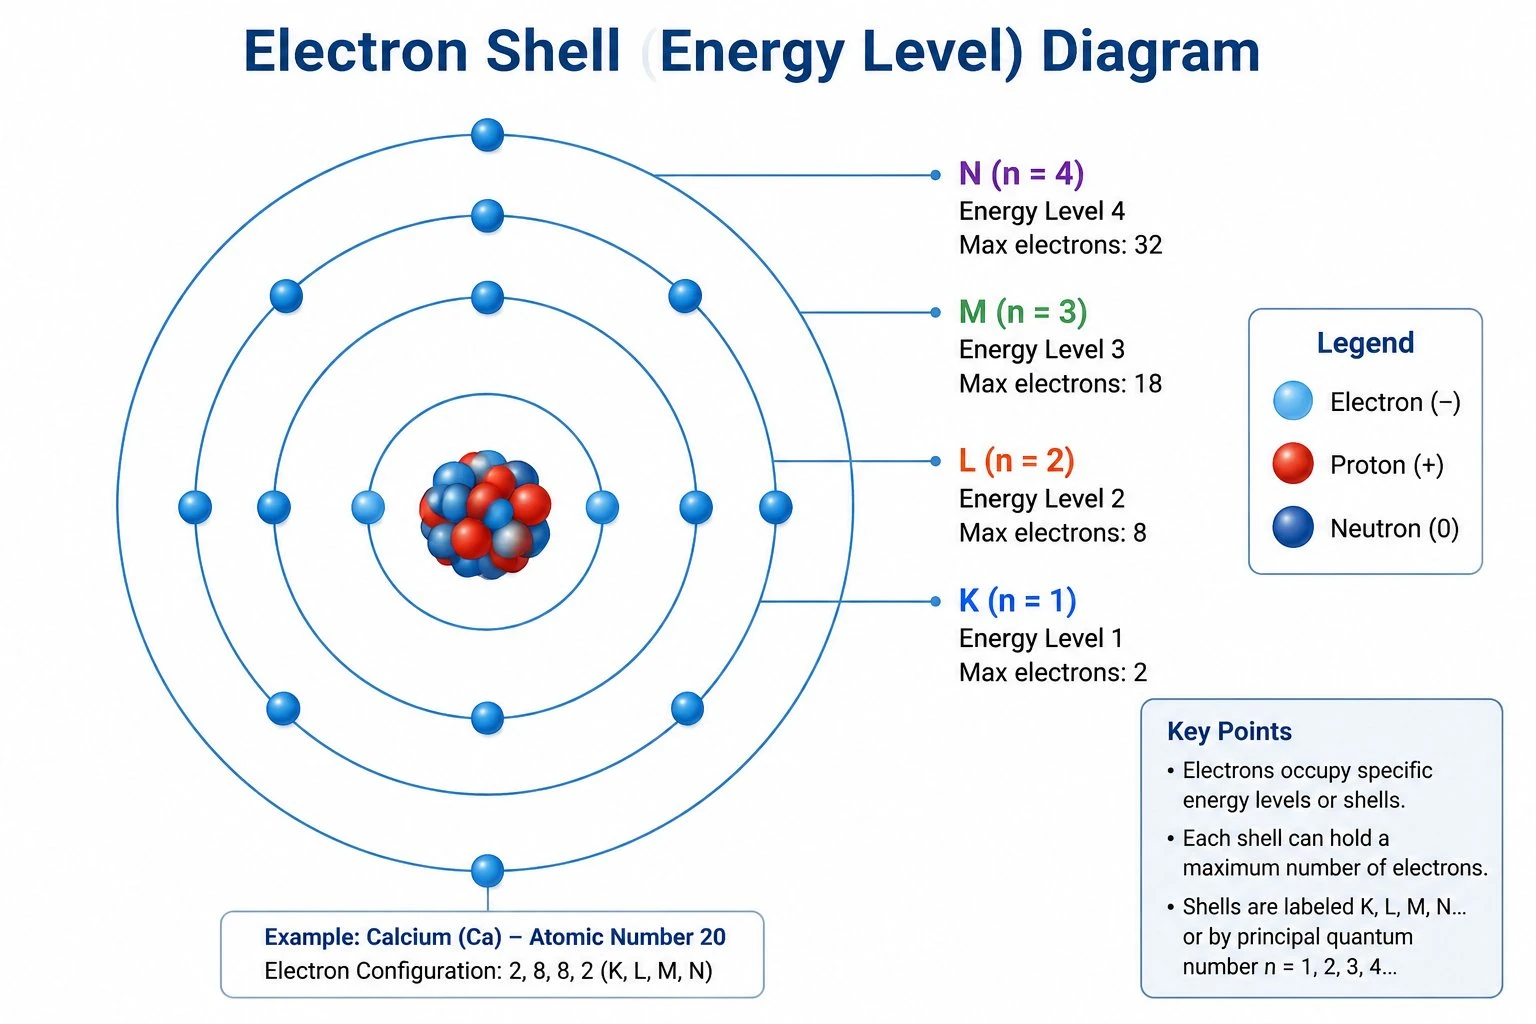
Bohr Model Maker
Electron shell diagrams for any element.