Confusion Matrix Generator with Metrics
Free confusion matrix generator — enter your classification counts for a labeled matrix with accuracy, precision, recall, and F1. Binary or multi-class.
Enter your counts — renders an exact confusion matrix with accuracy, precision, recall & F1, free
Counts — rows = true class, columns = predicted
| Positive | |||
| Negative |
Confusion Matrix Generator
Free to try ·
Your AI confusion matrix figure will appear here
For an exact matrix with computed metrics, use the Precise Matrix tab instead
Confusion Matrix Examples
Exact engine renders — binary and multi-class, with computed metrics
Binary Classifier
Exact engine render — a 2×2 binary matrix with the full metrics panel.
Multi-Class Classifier
Exact engine render — a 3×3 multi-class matrix with per-class metrics and macro averages.
Medical Diagnostic Test
Exact engine render — a diagnostic test where sensitivity and specificity matter.
Sentiment Analysis
Exact engine render — a positive/neutral/negative sentiment classifier.
Image Classification
Exact engine render — a five-class image classifier heatmap.
Fraud Detection
Exact engine render — an imbalanced fraud model where precision and recall matter more than accuracy.
What is a confusion matrix?
A confusion matrix is a table that shows how well a classification model performs by comparing its predicted labels against the true labels. Each row is a true (actual) class and each column is a predicted class, so the cell where they meet holds the number of cases with that true label that the model predicted as that class. The diagonal holds the correct predictions; everything off the diagonal is a mistake — hence "confusion." It works for a binary classifier (a 2×2 matrix of true positives, false positives, false negatives, and true negatives) and for any multi-class problem (an N×N matrix). This generator draws the matrix and computes the standard metrics from the counts you enter.
True positives, false positives, false negatives, true negatives
- True Positive (TP): the model predicted positive and the true label is positive — a correct hit.
- False Positive (FP): the model predicted positive but the true label is negative — a false alarm (Type I error).
- False Negative (FN): the model predicted negative but the true label is positive — a miss (Type II error).
- True Negative (TN): the model predicted negative and the true label is negative — a correct rejection.
The metrics: accuracy, precision, recall, and F1
Accuracy = (TP + TN) / (TP + FP + FN + TN) — the share of all predictions that were correct. Precision = TP / (TP + FP) — of everything predicted positive, how much really was positive. Recall (also called sensitivity or the true positive rate) = TP / (TP + FN) — of all the real positives, how many the model found. Specificity = TN / (TN + FP) — the true negative rate. The F1 score = 2 × (precision × recall) / (precision + recall) is the harmonic mean of precision and recall, useful when classes are imbalanced. For a multi-class matrix, precision, recall, and F1 are computed per class and then averaged (macro average). This tool shows all of these next to the matrix so the downloaded figure is self-contained.
How to make your confusion matrix
- Label your classes — keep the two default classes for a binary model, or add classes for a multi-class problem.
- Enter the counts in the grid: each row is a true class and each column is the predicted class, with the correct predictions on the diagonal.
- Read the metrics panel — accuracy, macro precision/recall/F1, and a per-class breakdown update as you type.
- Download a clean, scalable SVG for your paper, report, notebook, or slides — free, with no sign-up.
Precision vs recall: which matters?
Precision and recall trade off against each other, and which one you optimize depends on the cost of each error. When a false positive is expensive — for example flagging a legitimate email as spam — you want high precision. When a false negative is expensive — for example missing a disease in a screening test — you want high recall (sensitivity). The F1 score balances the two, and a confusion matrix lets you see the raw counts behind them so you can judge the trade-off for your own problem rather than trusting accuracy alone, which can be misleading on imbalanced data.
Frequently Asked Questions
Related Data & Stats Tools
 Research
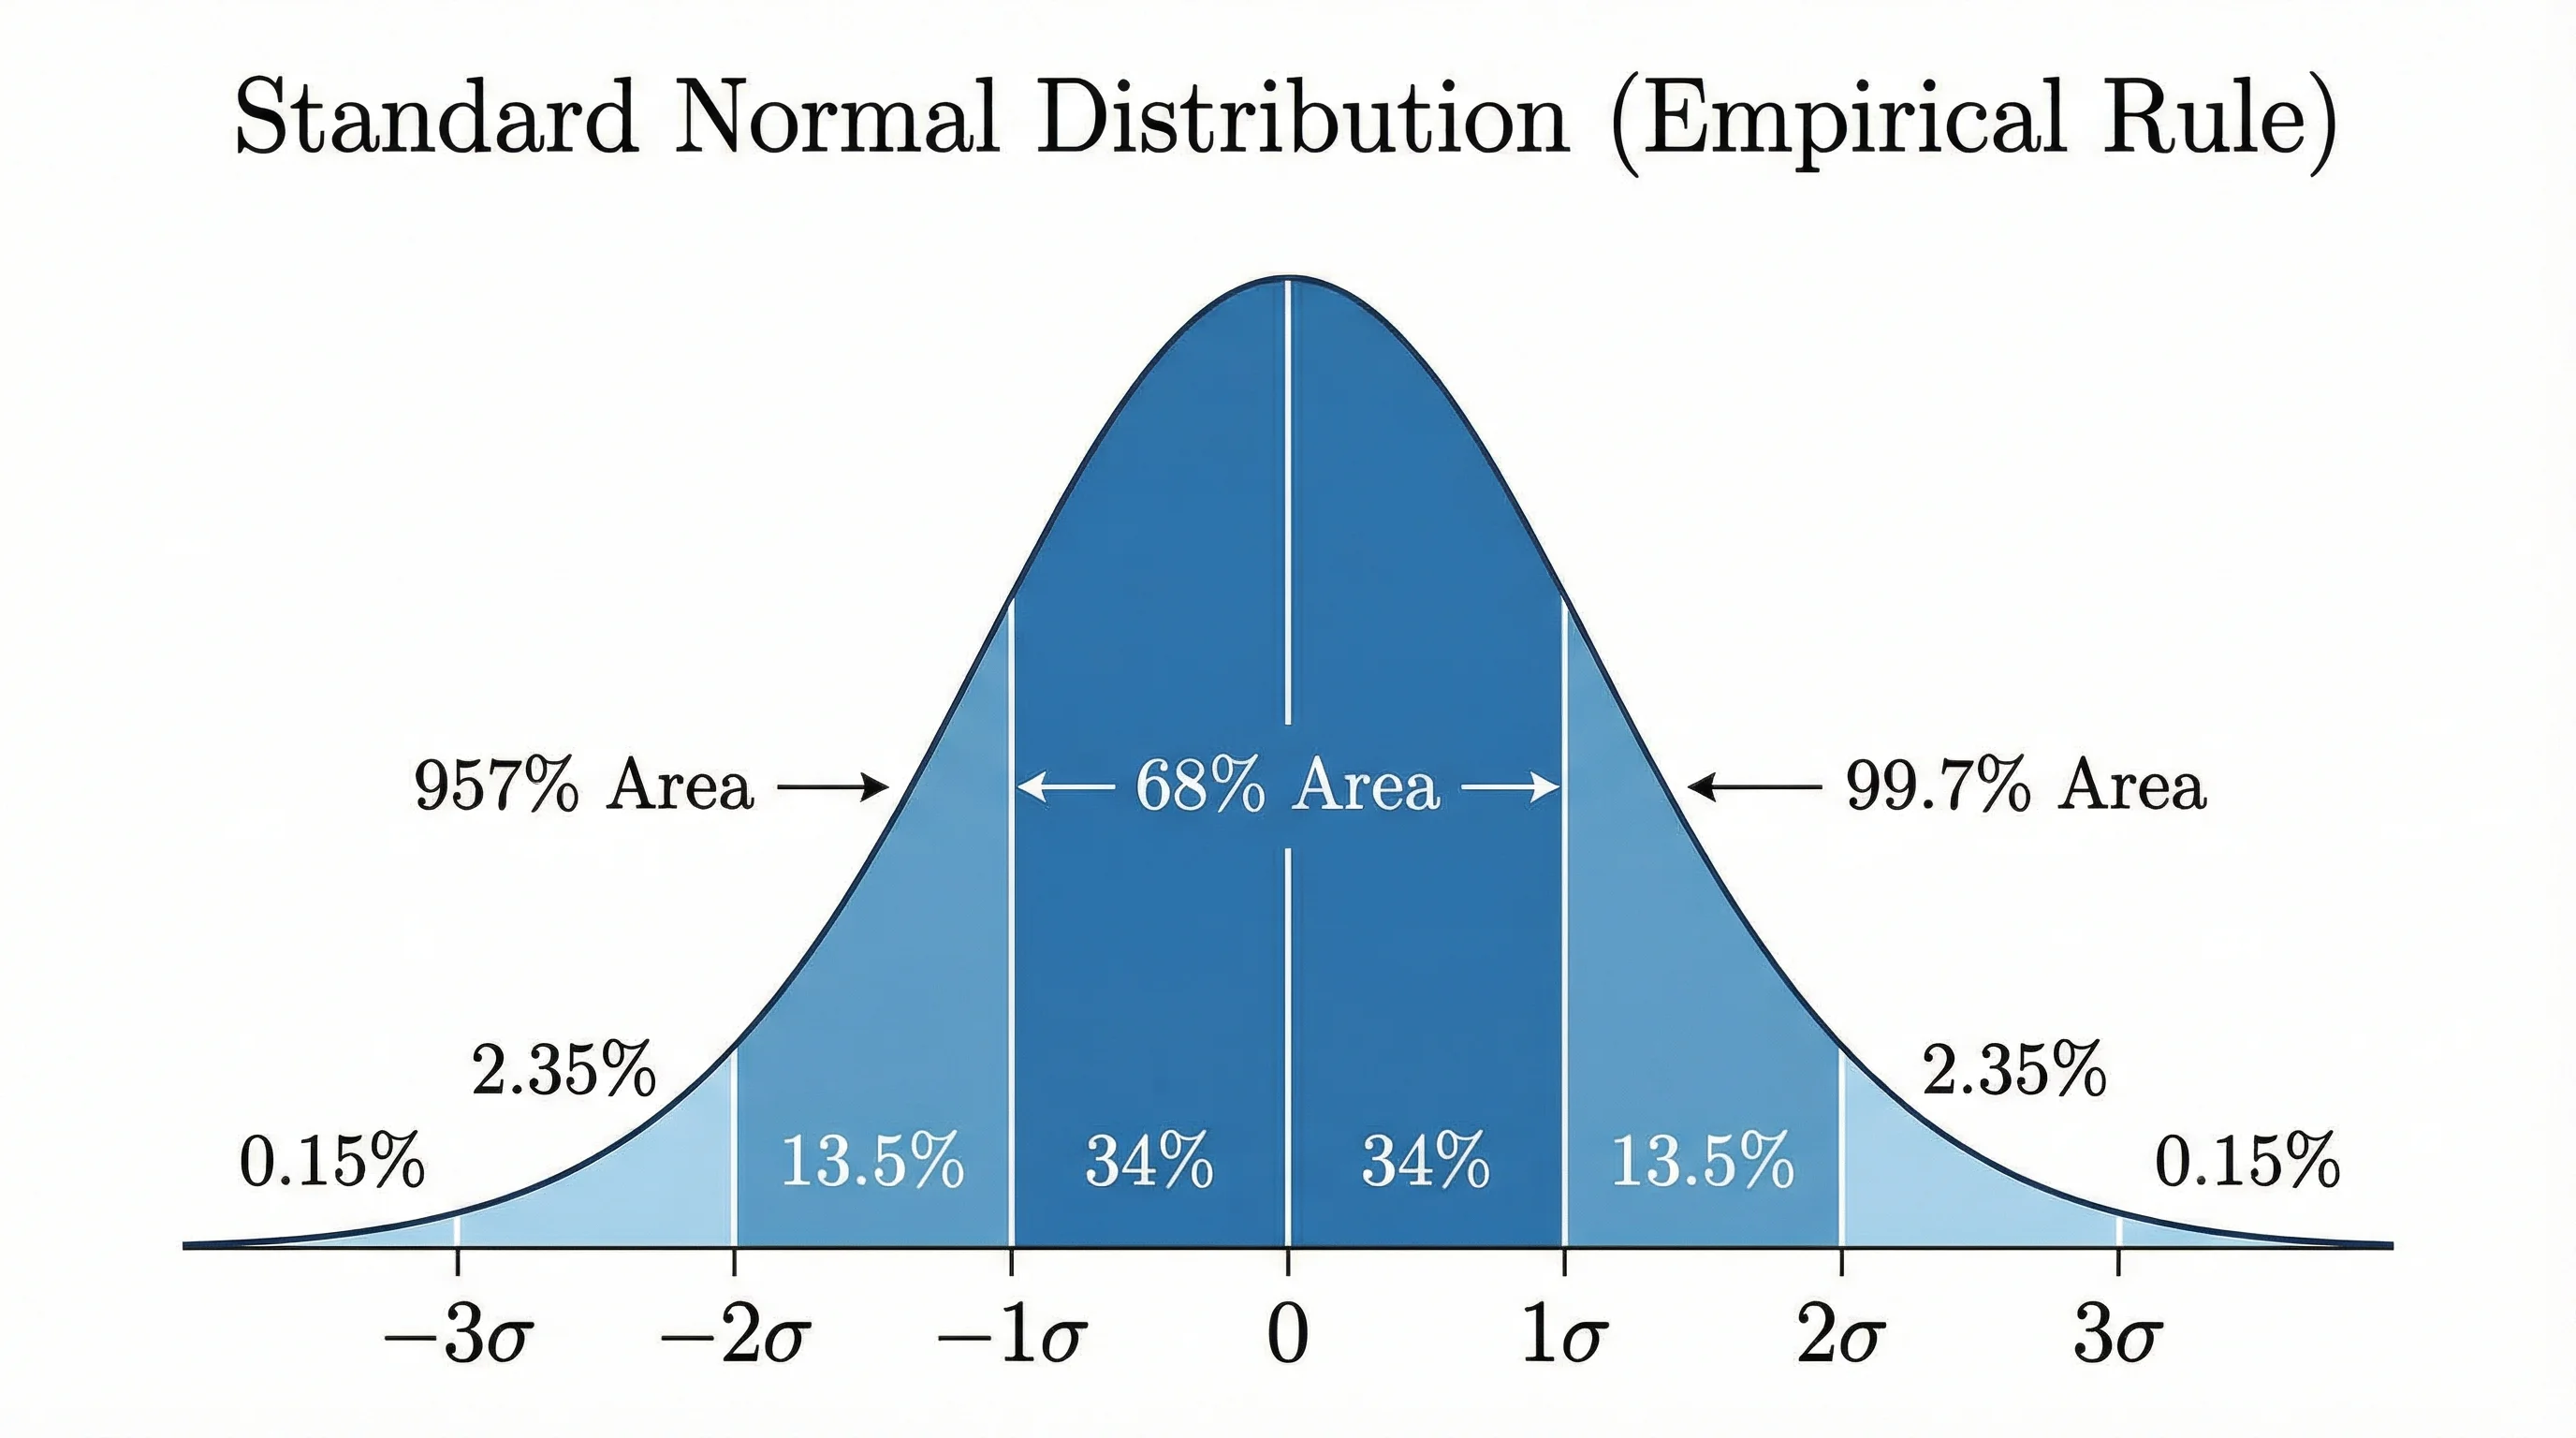
Bell Curve Generator
Plot a normal distribution with shaded areas, z-scores, and standard deviations.
 Research
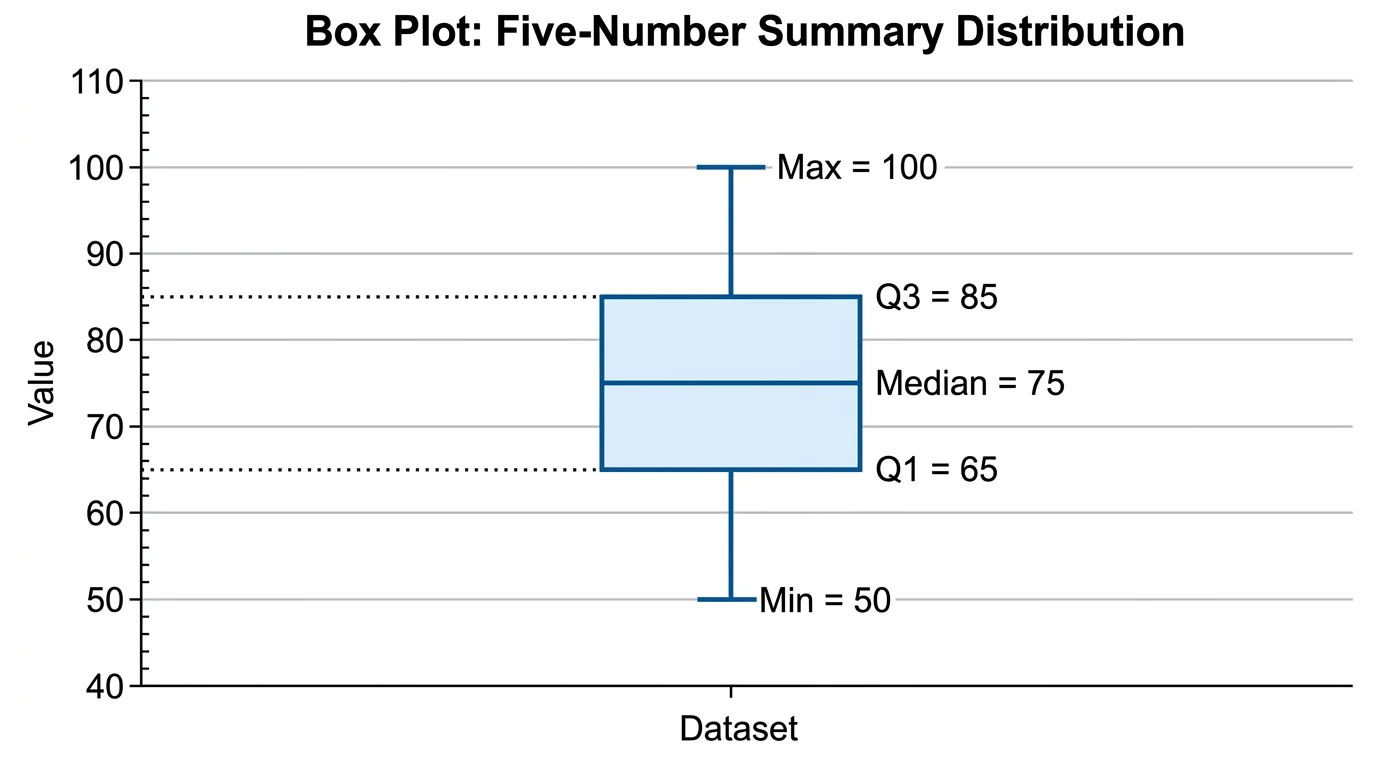
Box Plot Generator
Draw box-and-whisker plots showing quartiles, medians, and outliers.
 Research
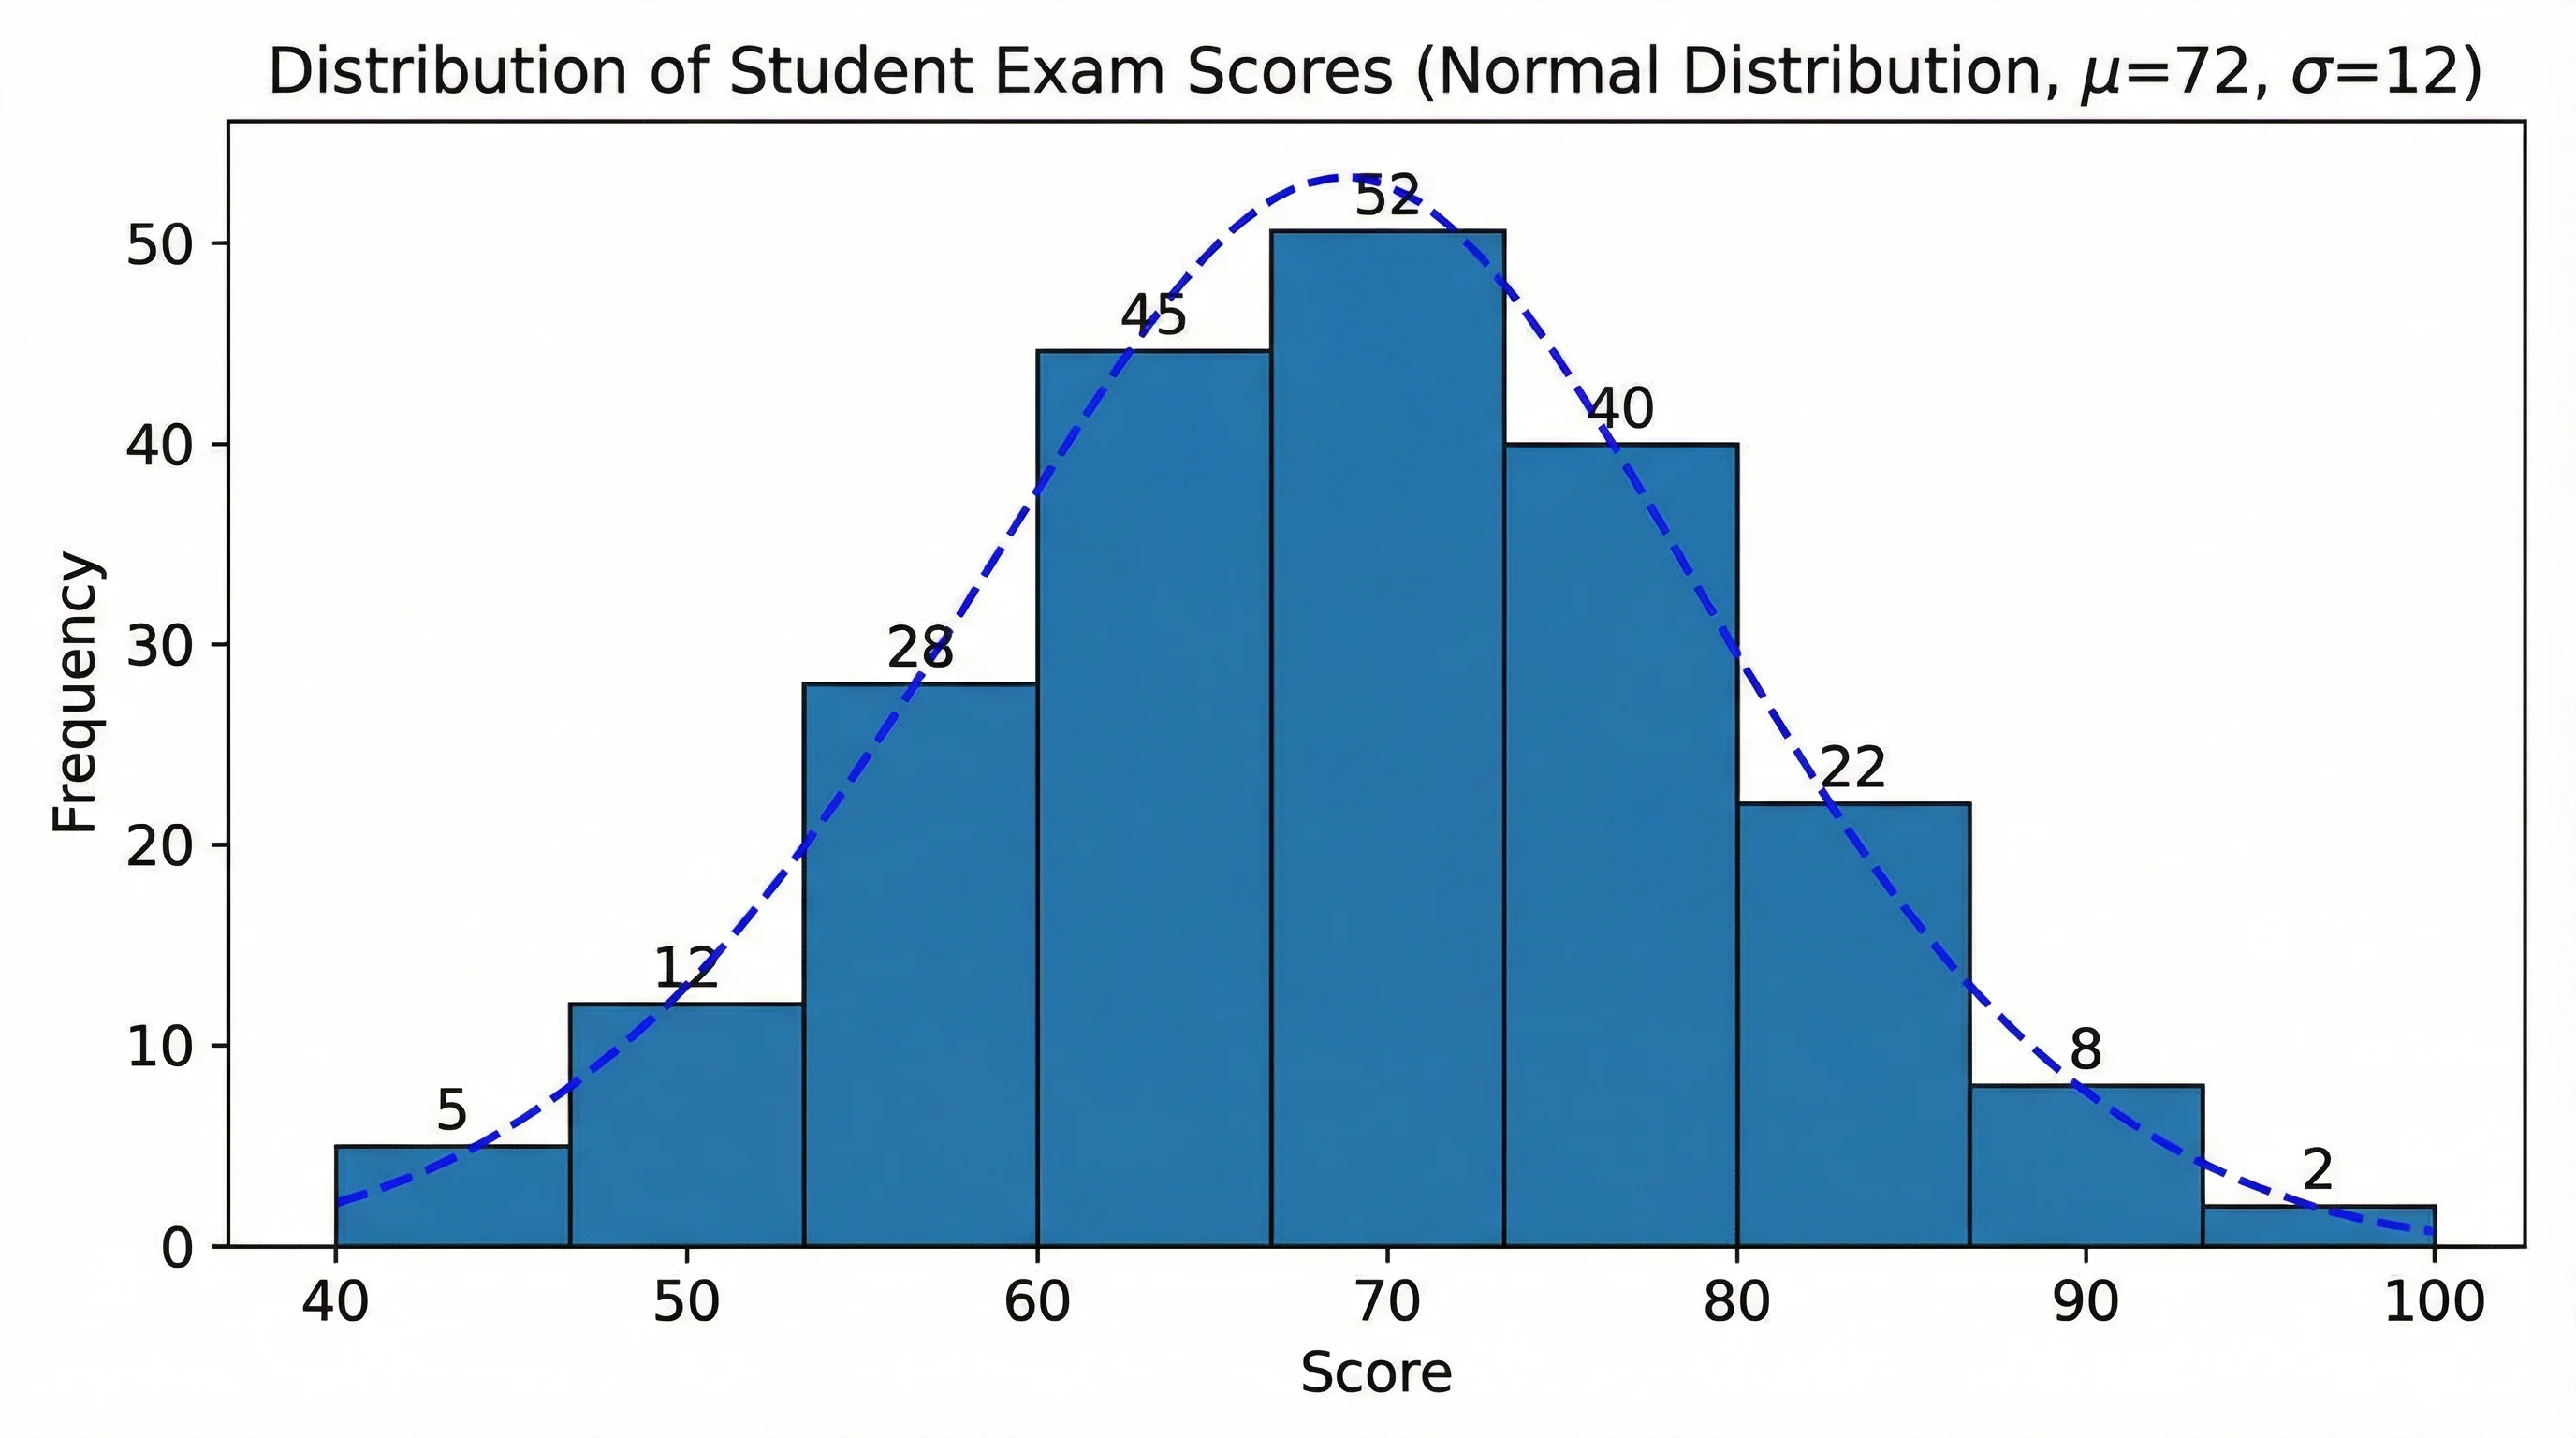
Histogram Maker
Turn a data set into a histogram showing the shape of its distribution.
 Research
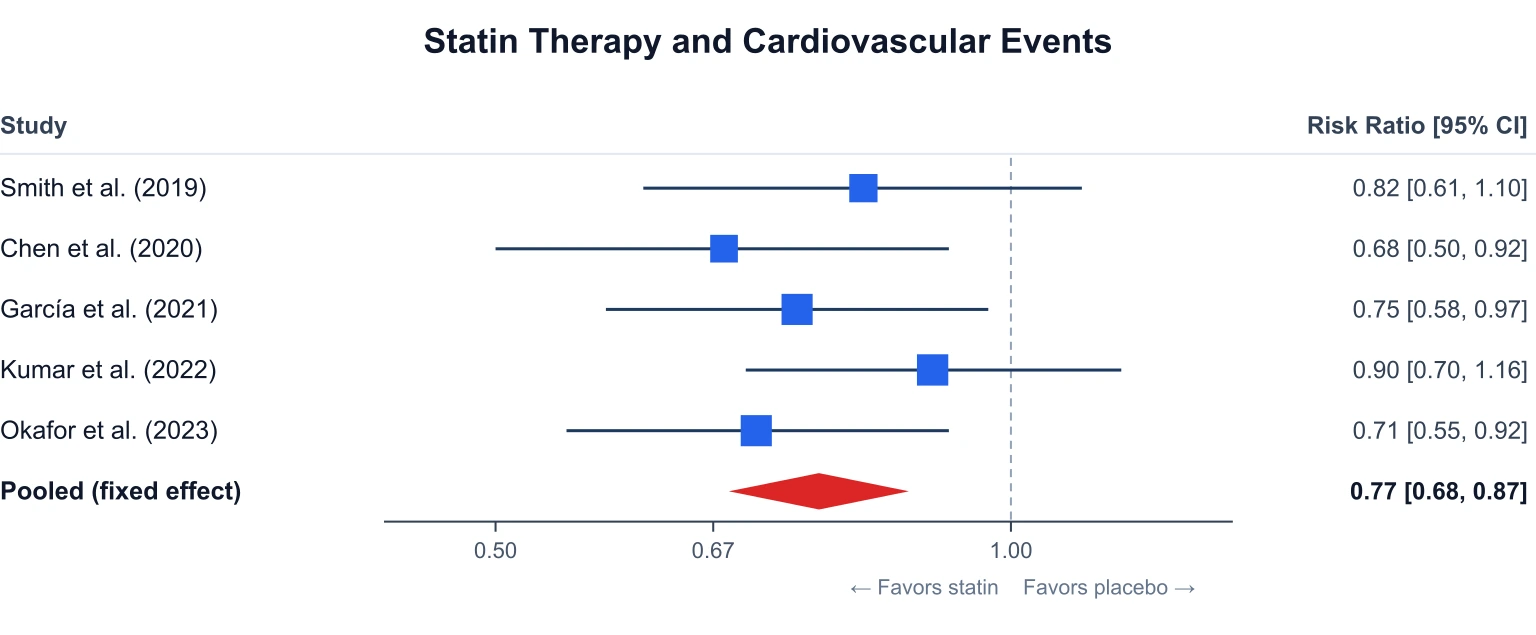
Forest Plot Generator
Plot pooled effect sizes with confidence intervals for a meta-analysis.
 Research
Scatter Plot Maker
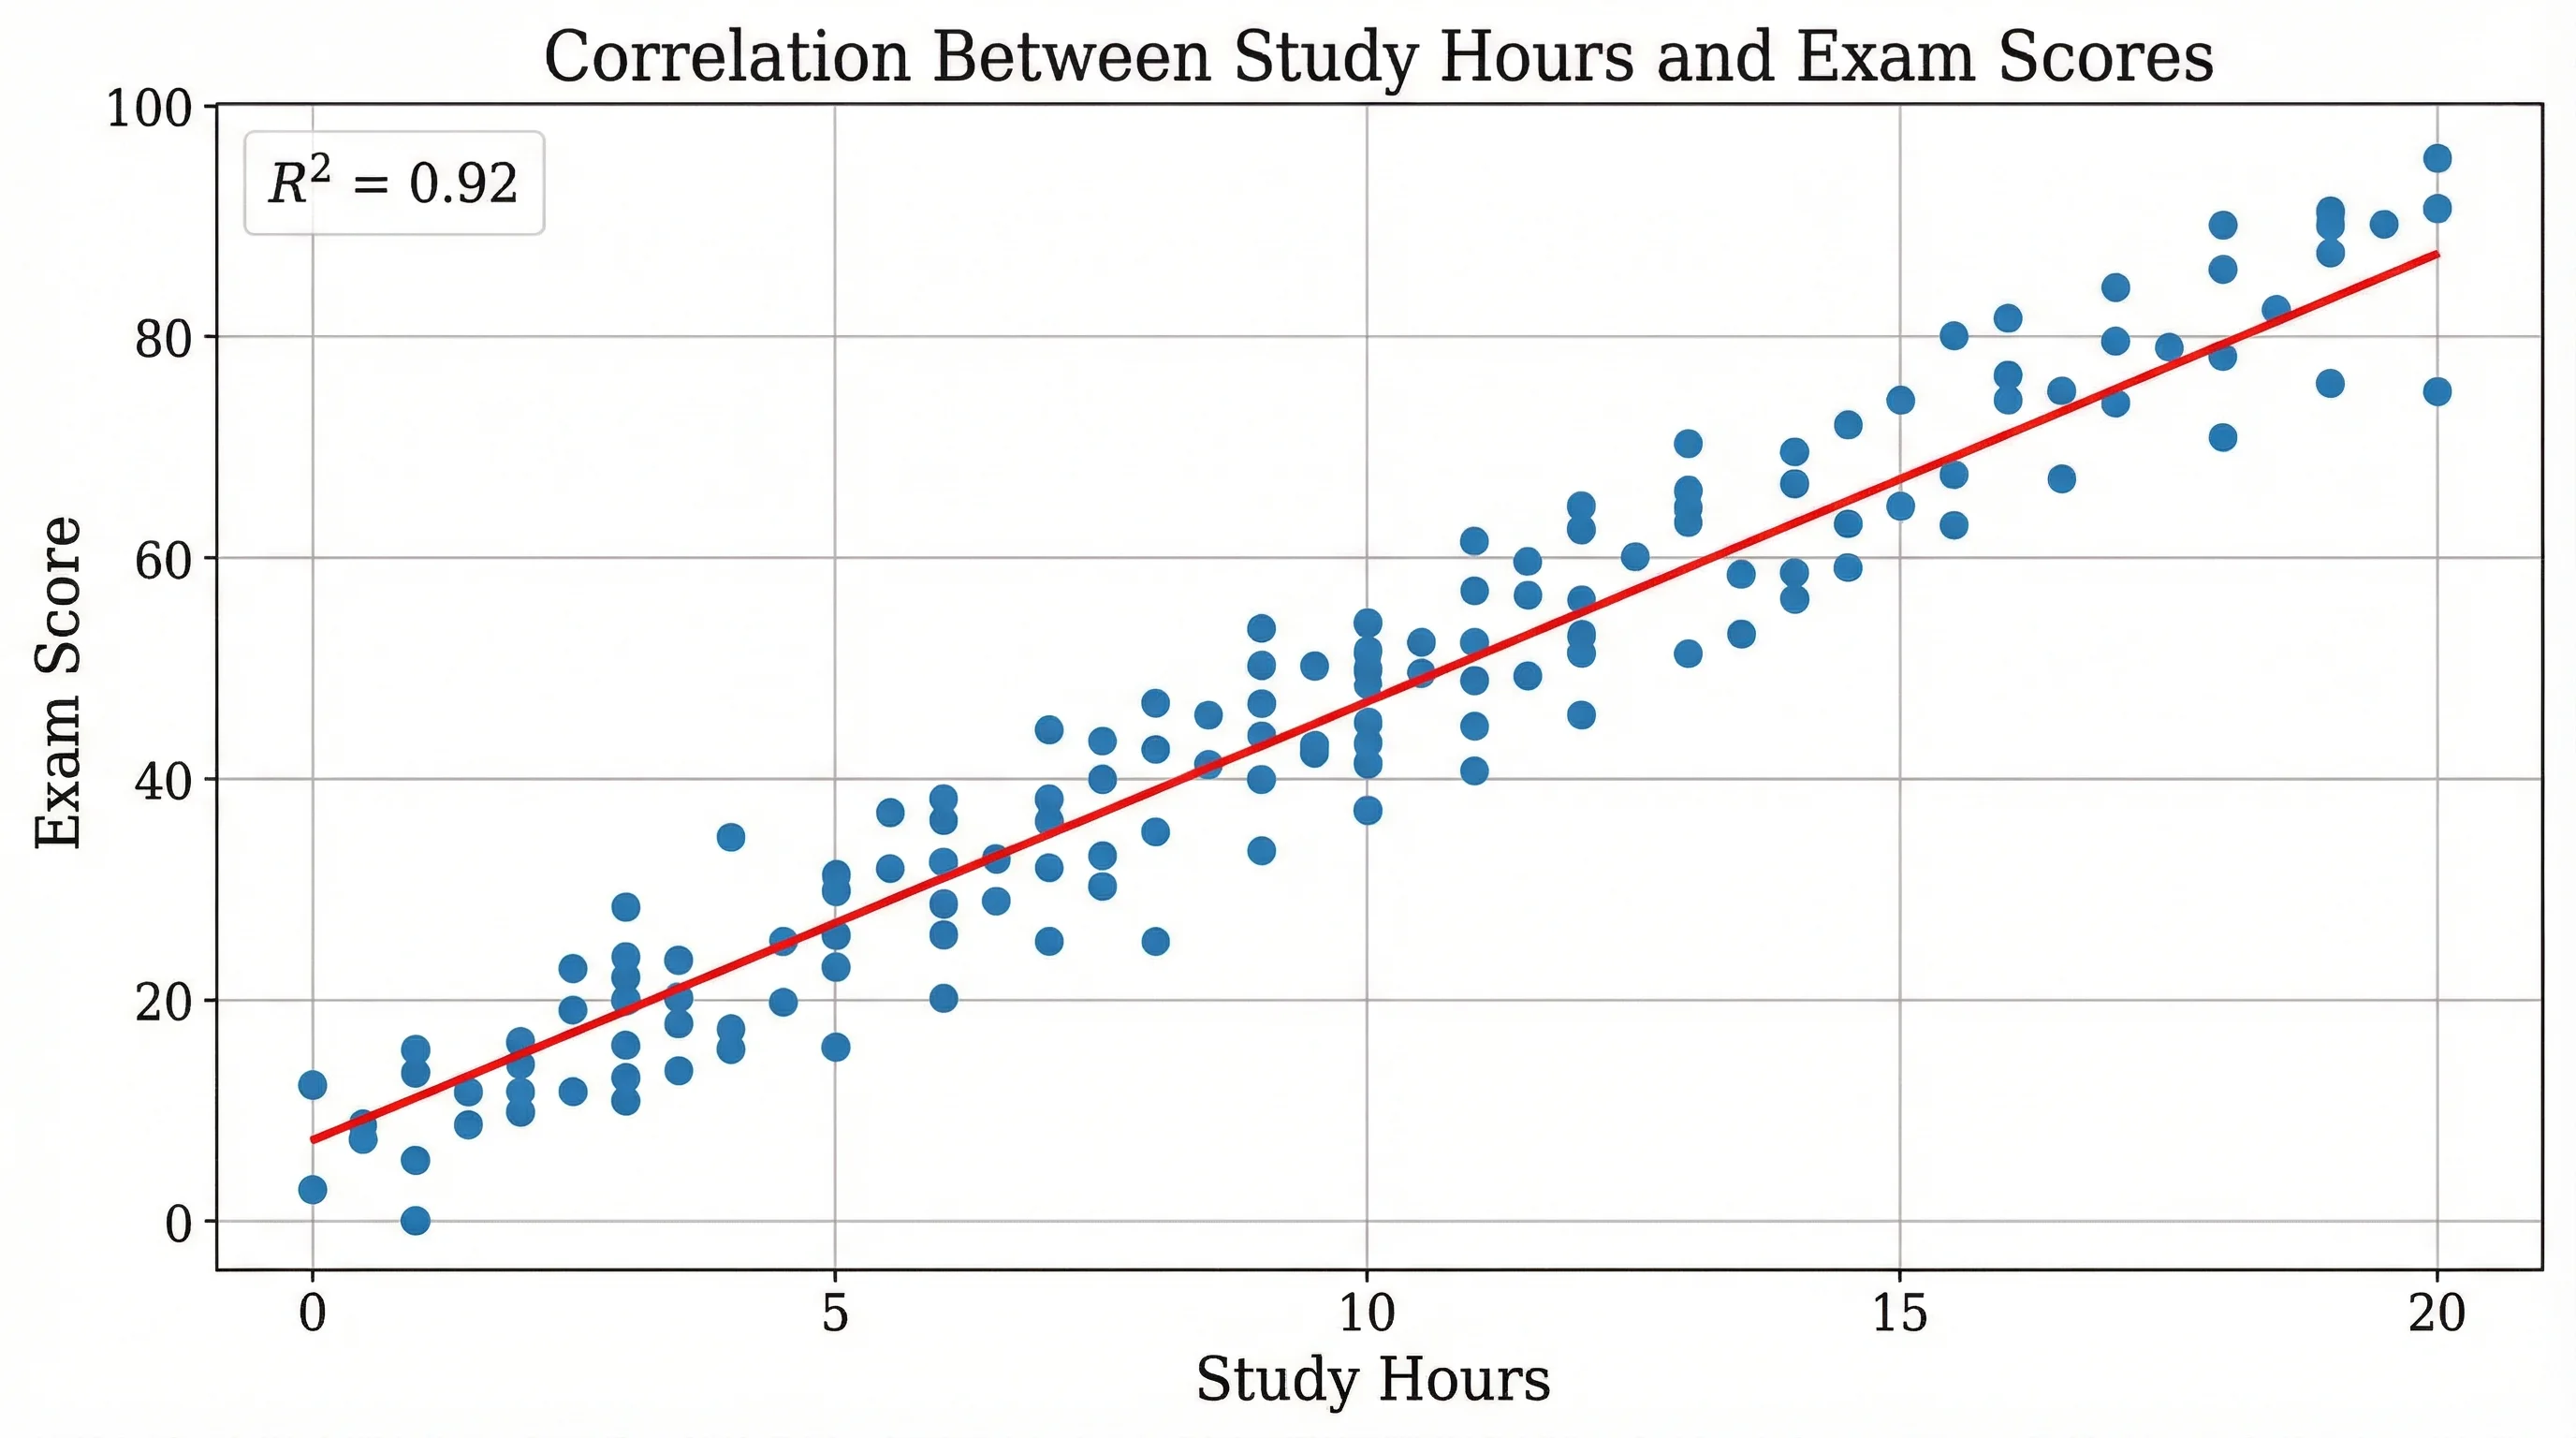
Plot paired data points to reveal correlation and trends between variables.