AIヒストグラム 作成ツール
データを貼り付けるか分布を説明するだけで、AIがプロ仕様のヒストグラムを瞬時に生成します。CSV・Excelの貼り付け・数値入力に対応。
Upload your CSV/Excel data — generates precise charts with real statistical calculations
Histogram Generator
By using ConceptViz, you agree not to generate or edit adult, sexual, explicit, unsafe, or policy-violating content. See Content Policy.
無料で試す ·
Your histogram will appear here
Describe the histogram you want
Histogram Generator
Paste data, upload a file, or use sample data to continue.
By using ConceptViz, you agree not to generate or edit adult, sexual, explicit, unsafe, or policy-violating content. See Content Policy.
無料で試す ·
Your histogram will appear here
Upload data to generate a precise histogram
ヒストグラムの例
AIが作成したプロ仕様のヒストグラム:正規分布から比較度数グラフまで
正規分布ヒストグラム
正規分布したテスト点数を表示するクラシックな釣鐘型ヒストグラム。統計的注釈と度数カウント付き。
右歪み分布
世帯収入分布を示す右歪み(正の歪み)ヒストグラム。経済学・社会科学でよく使用される。
双峰性分布
2つの明確に分離したピークを持つ双峰性ヒストグラム。データセット内の2つの異なるサブグループを示す。
比較ヒストグラム
複数カテゴリの分布を比較する重ね合わせヒストグラム。グループ間の差異を示すのに最適。
降水量度数グラフ
累積パーセント曲線付きの降水量度数ヒストグラム。地理学・環境科学でよく使用される。
論文品質ヒストグラム
軸ラベル・サンプルサイズ・統計的注釈を含む学術誌対応の論文品質ヒストグラム。
ヒストグラムとは?
ヒストグラムとは、数値データの度数分布をグラフで表した図です。隣接する棒を使ってデータ点が指定された範囲(ビンまたは区間)にどのように分布するかを示します。各棒の高さはその範囲内の観測数に対応します。離散カテゴリを比較する棒グラフとは異なり、ヒストグラムは連続データの分布形状を表示し、正規分布・歪み・双峰性・外れ値などのパターンを明らかにします。ヒストグラムは統計学・科学研究・品質管理・データドリブンな意思決定において不可欠なツールです。
ヒストグラムの主要構成要素
- ビン(区間):データを分割する連続した範囲。ビンの数と幅が分布の見え方に影響する
- 度数(Y軸):各ビン内に属するデータ点の個数または割合
- 連続X軸:棒間に隙間のない、プロットされる変数の測定スケールを表す
- 分布形状:データが対称・歪み・一様・多峰性のどれかを明らかにする
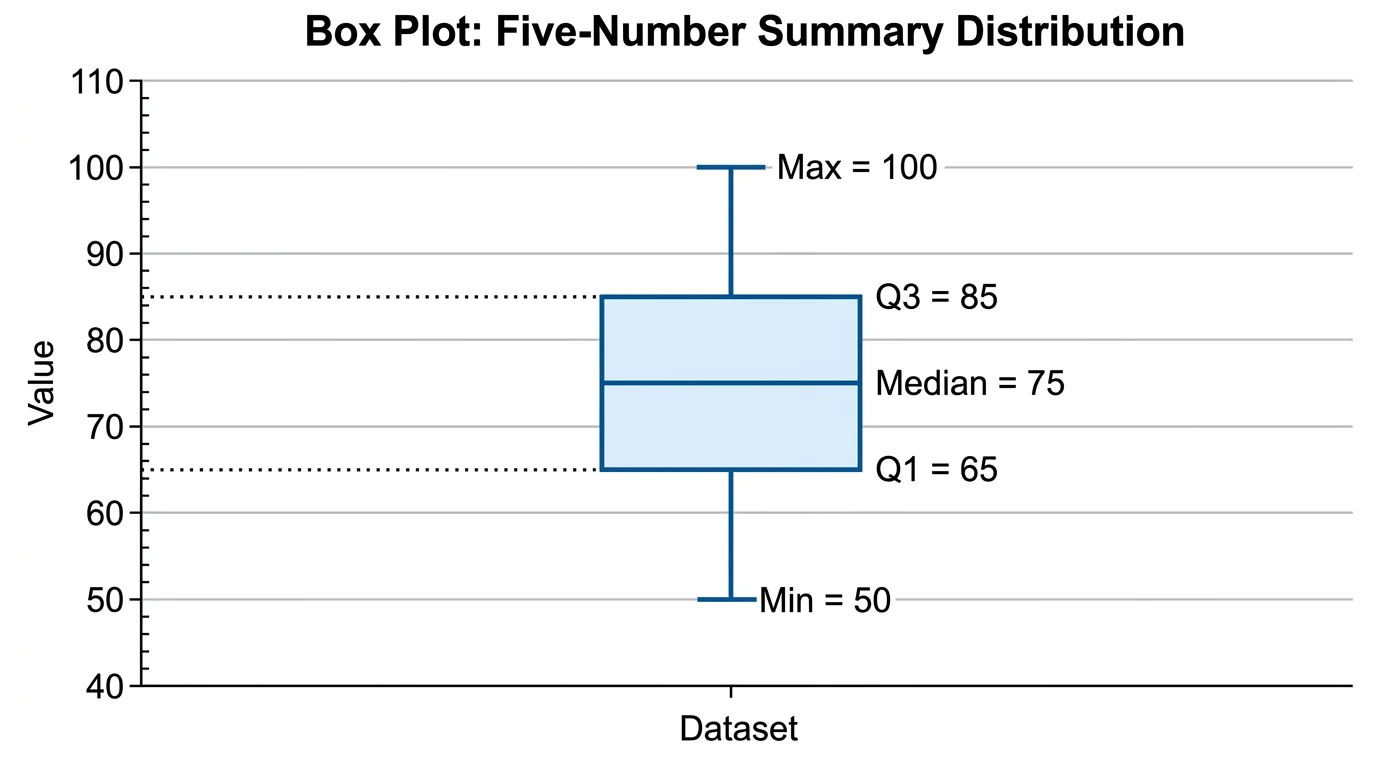
- 注釈:平均・中央値・標準偏差の線とサンプルサイズが読者のデータ解釈を助ける
- 累積曲線:ビン全体の累計パーセンテージを示すオジーブ線(オプション)
ヒストグラムと棒グラフの違い
どちらも棒を使いますが、ヒストグラムと棒グラフは異なる目的に使われます。ヒストグラムは1つの連続変数の度数分布を表示し、棒は隣接(接触)しています。棒グラフは離散カテゴリを棒間の隙間で比較します。ヒストグラムは分布形状・歪み・広がりを明らかにし、棒グラフは独立したグループ間の大きさを比較します。学術・科学的文脈では、正確なデータ表現と明確なコミュニケーションのために適切なグラフの種類を使用することが重要です。
代表的な分布形状
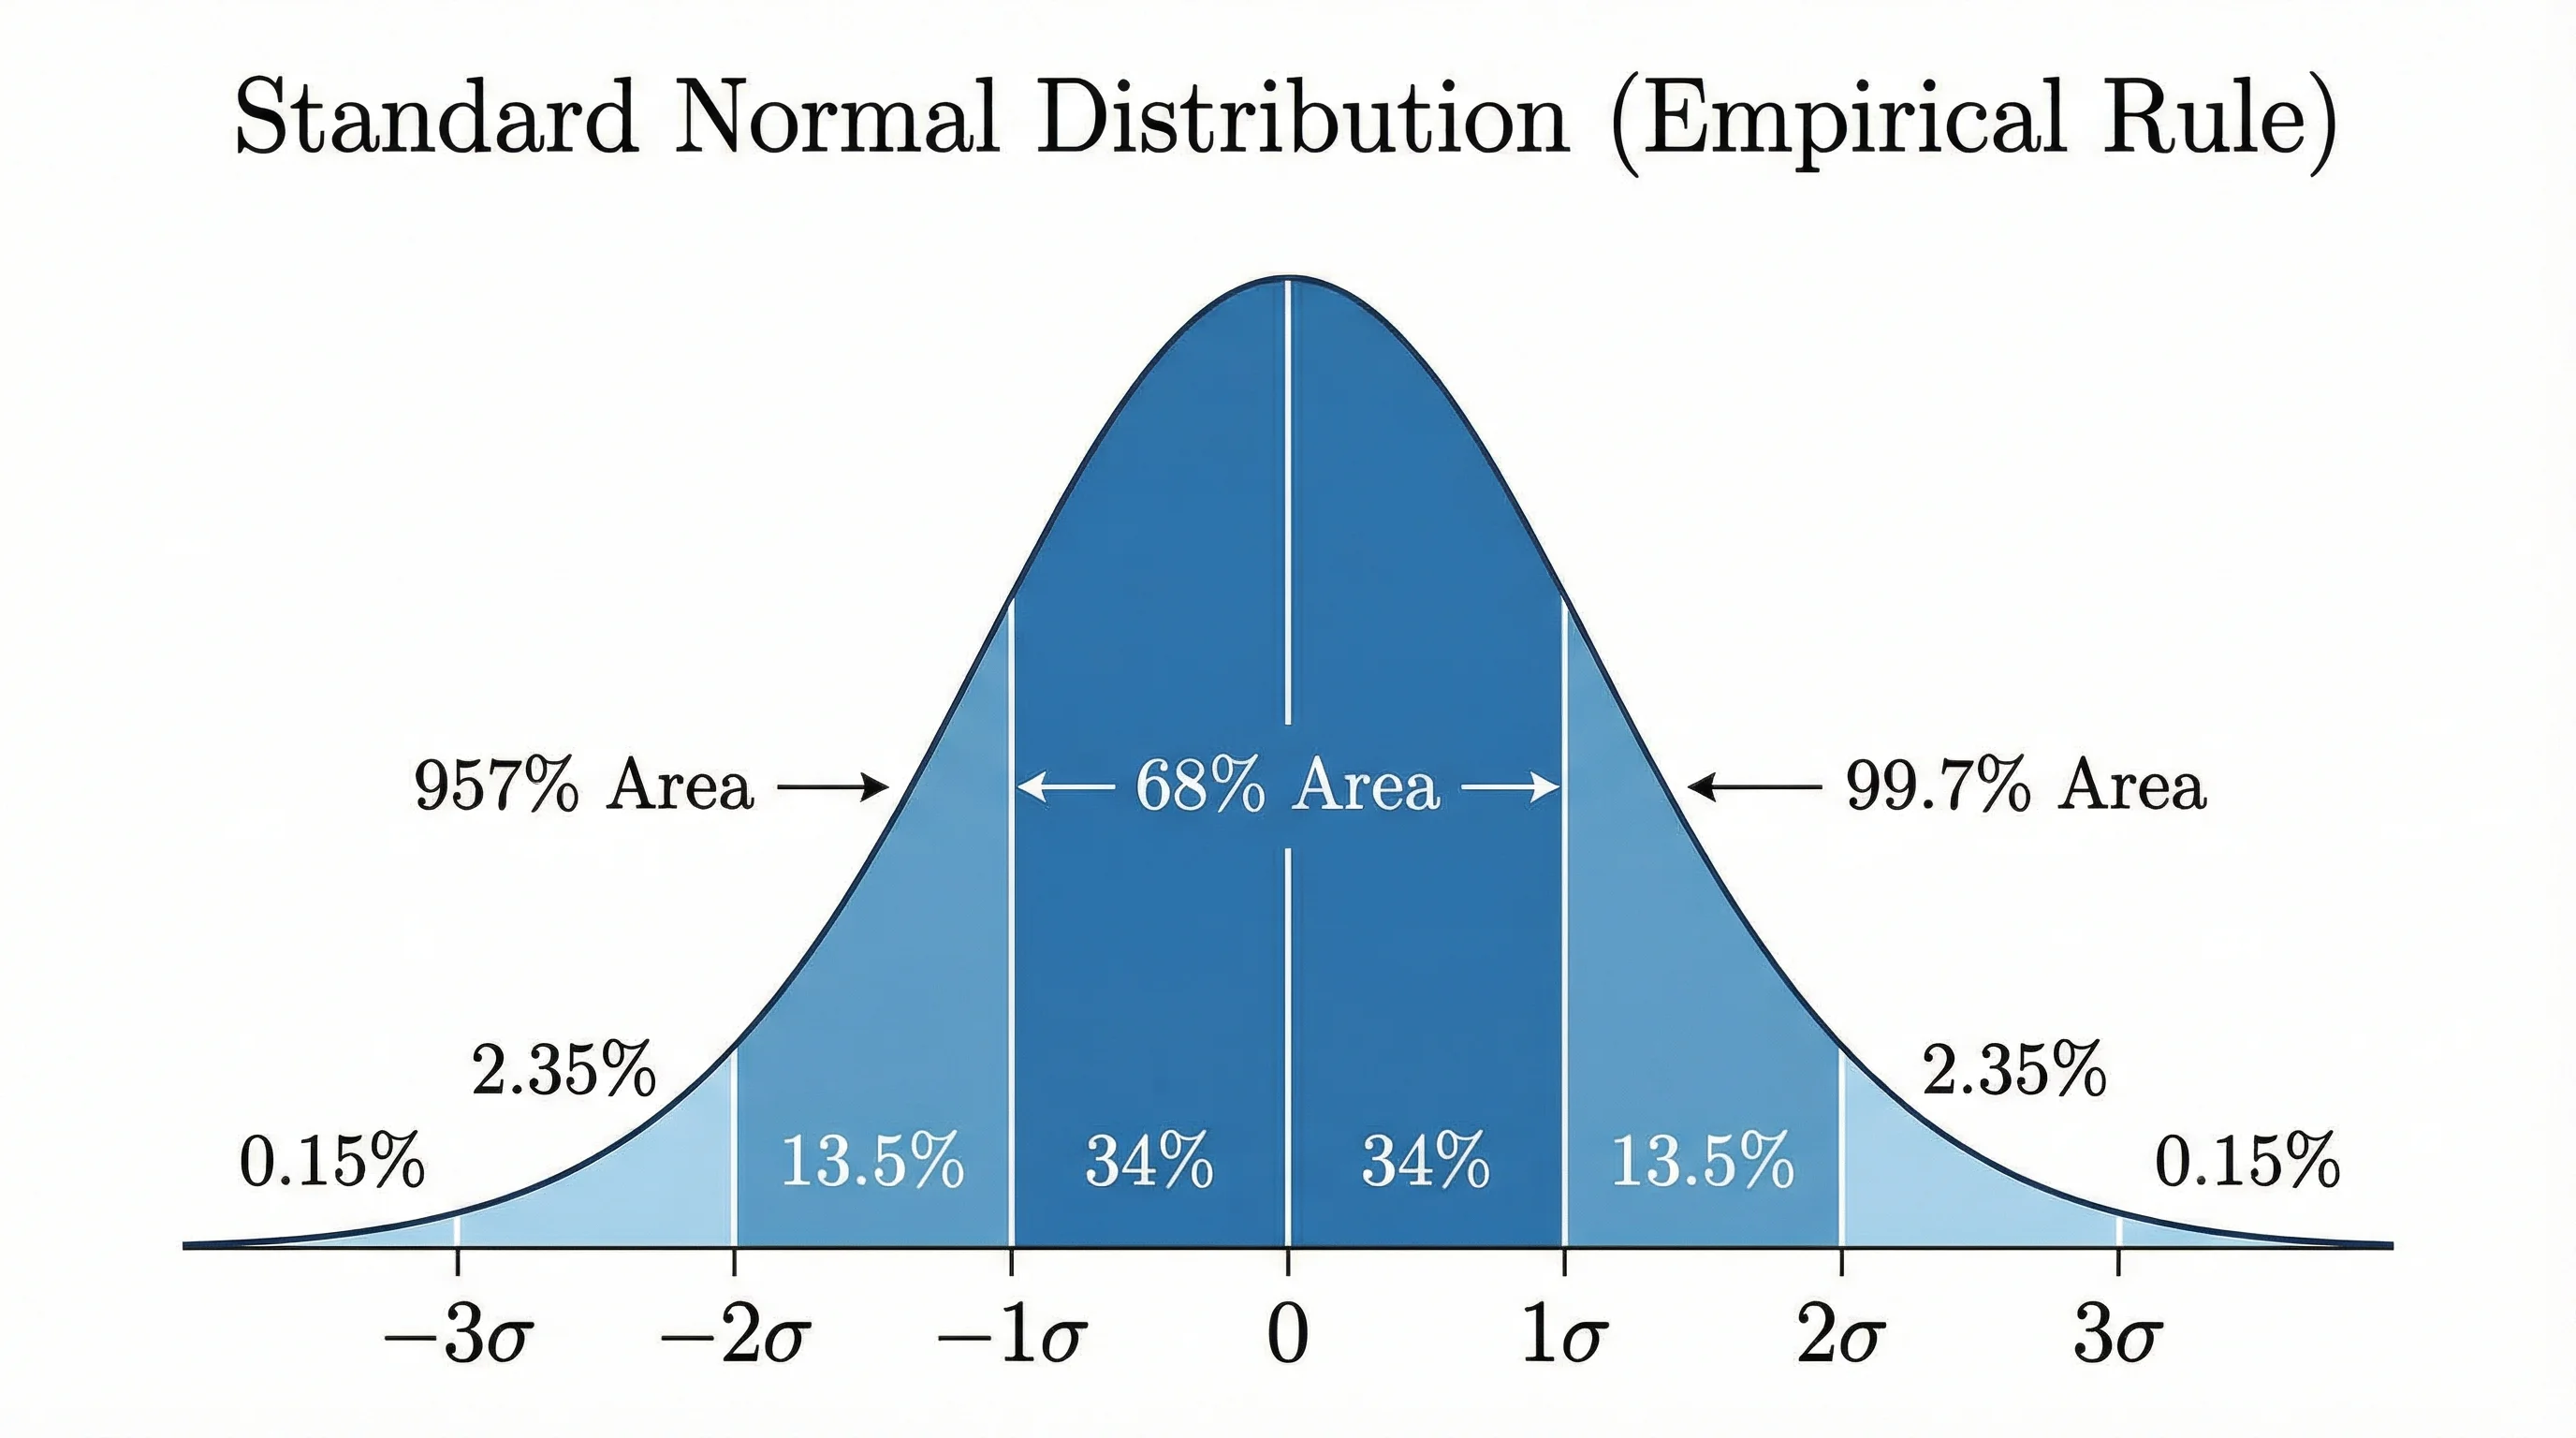
ヒストグラムは特徴的な分布パターンを明らかにします。正規(釣鐘型)分布は平均を中心に対称で、身長などの生物学的測定値に多く見られます。右歪み分布は右方向に長い裾を持ち、収入や反応時間のデータに典型的です。左歪み分布は左方向に裾を引き、退職年齢のデータに見られます。双峰性分布は2つのピークを示し、2つの異なるサブグループを示します。一様分布はすべてのビンでほぼ等しい度数を持ちます。これらの形状を認識することで、研究者はデータ生成過程を理解し、適切な統計検定を選択できます。
AIでヒストグラムを作成する方法
- データを説明する:変数・範囲・おおよその分布形状を指定するか、実際の値を入力する
- 用途を選ぶ:統計の授業・研究論文・プレゼンテーション・教科書の図解
- 注釈を指定する:平均/中央値の線・度数ラベル・サンプルサイズ・統計サマリー
- スタイルを選択する:学術向け(グレースケール・APA)・モダン(カラフル・グラデーション)・シンプル(クリーンライン)
- 比較を追加する:複数の分布を重ね合わせるか、グループ比較のために並べて表示する
- AIが論文・ポスター・プレゼンテーション対応の出版品質ヒストグラムを瞬時に生成します
各分野での活用
ヒストグラムはデータを扱うほぼすべての分野で使用されます。教育では、教師がテスト点数の分布と成績カーブを視覚化するために使います。生物学では、生物の長さ・細胞数・酵素活性などの測定値を表示します。物理学ではエネルギースペクトルと粒子径分布を示します。環境科学では、降水量と気温の度数グラフが気候研究に活用されます。ビジネスでは顧客年齢分布・購入頻度・プロセスのばらつきを明らかにします。医療では患者のアウトカム分布と薬物反応データを表示します。その汎用性から、ヒストグラムは最も広く教えられ使用される統計的視覚化の一つです。