ジェノグラム作成ツール ジェノグラム
家族構造を入力するだけで、AIが即座にプロフェッショナルなジェノグラムを作成。家族療法・ソーシャルワーク評価・医療歴の記録に最適。
ジェノグラム作成ツール
By using ConceptViz, you agree not to generate or edit adult, sexual, explicit, unsafe, or policy-violating content. See Content Policy.
無料で試す ·
ジェノグラムがここに表示されます
家族構造を入力して「生成」をクリックしてください
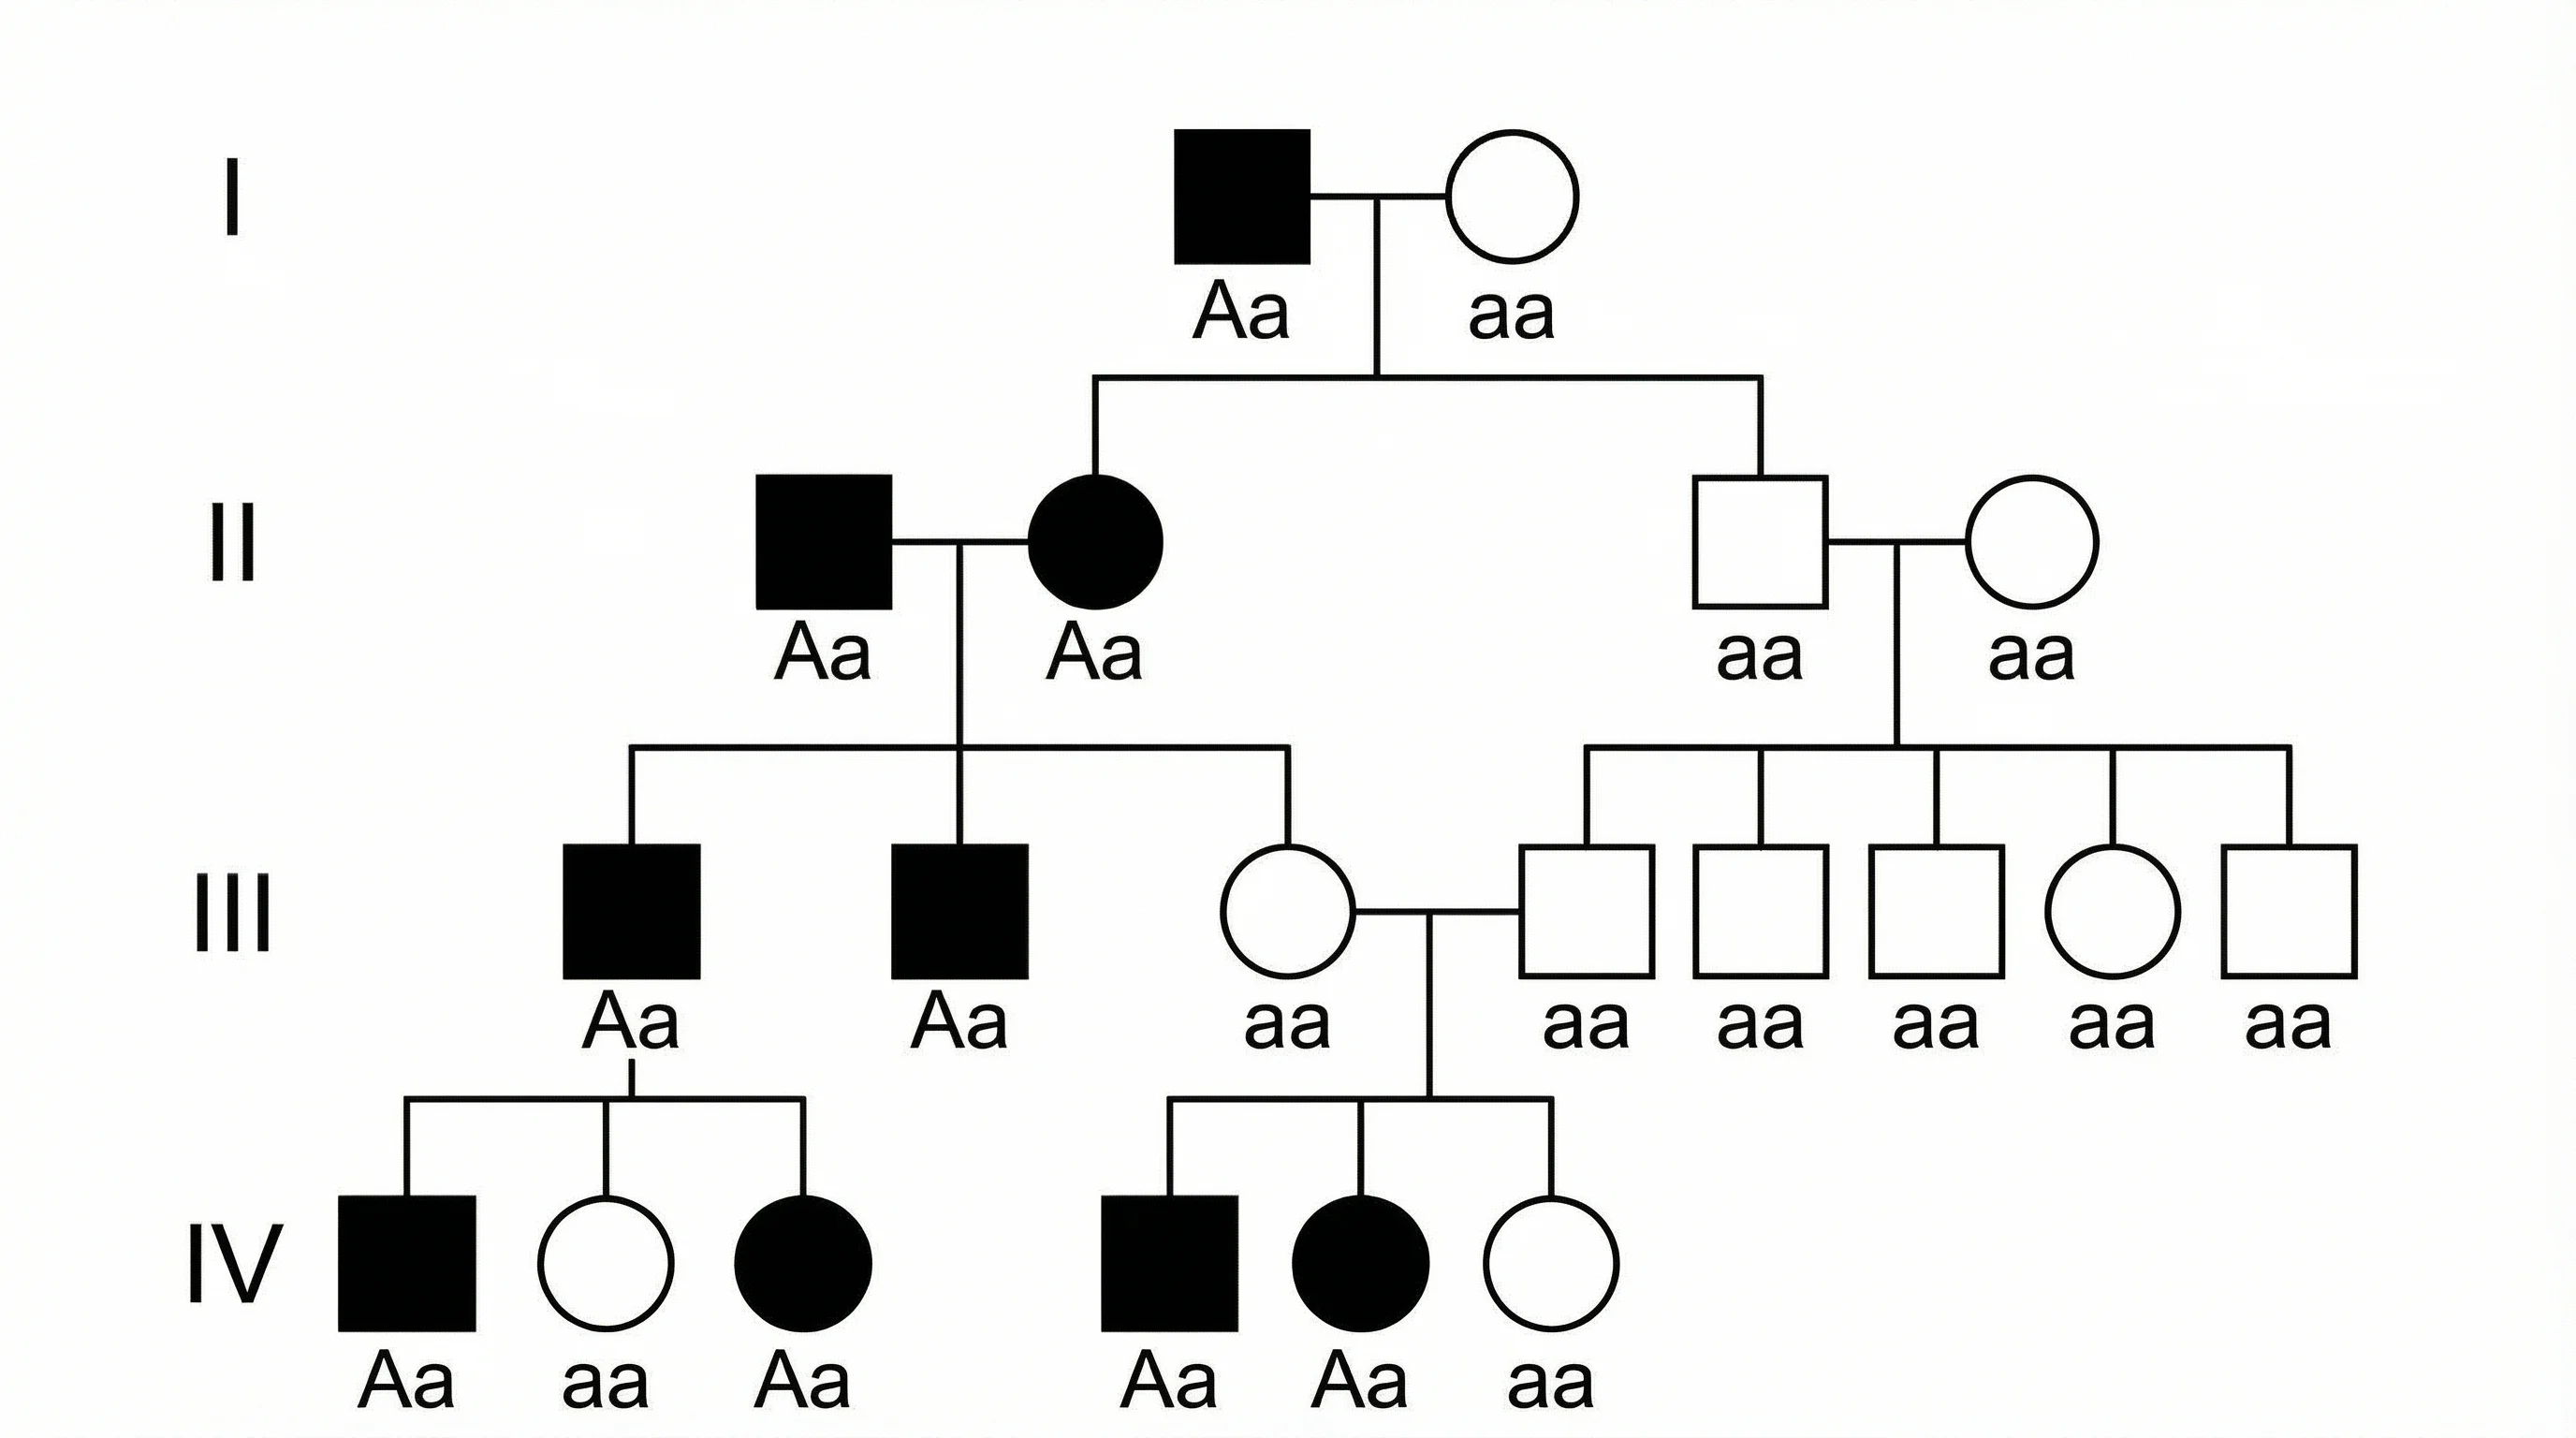
ジェノグラムのサンプル
サンプルを参照するか、上記で独自のジェノグラムを作成してください
3世代家族ジェノグラム
婚姻・離婚・子どもの関係を従来の記号で表した標準的な3世代ジェノグラム。
医療歴ジェノグラム
心疾患・糖尿病・がんなどの遺伝性疾患を複数世代にわたって追跡する医療ジェノグラム。
感情関係ジェノグラム
親密・融合・対立・疎遠・断絶など標準の関係線を使った感情マッピングジェノグラム。
物質乱用パターンジェノグラム
治療計画のため4世代にわたる物質乱用パターンと併発する精神健康状態をマッピングした臨床ジェノグラム。
文化的ジェノグラム
多文化家族の民族・移住歴・宗教的所属・文化的価値観を組み込んだ文化的ジェノグラム。
ソーシャルワーク評価ジェノグラム
世帯境界・支援ネットワーク・地域資源・介入ポイントを示す包括的なソーシャルワーク用ジェノグラム。
ジェノグラムとは?
ジェノグラムは、従来の系譜図を大幅に超えた詳細な家族関係の図解表現です。1980年代にモニカ・マクゴールドリックとランディ・ガーソンが開発し、標準化された記号を用いて複数世代にわたる家族関係・医療歴・感情パターン・行動特性をマッピングします。名前と日付のみを示す単純な家族樹とは異なり、ジェノグラムは離婚・養子縁組・流産・感情的絆・対立・遺伝性疾患など、家族ダイナミクスの複雑さを捉えます。家族療法・ソーシャルワーク・医学・遺伝カウンセリングにおける不可欠なツールであり、現在の行動と健康に影響する世代間パターンを臨床医が視覚的に把握するのに役立ちます。
ジェノグラムの標準記号
- 男性は四角形、女性は円形、性別不明はひし形で表します
- パートナーは水平線でつなぎます(婚姻は一本線、別居は斜線一本、離婚は斜線二本)
- 縦線で親子をつなぎ、子どもは出生順に左から右に並べます
- 故人は記号にXを重ねて示します
- 養子は破線、里子は点線でつなぎます
- 感情関係は特殊な線で表します:対立はジグザグ線、融合は三重線、疎遠は点線
専門的実践におけるジェノグラムの活用
ジェノグラムは複数の分野にわたる強力なアセスメントおよび治療計画ツールとして機能します。家族療法では、繰り返す感情パターン・三角関係・トラウマの世代間伝達の特定に役立ちます。ソーシャルワーカーは家族の包括的アセスメントに使用し、強み・リスク・支援ネットワークを把握します。医療分野では、遺伝カウンセラーが心疾患・がん・精神疾患などの遺伝性疾患を世代にわたって追跡する医療ジェノグラムを作成します。精神科医は家族システム内の物質乱用・うつ病・不安のパターンをマッピングするために使用します。看護師や一般医も、患者の家族健康歴と心理社会的背景を把握するためのインテーク評価でジェノグラムを活用しています。
ジェノグラムの作成方法
- 特定のクライアントまたは患者から始め、少なくとも3世代を含めます
- 標準記号を使用します:男性は四角形、女性は円形、水平線はパートナー関係
- 名前・年齢・生年月日/没年月日・職業・居住地などの人口統計情報を追加します
- 適切な線スタイルで関係パターンをマッピングします(親密・疎遠・対立・融合・断絶)
- カラーコードや特殊記号で関連する医療・行動・文化情報を追加します
- AIジェノグラム作成ツールが記載内容から記号の配置とレイアウトを自動処理します
ジェノグラムと家族樹の違い
家族樹とジェノグラムはどちらも家族関係をマッピングしますが、根本的に異なる目的を持ちます。家族樹は血統・名前・日付・生物学的な親子関係に焦点を当てた系譜記録であり、「誰が誰と関係しているか」という問いに答えます。一方ジェノグラムは、家族構造だけでなく関係の質・感情パターン・医療状態・行動ダイナミクスも捉える臨床アセスメントツールです。ジェノグラムは臨床分野で認められた標準記号を使用し、非生物学的関係(養子・里子・ステップファミリー)も含め、家族樹では決して示されない感情的つながりをマッピングします。家族樹を歴史的記録と考えるなら、ジェノグラムは家族パターンが個人の行動と健康にどう影響するかを理解するための診断ツールです。