Tree Diagram Generator for Every Branch
Make a tree diagram online in seconds. Describe a hierarchy, probability tree, decision tree, family or classification tree and our AI draws clean branches, parent and child nodes, and labeled levels — then export, free.
Tree Diagram Generator
Free to try ·
Your tree diagram will appear here
Describe your hierarchy and click Generate
Tree Diagram Examples
Probability, decision, classification, and organizational trees
Probability Tree Diagram
Branches carry probabilities; multiply along a path to get each outcome — ideal for two-stage experiments.
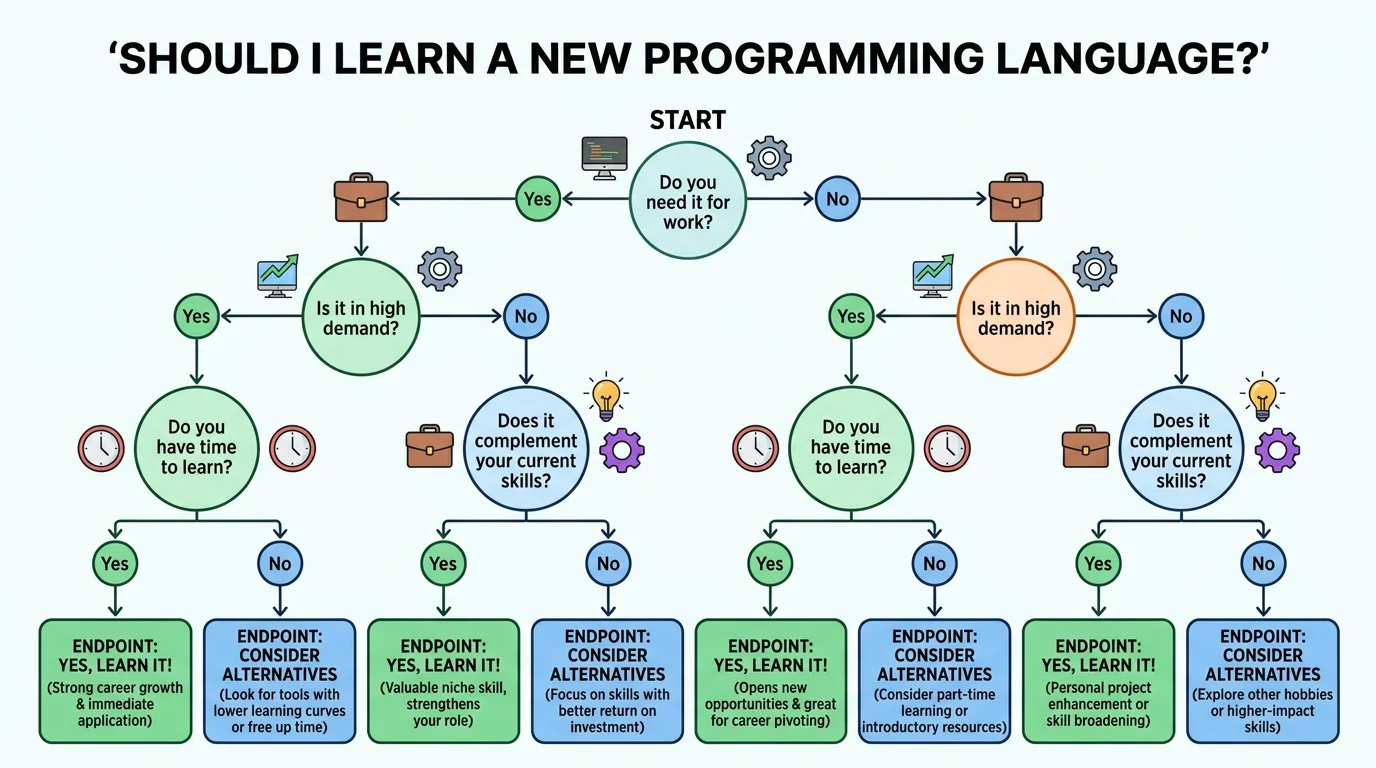
Decision Tree
Each node is a question; each branch is a choice — follow a path to a recommended outcome.
Classification Tree
A classification tree groups items level by level, from the broad root down to specific leaves.
Organizational Tree
An org or family tree shows parent-to-child relationships and reporting lines at a glance.
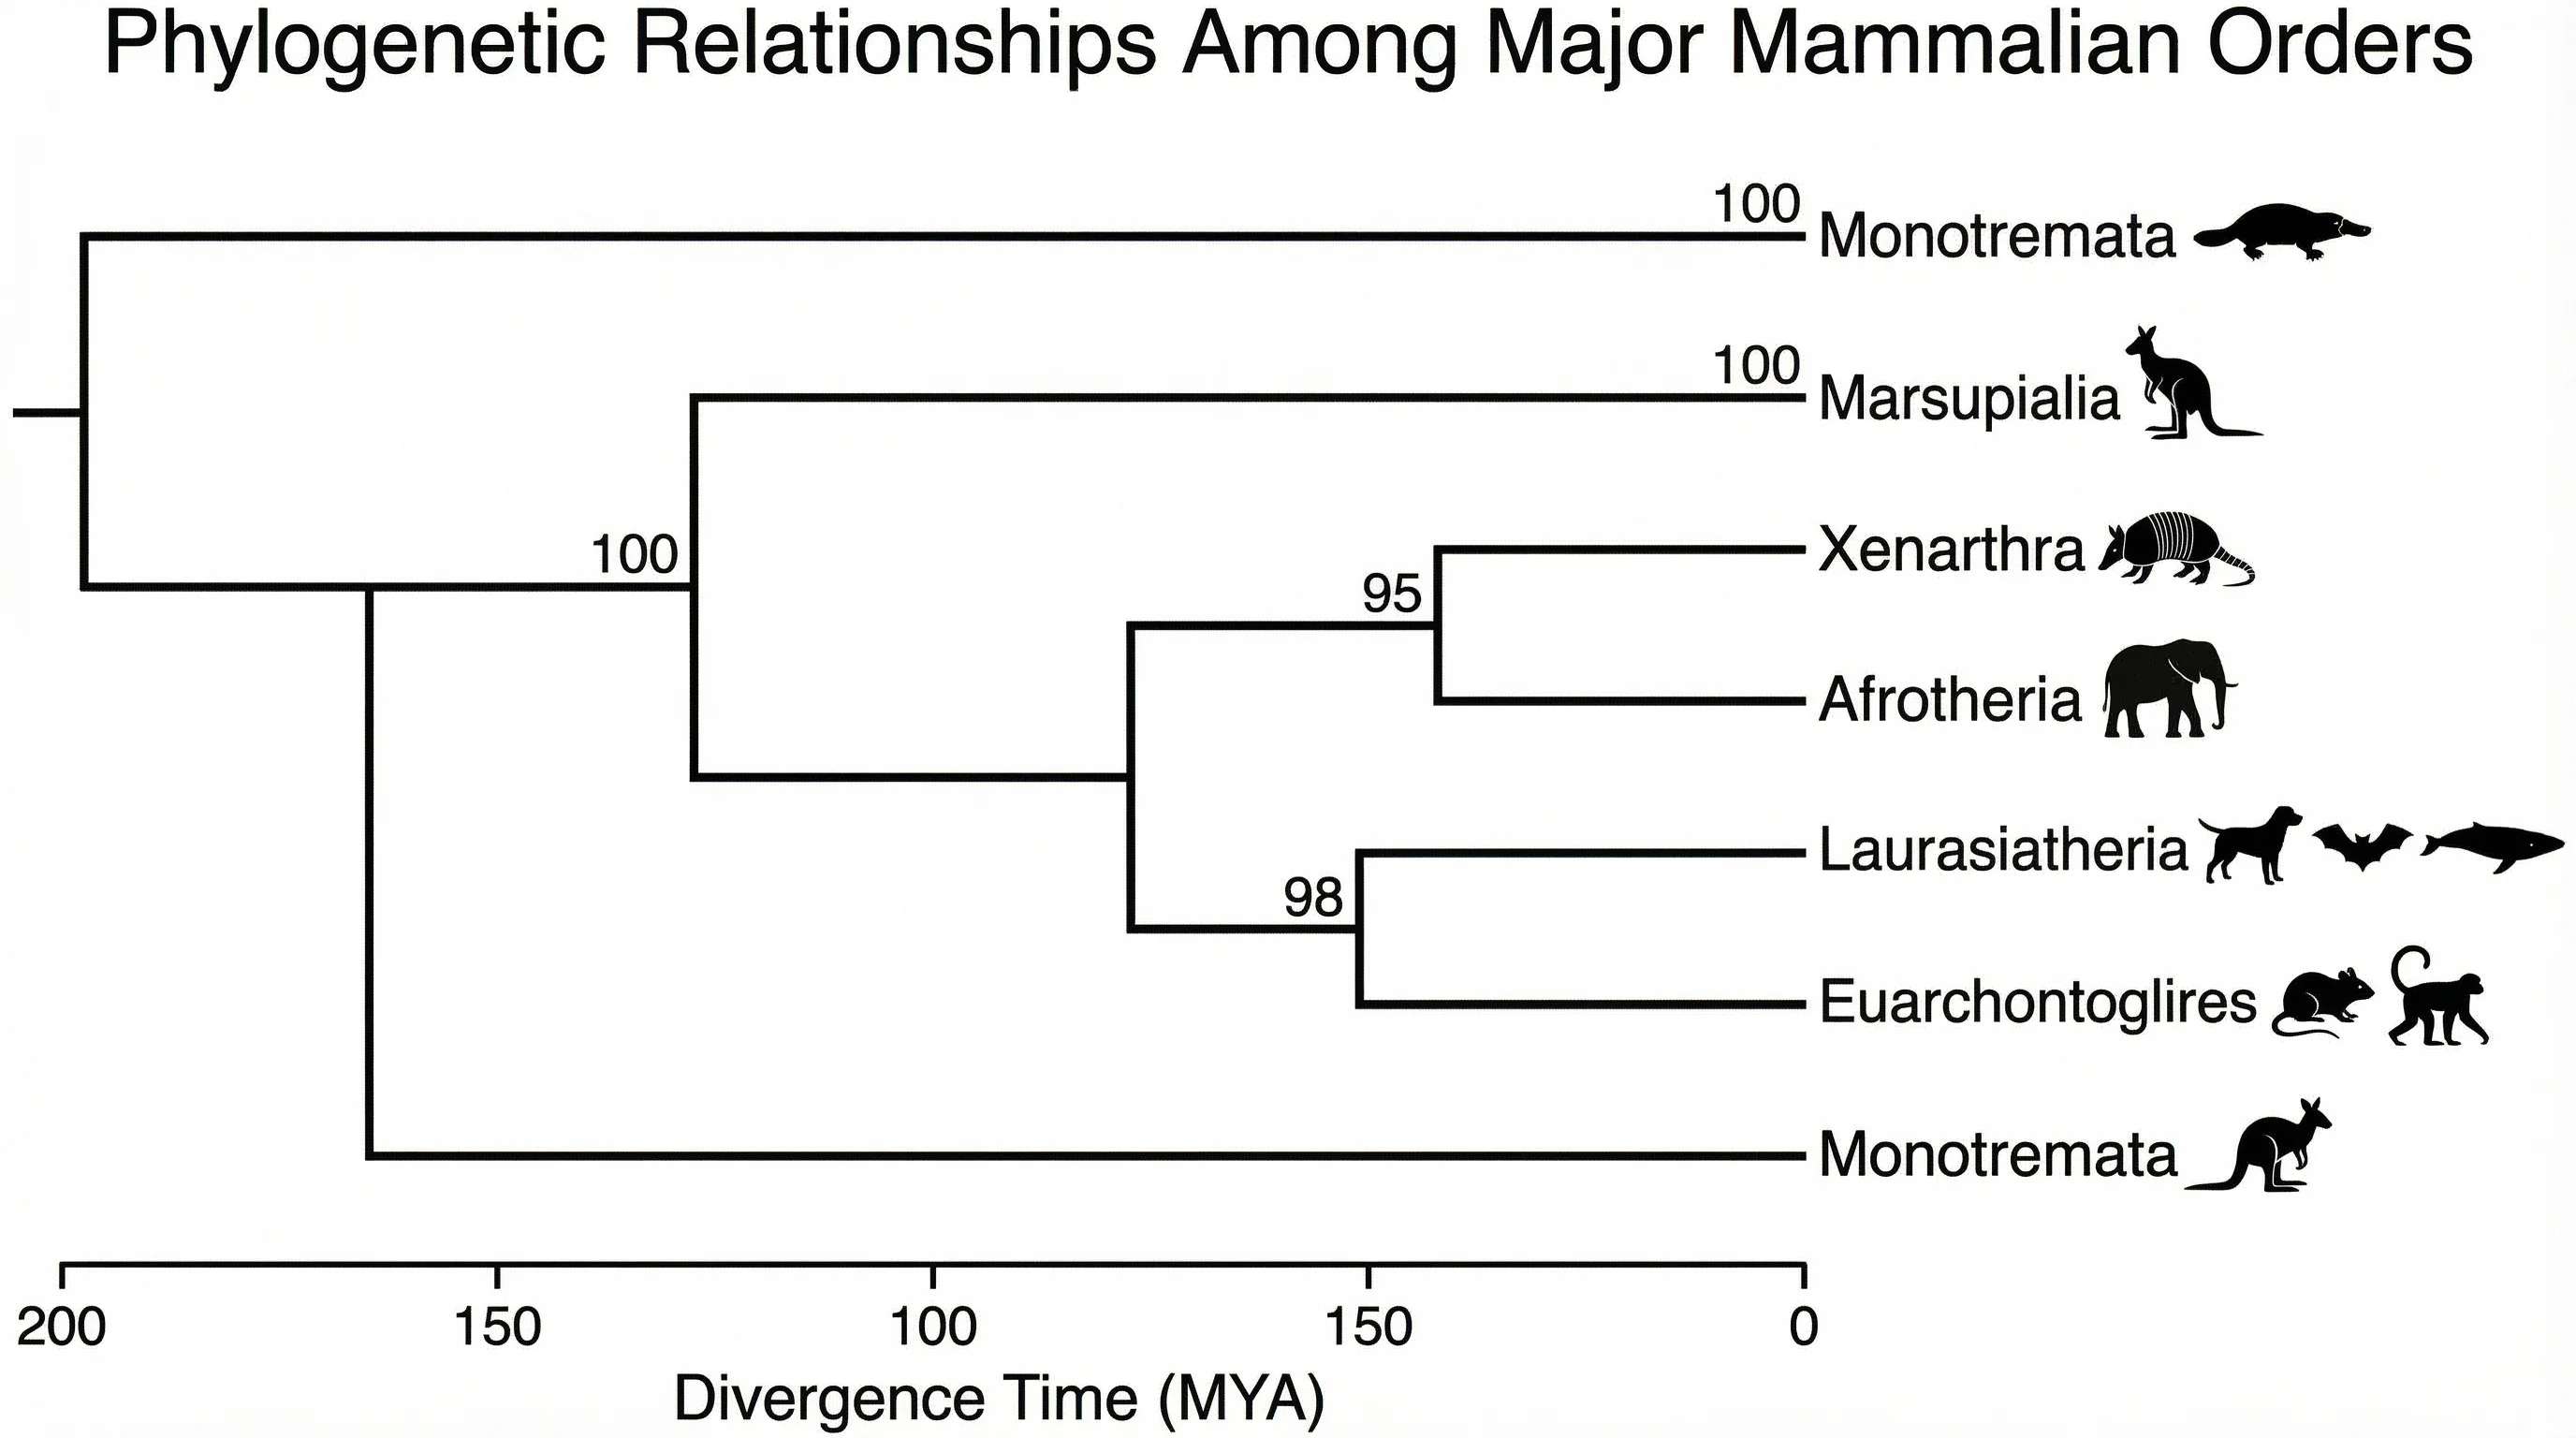
Phylogenetic Tree
Branching points mark shared ancestors; the tips are the species or groups being compared.
Multi-Level Tree
Deep trees stay readable when each level is labeled and the branching is kept consistent.
What is a tree diagram?
A tree diagram is a branching chart that shows how things connect from a single starting point. It begins at a root node, splits into branches, and ends at leaf nodes — so structure flows top-down (or left-to-right) through clear parent and child relationships. Because every item belongs to exactly one branch, a tree is the cleanest way to picture a hierarchy, a set of choices, or a chain of outcomes. This generator draws that branching structure for you, with readable node labels and tidy connectors, so you never have to align boxes by hand.
The parts of a tree: nodes, branches, and levels
- Root node: the single starting point at the top of the tree — the concept, question, or event everything else descends from.
- Parent and child nodes: a parent node splits into one or more child nodes; each child can become a parent of its own sub-branches.
- Branches: the lines connecting parents to children, showing the path from the root to any node.
- Levels (depth): each row of nodes is a level; deeper levels add more detail while keeping the same branching logic.
- Leaf nodes: the end points with no further branches — the final categories, choices, or outcomes.
Making a probability tree diagram
A probability tree is the most common reason people search for a tree diagram maker. Each branch is labeled with the probability of that event, and the branches leaving any node should add up to 1. To find the probability of a full path — say, drawing a red marble and then heads on a coin — you multiply the probabilities along that path. The leaf nodes list every possible outcome with its combined probability, which makes it easy to answer "and" and "or" questions in statistics. Just describe your two- or three-stage experiment (with or without replacement) and the generator lays out the branches, labels each one, and shows the outcomes at the leaves.
Common types of tree diagram
- Probability trees: branches carry probabilities and the leaves list outcomes — the staple of stats homework.
- Decision trees: each node is a question or decision and each branch is an option, leading to a recommended result.
- Family trees: people are nodes and branches show parent-to-child generations and relationships.
- Classification and taxonomy trees: items are grouped level by level, from a broad root down to specific leaves.
- Organizational (org) trees: roles are nodes and branches show reporting lines from the top down.
How to make a tree diagram
- Describe what you want in plain English — name the root concept, the branches it should include, and how many levels deep to go.
- For a probability tree, state each event and its probability; for a decision tree, state the questions and options at each node.
- Click generate and the AI lays out the root, parent and child nodes, branches, and labels in a clean hierarchy.
- Refine the prompt to add levels, rename nodes, or change the style, then download the diagram for slides, worksheets, or reports.
Where tree diagrams are used
Tree diagrams turn up anywhere information branches. In math and statistics, probability trees map outcomes and odds. In business and product work, decision trees weigh options and org trees show structure. In biology, phylogenetic and taxonomy trees show evolutionary and classification relationships. In writing and study, essay and concept trees break a topic into arguments and sub-points. Wherever you have a clear root and items that split into smaller parts, a tree diagram makes the structure obvious — and this maker builds it from a short description instead of hours of dragging boxes around.
Frequently Asked Questions
Related Diagram Tools
 Visualization
Decision Tree Generator
Map questions and options into a branching decision tree that leads to a recommended outcome.
 Business
Org Chart Maker
Build a top-down organizational tree showing roles, teams, and reporting lines.
 Biology
Phylogenetic Tree Maker
Draw evolutionary trees with branching ancestors and labeled species at the tips.