")
Mapping Diagrams Explained: Complete Guide with Examples (2026)
Learn what mapping diagrams are, how to create them, and when to use them in mathematics and research. Complete guide with function mapping examples and free tools.
Mapping diagrams are one of the most intuitive ways to visualize relationships between two sets of values. In mathematics, they make it immediately clear whether a relation is a function, what type of function it is, and how elements in one set connect to elements in another.
This guide explains everything you need to know about mapping diagrams: what they are, how to create them, the different types of mappings they represent, how they compare to other function representations, and where they appear in both mathematics education and research.
What Is a Mapping Diagram?
A mapping diagram (also called an arrow diagram or transformation figure) is a visual representation that shows the relationship between two sets by drawing arrows from elements in one set to elements in another. It consists of:
- Domain -- the set of input values (also called Set A or the source set), usually drawn on the left
- Codomain -- the set of possible output values (also called Set B or the target set), usually drawn on the right
- Arrows -- lines connecting each input to its corresponding output, showing how the mapping works
Here is a simple example of a mapping diagram:
  Domain          Codomain
 ┌───────┐      ┌───────┐
 │   1  ─┼──────┼→  a   │
 │   2  ─┼──────┼→  b   │
 │   3  ─┼──────┼→  c   │
 └───────┘      └───────┘
In this diagram, the function maps 1 to a, 2 to b, and 3 to c. Each element in the domain is paired with exactly one element in the codomain.
Key Terminology
| Term | Definition | Example |
|---|---|---|
| Domain | The set of all input values | {1, 2, 3, 4, 5} |
| Codomain | The set of all possible output values | {a, b, c, d, e} |
| Range | The set of output values actually used | {a, b, c} (subset of codomain) |
| Mapping | The rule that assigns outputs to inputs | f(x) = 2x + 1 |
| Image | The output value for a specific input | f(3) = 7, so 7 is the image of 3 |
| Pre-image | The input value that produces a specific output | 3 is the pre-image of 7 |
Mapping Diagrams vs. Functions
A mapping diagram represents a relation between two sets. Not every relation is a function. A relation qualifies as a function only when each input maps to exactly one output. In a mapping diagram, this means:
- Function: Every element in the domain has exactly one arrow going out
- Not a function: At least one element in the domain has two or more arrows going to different outputs
  FUNCTION               NOT A FUNCTION
 ┌───────┐ ┌───────┐    ┌───────┐ ┌───────┐
 │   1  ─┼→┼  5    │    │   1  ─┼→┼  5    │
 │   2  ─┼→┼  10   │    │   2  ─┼→┼  10   │
 │   3  ─┼→┼  15   │    │   3  ─┼→┼  15   │
 └───────┘ └───────┘    │      ─┼→┼  20   │
                         └───────┘ └───────┘
                         (3 maps to both 15 AND 20)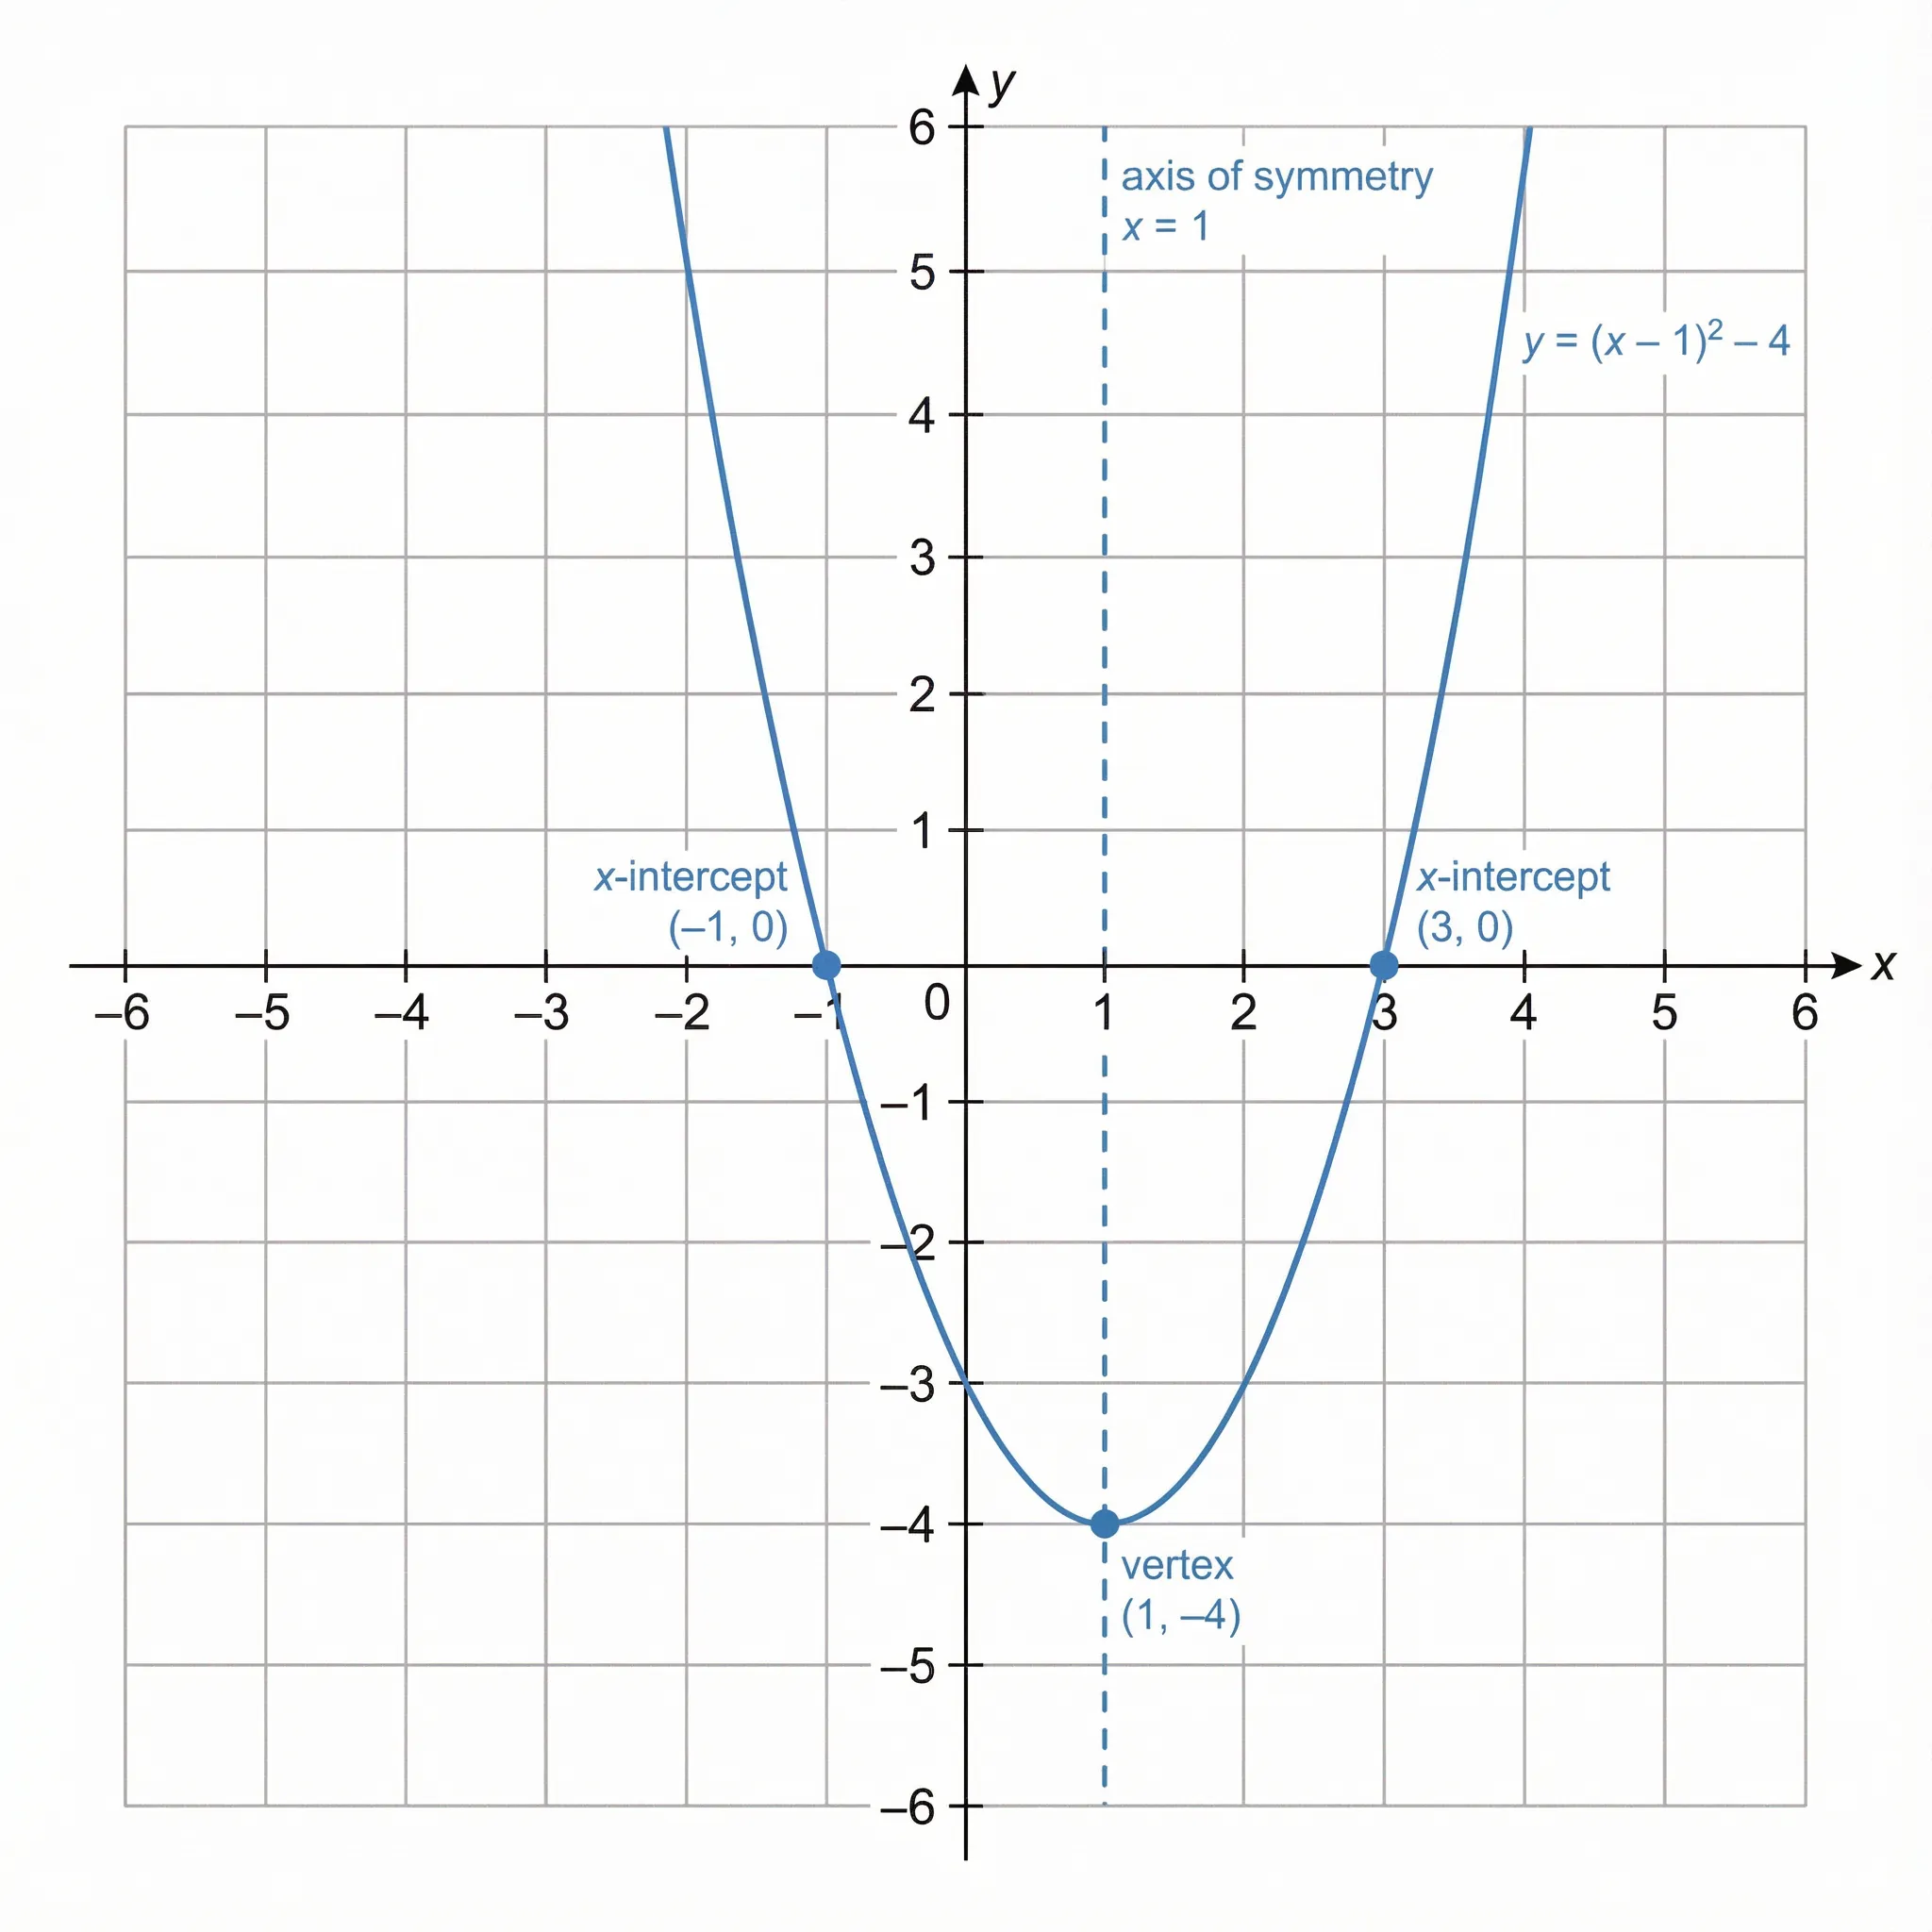
Mapping diagrams provide a discrete, visual way to represent the same relationships shown by function graphs -- making them especially useful for checking whether a relation is actually a function
Types of Mappings
Understanding the different types of mappings is essential for working with functions in algebra, set theory, and higher mathematics.
One-to-One (Injective) Mapping
In a one-to-one mapping, each element in the codomain is mapped to by at most one element in the domain. No two different inputs produce the same output.
  ONE-TO-ONE (INJECTIVE)
 ┌───────┐      ┌───────┐
 │   1  ─┼──────┼→  a   │
 │   2  ─┼──────┼→  b   │
 │   3  ─┼──────┼→  c   │
 │        │      │   d   │  ← no arrow points here
 └───────┘      └───────┘
How to check on a mapping diagram: No element in the codomain has more than one arrow pointing to it. Each arrow lands on a unique element.
Real-world example: Social Security numbers -- each person has a unique number, and no two people share the same number.
Onto (Surjective) Mapping
In an onto mapping, every element in the codomain is mapped to by at least one element in the domain. No element in the codomain is left without an arrow.
  ONTO (SURJECTIVE)
 ┌───────┐      ┌───────┐
 │   1  ─┼──────┼→  a   │
 │   2  ─┼──────┼→  b   │
 │   3  ─┼──┐   │       │
 │   4  ─┼──┘───┼→  c   │  ← two arrows point here
 └───────┘      └───────┘
How to check on a mapping diagram: Every element in the codomain has at least one arrow pointing to it. The range equals the codomain.
Real-world example: A seating chart where every seat must be filled -- multiple students might share a table, but no table is empty.
Bijective (One-to-One and Onto) Mapping
A bijective mapping is both one-to-one and onto. Every element in the domain maps to a unique element in the codomain, and every element in the codomain is mapped to. This creates a perfect "one-to-one correspondence."
  BIJECTIVE (ONE-TO-ONE AND ONTO)
 ┌───────┐      ┌───────┐
 │   1  ─┼──────┼→  a   │
 │   2  ─┼──────┼→  b   │
 │   3  ─┼──────┼→  c   │
 └───────┘      └───────┘
Key property: Bijective functions always have an inverse function. You can reverse all the arrows and get a valid function.
How to check on a mapping diagram: The domain and codomain have the same number of elements, each element in the domain has exactly one arrow, and each element in the codomain receives exactly one arrow.
Many-to-One Mapping
In a many-to-one mapping, two or more elements in the domain map to the same element in the codomain. This is still a valid function (each input has one output), but it is not injective.
  MANY-TO-ONE
 ┌───────┐      ┌───────┐
 │   1  ─┼──┐   │       │
 │  -1  ─┼──┘───┼→  1   │
 │   2  ─┼──┐   │       │
 │  -2  ─┼──┘───┼→  4   │
 └───────┘      └───────┘
Example: The function f(x) = x² maps both 2 and -2 to 4. This is a function, but not one-to-one.
Summary of Mapping Types
| Type | Each Input Has... | Each Output Has... | Is a Function? | Has Inverse? |
|---|---|---|---|---|
| One-to-One (Injective) | Exactly one output | At most one input | Yes | Yes (partial) |
| Onto (Surjective) | Exactly one output | At least one input | Yes | Not necessarily |
| Bijective | Exactly one output | Exactly one input | Yes | Yes |
| Many-to-One | Exactly one output | One or more inputs | Yes | No |
| One-to-Many | Multiple outputs | -- | No | No |
How to Create a Mapping Diagram Step by Step
Step 1: Identify the Domain and Codomain
Define the two sets you are working with. The domain contains your input values, and the codomain contains the possible output values.
Example: For the function f(x) = 2x, using the domain {1, 2, 3, 4}:
- Domain:
{1, 2, 3, 4} - Codomain:
{2, 4, 6, 8}
Step 2: Draw Two Ovals or Columns
Draw two enclosed shapes (ovals, rectangles, or columns) side by side. Label the left shape "Domain" and the right shape "Codomain" (or "Range").
Step 3: List the Elements
Write each element of the domain inside the left shape and each element of the codomain inside the right shape. List each value only once, even if it appears multiple times in your data.
Step 4: Draw the Arrows
For each input value, draw an arrow from it to its corresponding output value. Follow these rules:
- Every element in the domain must have at least one arrow going out (for a total function)
- For a function, each element in the domain must have exactly one arrow going out
- Arrows can cross if necessary--crossing arrows do not change the meaning
Step 5: Verify the Mapping
Check your completed diagram:
- Is it a function? Each input has exactly one arrow.
- Is it one-to-one? No output has more than one arrow pointing to it.
- Is it onto? Every output has at least one arrow pointing to it.
- Is it bijective? Both one-to-one and onto.
Worked Example
Create a mapping diagram for f(x) = x² + 1 with domain {-2, -1, 0, 1, 2}:
-
Calculate outputs:
- f(-2) = 4 + 1 = 5
- f(-1) = 1 + 1 = 2
- f(0) = 0 + 1 = 1
- f(1) = 1 + 1 = 2
- f(2) = 4 + 1 = 5
-
Draw the mapping diagram:
  Domain          Codomain
 ┌───────┐      ┌───────┐
 │  -2  ─┼──┐   │       │
 │   2  ─┼──┘───┼→  5   │
 │  -1  ─┼──┐   │       │
 │   1  ─┼──┘───┼→  2   │
 │   0  ─┼──────┼→  1   │
└───────┘ └───────┘- Analysis:
- Is it a function? Yes--each input has exactly one output
- Is it one-to-one? No--both -2 and 2 map to 5, and both -1 and 1 map to 2
- Is it onto? Yes--every element in the codomain
{1, 2, 5}has at least one arrow - Type: Many-to-one, surjective (onto)
Mapping Diagrams vs. Other Representations
In mathematics, relationships between inputs and outputs can be shown in several ways. Each representation has distinct strengths. Here is how mapping diagrams compare.
Mapping Diagrams vs. Tables
| Feature | Mapping Diagram | Table |
|---|---|---|
| Visual clarity | Arrows show relationships directly | Rows align inputs and outputs |
| Checking for functions | Easy--look for multiple arrows from one input | Harder--must scan for repeated inputs |
| Repeated values | Each value listed once with multiple arrows | Each pair gets its own row |
| Compactness | More compact for many-to-one relations | More compact for one-to-one relations |
| Ordered pairs | Implicit in the arrows | Explicit in the rows |
Example comparison:
| Table | Mapping Diagram |
|---|---|
| x = 1, y = 5 | 1 → 5 |
| x = 2, y = 10 | 2 → 10 |
| x = 3, y = 5 | 3 → 5 |
In the mapping diagram, the output 5 is listed only once with two arrows pointing to it, making the many-to-one nature immediately visible.
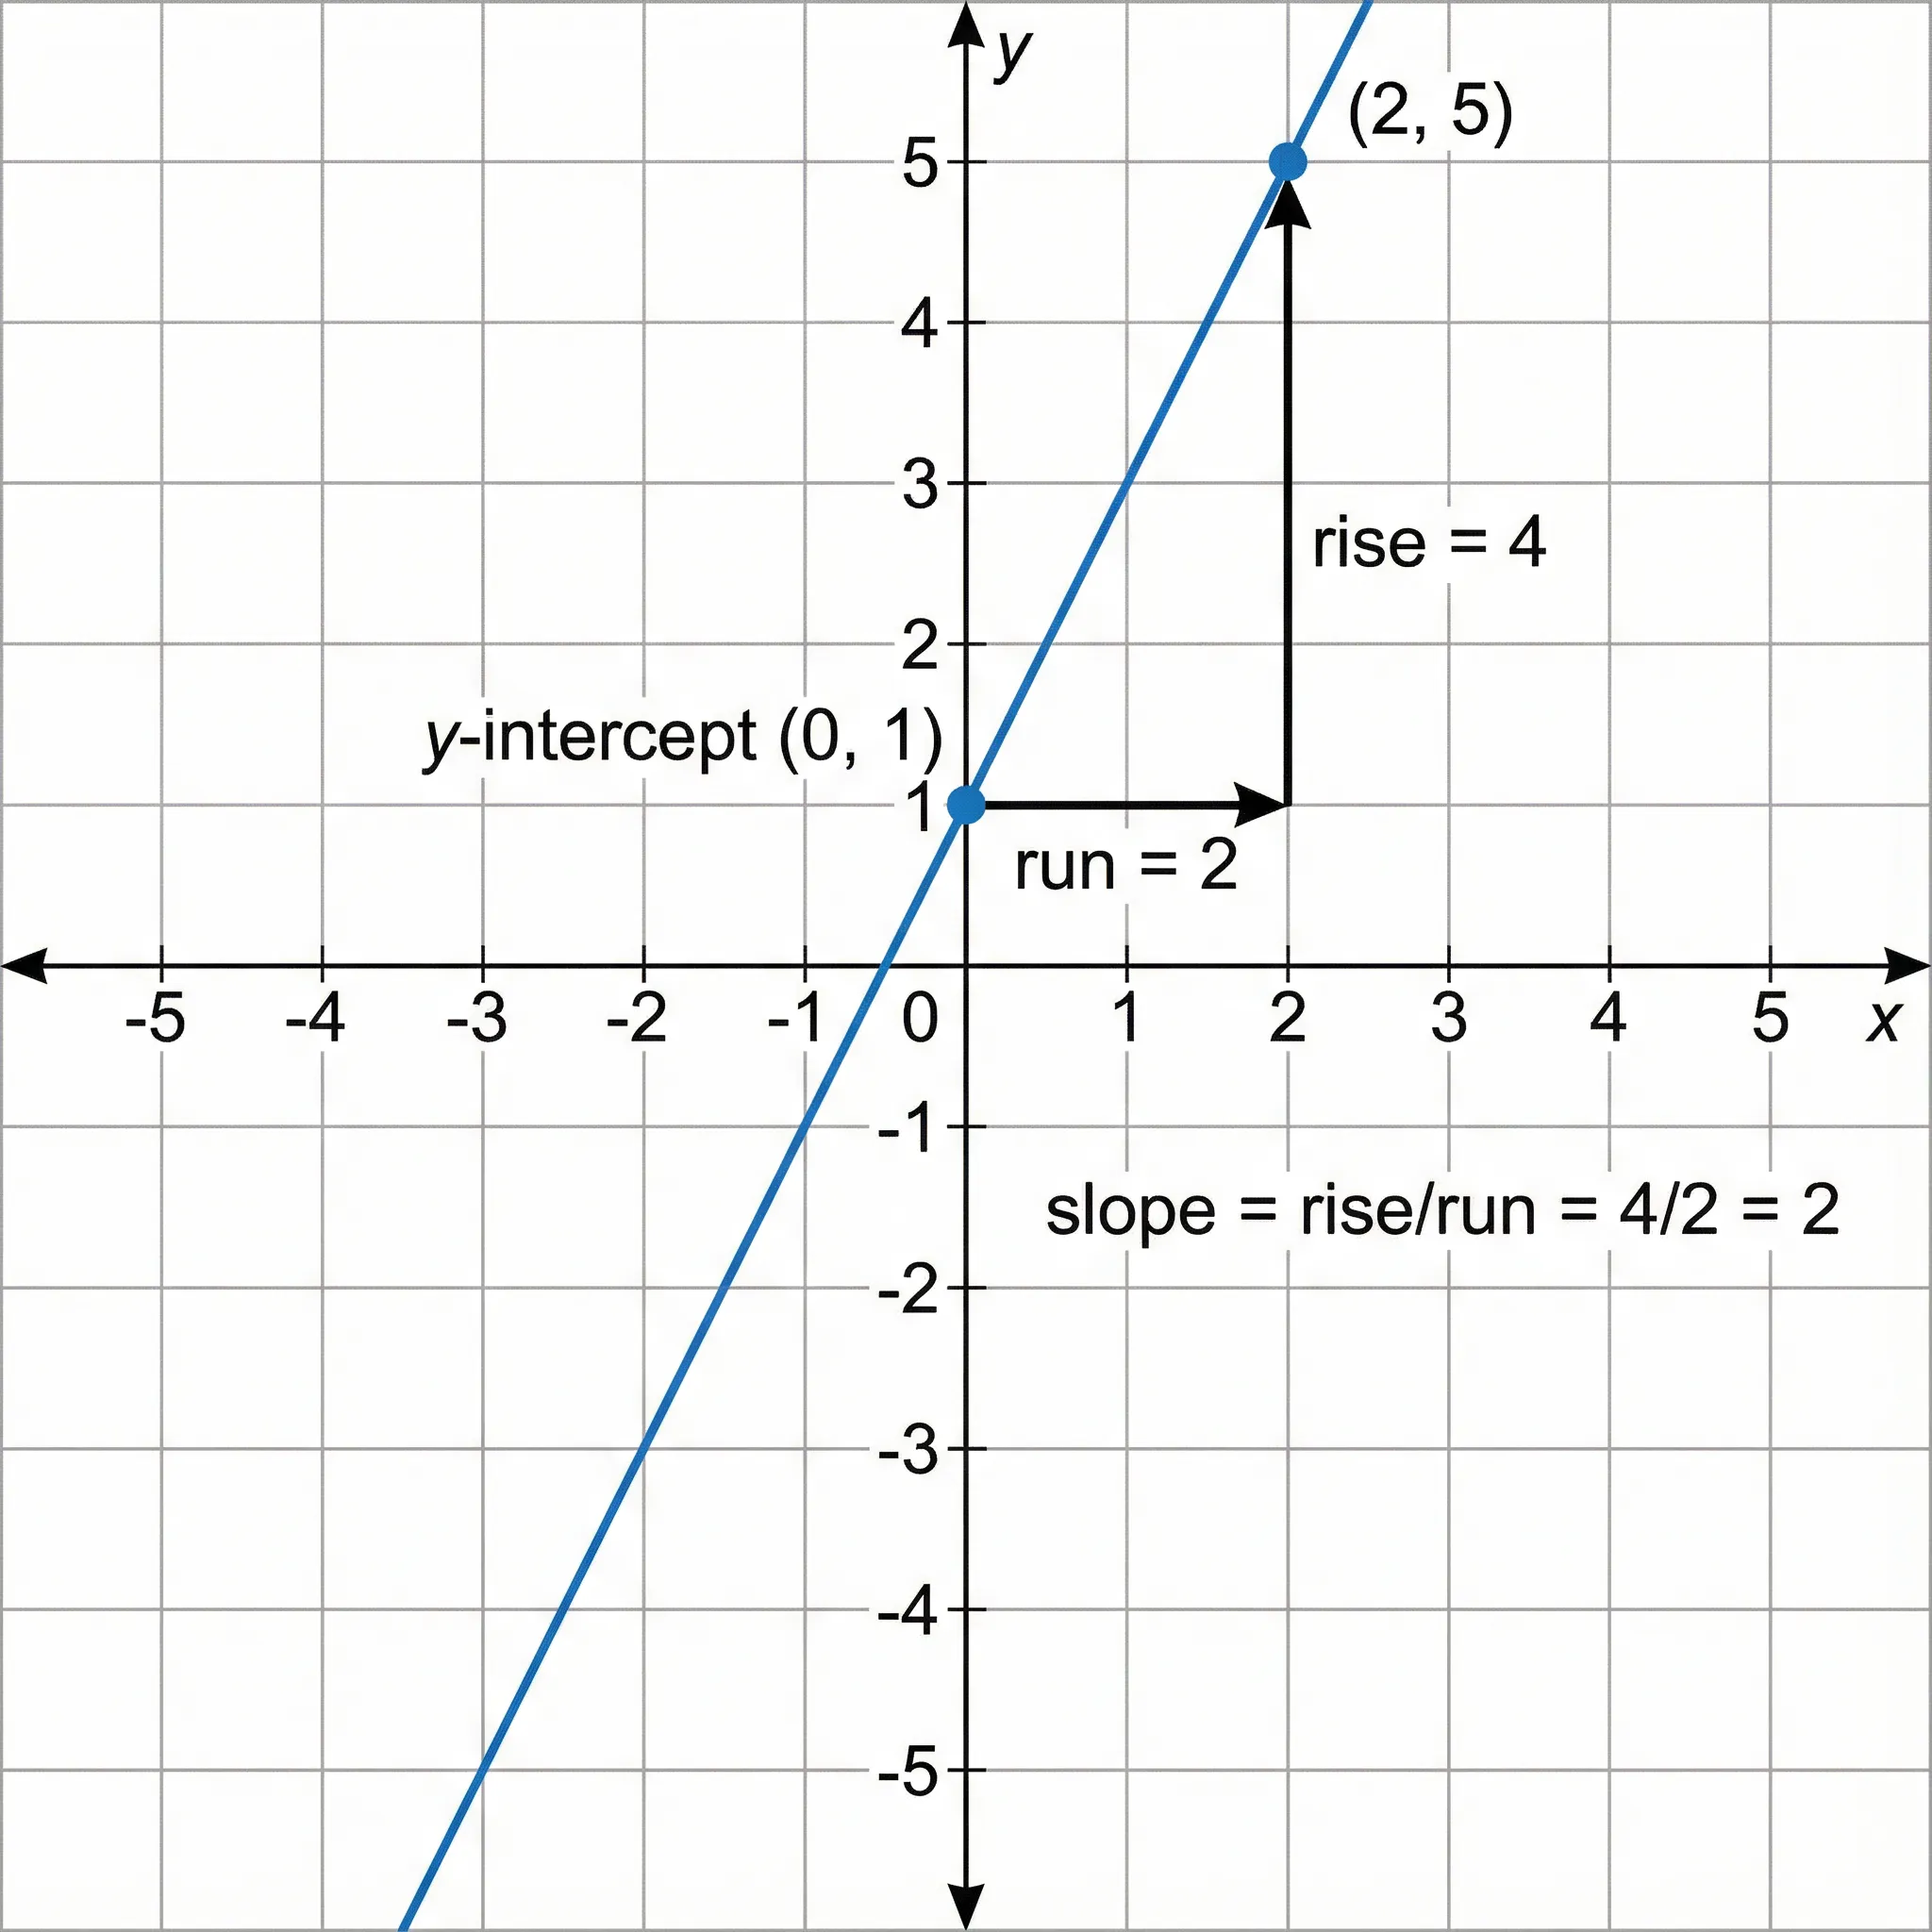
Mapping Diagrams vs. Graphs
| Feature | Mapping Diagram | Coordinate Graph |
|---|---|---|
| Data type | Discrete values | Continuous or discrete |
| Pattern recognition | Limited | Excellent--shows curves, slopes |
| Function test | Check for multiple arrows from one input | Vertical line test |
| Scalability | Works for small sets | Works for any size |
| Showing trends | Not designed for trends | Shows trends clearly |
Mapping Diagrams vs. Equations
| Feature | Mapping Diagram | Equation |
|---|---|---|
| Specificity | Shows specific input-output pairs | Defines the general rule |
| Completeness | Shows only listed values | Covers all possible inputs |
| Readability | Visual, no math skills needed | Requires algebraic understanding |
| Generating new values | Cannot generate unlisted values | Can compute any input |
When to Use Each Representation
| Representation | Best For |
|---|---|
| Mapping diagram | Checking if a relation is a function; showing finite discrete mappings |
| Table | Organizing data; finding patterns in ordered pairs |
| Graph | Visualizing trends; applying the vertical line test; continuous functions |
| Equation | Defining general rules; computing specific values; algebraic manipulation |
| Ordered pairs | Compact notation; plotting points |
While graphs excel at showing continuous relationships and trends, mapping diagrams are better suited for visualizing discrete input-output pairs and verifying function properties
Applications in Mathematics Education
Mapping diagrams are widely used in algebra and pre-algebra courses to introduce students to the concept of functions. They serve several pedagogical purposes.
Teaching Functions (Algebra 1 and Pre-Algebra)
Mapping diagrams are often the first representation students encounter when learning about functions because they make the definition concrete:
- Students can physically draw arrows and see that "each input has exactly one output"
- The visual nature makes abstract concepts tangible
- Errors (like one-to-many relations) are immediately visible
Common Classroom Activities
- Function or not? -- Students examine mapping diagrams and determine which represent functions
- Create from tables -- Students convert tables of values into mapping diagrams
- Create from equations -- Students evaluate a function at specific inputs and draw the resulting mapping
- Identify the type -- Students classify mappings as injective, surjective, or bijective
- Real-world mappings -- Students create mapping diagrams for everyday relationships (students to grades, items to prices)
Mapping Diagrams in Set Theory
In set theory courses, mapping diagrams illustrate:
- Relations vs. functions -- not all relations are functions, but all functions are relations
- Composition of functions -- chaining two mapping diagrams shows how g(f(x)) works
- Inverse functions -- reversing all arrows in a bijective mapping gives the inverse
- Cardinality -- bijective mappings prove two sets have the same number of elements
Mapping Diagrams in Calculus Preparation
Before studying limits and continuity, students benefit from understanding:
- Domain restrictions -- which inputs are valid for a function
- Range determination -- which outputs a function can produce
- Function behavior -- one-to-one functions pass the horizontal line test
Applications in Research
Beyond mathematics education, mapping diagrams and the concept of mappings appear in several research contexts.
Data Mapping in Database Design
Data mapping defines how fields in one dataset correspond to fields in another. Researchers use mapping diagrams (or similar visuals) to:
- Map survey questions to database columns -- ensuring every response is captured correctly
- Transform data between formats -- defining how CSV fields map to database tables
- Integrate datasets -- showing how variables in one study correspond to variables in another
For more on database design, see our ER diagram complete guide for research.
Concept Mapping
While distinct from mathematical mapping diagrams, concept maps share the idea of connecting elements from different categories:
- Theoretical frameworks -- mapping variables to constructs
- Literature reviews -- mapping findings to research questions
- Taxonomy development -- mapping specimens to classifications
Category Theory
In advanced mathematics and theoretical computer science, mapping diagrams (called commutative diagrams) are fundamental to category theory. They show how objects and morphisms relate, and whether different paths through the diagram produce the same result.
Common Mistakes When Creating Mapping Diagrams
Mistake 1: Listing Values More Than Once
Problem: Writing the same output value multiple times when multiple inputs map to it.
Fix: List each value only once in the domain or codomain. Use multiple arrows pointing to the same value.
  WRONG                     RIGHT
 ┌───────┐ ┌───────┐      ┌───────┐ ┌───────┐
 │   1  ─┼→┼  5    │      │   1  ─┼─┐       │
 │   3  ─┼→┼  5    │      │   3  ─┼─┘→  5   │
 └───────┘ └───────┘      └───────┘ └───────┘
 (5 listed twice)          (5 listed once)
Mistake 2: Confusing Codomain with Range
Problem: Only listing output values that are actually used, rather than all possible output values.
Fix: The codomain includes all possible outputs, while the range includes only the outputs that are actually mapped to. In a mapping diagram, you may include codomain elements that have no arrows pointing to them.
Mistake 3: Forgetting to Map All Domain Elements
Problem: Leaving some input values without arrows.
Fix: In a total function, every element in the domain must have an arrow. If an input has no defined output, it means the function is not defined at that point (a partial function).
Mistake 4: Drawing Multiple Arrows from One Input
Problem: Accidentally creating a one-to-many relation, which is not a function.
Fix: Double-check that each domain element has exactly one arrow going out. If you find multiple arrows from one input, your relation is not a function.
Mistake 5: Confusing the Direction of Arrows
Problem: Drawing arrows from the codomain to the domain instead of domain to codomain.
Fix: Arrows always go from left to right (domain to codomain). This represents the direction of the mapping: input → output.
Mistake 6: Assuming Crossing Arrows Mean an Error
Problem: Thinking that arrows that cross each other indicate a mistake.
Fix: Crossing arrows are perfectly valid. They just mean that the mapping does not preserve order. For example, mapping {1, 2} to {b, a} where 1→b and 2→a produces crossing arrows, but the function is still valid.
Tools for Creating Mapping Diagrams
Manual Methods
- Pen and paper -- the fastest method for small diagrams in class or exams
- Whiteboard -- ideal for classroom demonstrations
- Graph paper -- helps maintain alignment for neat diagrams
Digital Tools
| Tool | Type | Best For | Cost |
|---|---|---|---|
| GeoGebra | Math software | Interactive mapping diagrams | Free |
| Desmos | Online calculator | Function visualization | Free |
| draw.io | Diagram editor | Custom mapping diagrams | Free |
| Microsoft PowerPoint | Presentation | Mapping diagrams for slides | Paid |
| LaTeX (TikZ) | Typesetting | Publication-quality diagrams | Free |
AI-Powered Diagram Creation
For researchers and students who need to create professional-quality mapping diagrams quickly, AI-powered tools offer an efficient alternative to manual drawing.

Text to Diagram Generator
Describe your mapping diagram in plain language and get a professional visual output instantly. No design skills needed.
Try it free →You can also create related visualizations with these tools:
- Venn Diagram Generator -- for showing set relationships and overlaps
- Conceptual Framework Generator -- for mapping research variables to constructs
Mapping Diagram Practice Examples
Example 1: Determine if the Relation Is a Function
Given the mapping diagram:
 ┌───────┐      ┌───────┐
 │   2  ─┼──────┼→  4   │
 │   5  ─┼──────┼→  7   │
 │   8  ─┼──────┼→  4   │
 │  11  ─┼──────┼→  13  │
 └───────┘      └───────┘
Answer: Yes, this is a function. Each input (2, 5, 8, 11) has exactly one arrow going out. The fact that both 2 and 8 map to 4 is allowed--it makes this a many-to-one function, but it is still a valid function.
Example 2: Create a Mapping Diagram from Ordered Pairs
Given the relation: {(1, 3), (2, 6), (3, 9), (4, 12)}
 ┌───────┐      ┌───────┐
 │   1  ─┼──────┼→  3   │
 │   2  ─┼──────┼→  6   │
 │   3  ─┼──────┼→  9   │
 │   4  ─┼──────┼→  12  │
 └───────┘      └───────┘
Analysis: This is a function (each input has one output). It is one-to-one (no two inputs share an output). It represents the function f(x) = 3x.
Example 3: Identify the Mapping Type
Given the mapping diagram:
 ┌───────┐      ┌───────┐
 │   a  ─┼──────┼→  1   │
 │   b  ─┼──────┼→  2   │
 │   c  ─┼──────┼→  3   │
 └───────┘      └───────┘
Answer: This is a bijective (one-to-one and onto) function. Every input maps to a unique output, and every output is mapped to. This function has an inverse: {(1, a), (2, b), (3, c)}.
Example 4: Real-World Mapping
A teacher maps students to their test scores:
  Students       Scores
 ┌───────┐      ┌───────┐
 │  Alice─┼──────┼→  92  │
 │  Bob  ─┼──┐   │       │
 │  Carol─┼──┘───┼→  85  │
 │  David─┼──────┼→  78  │
 └───────┘      └───────┘
Analysis: This is a function (each student has one score). It is not one-to-one because Bob and Carol both scored 85. It is a many-to-one function.
Frequently Asked Questions
What is a mapping diagram in math?
A mapping diagram is a visual representation that shows the relationship between two sets by using arrows. The input values (domain) are listed on the left, the output values (codomain) are listed on the right, and arrows connect each input to its corresponding output. Mapping diagrams are commonly used in algebra to represent functions and relations.
How do you tell if a mapping diagram is a function?
A mapping diagram represents a function if and only if each element in the domain (left side) has exactly one arrow going out. If any input has two or more arrows pointing to different outputs, the relation is not a function. Multiple inputs can point to the same output (many-to-one), but one input cannot point to multiple outputs.
What is the difference between one-to-one and onto mappings?
A one-to-one (injective) mapping means no two different inputs produce the same output--each output has at most one arrow pointing to it. An onto (surjective) mapping means every element in the codomain has at least one arrow pointing to it--no outputs are left unmapped. A function that is both one-to-one and onto is called bijective.
What is the difference between a mapping diagram and a graph?
A mapping diagram shows discrete input-output pairs using arrows between two sets, making it easy to check if a relation is a function. A coordinate graph plots ordered pairs on an x-y plane, which is better for showing continuous relationships, trends, and patterns. Both can represent the same data, but mapping diagrams are clearer for finite sets while graphs are better for continuous functions.
How do you create a mapping diagram from an equation?
To create a mapping diagram from an equation like f(x) = 2x + 1: first choose specific input values for your domain (e.g., 1, 2, 3, 4). Then substitute each input into the equation to calculate the output. Finally, draw two ovals, list the inputs in the left oval and outputs in the right oval, and draw arrows from each input to its calculated output.
What is a bijective function?
A bijective function (also called a one-to-one correspondence) is a function that is both injective (one-to-one) and surjective (onto). This means every input maps to a unique output, and every element in the codomain is mapped to by exactly one input. Bijective functions always have an inverse function, and the domain and codomain must have the same number of elements.
Can a mapping diagram have crossing arrows?
Yes, crossing arrows in a mapping diagram are completely valid and do not indicate an error. Arrows cross when the mapping does not preserve the order of elements. For example, if 1 maps to b and 2 maps to a, the arrows will cross. The diagram still correctly represents the function regardless of whether arrows cross.
What grade level are mapping diagrams taught?
Mapping diagrams are typically introduced in grades 6 through 8 (middle school) when students first learn about functions and relations. They continue to be used in Algebra 1 and Algebra 2 courses in high school. At the college level, mapping diagrams appear in set theory, abstract algebra, and category theory courses with more formal notation.
Conclusion
Mapping diagrams are a foundational tool for understanding functions and relations in mathematics. Their visual simplicity makes them ideal for:
- Verifying functions -- quickly check if each input has exactly one output
- Classifying mappings -- determine if a function is injective, surjective, or bijective
- Teaching concepts -- make abstract function definitions concrete and visual
- Communicating relationships -- show discrete input-output pairs clearly
Key takeaways:
- A mapping diagram is a function only if each input has exactly one arrow going out
- One-to-one functions have no shared outputs; onto functions leave no outputs unmapped
- Bijective functions are both one-to-one and onto, and always have inverses
- Mapping diagrams work best for finite, discrete sets -- use graphs for continuous functions
- List each value only once in the domain or codomain, using multiple arrows as needed
Whether you are a student learning about functions for the first time or a researcher mapping data between systems, understanding mapping diagrams gives you a clear, visual foundation for working with mathematical relationships.
Additional Resources
カテゴリー
もっと読む
")
How to Make Scientific Diagrams for Research Papers (2025 Guide)
Learn how to create professional scientific diagrams for research papers, theses, and publications. Includes best practices, tools comparison, and step-by-step tutorials for biology, chemistry, and physics diagrams.
")
UML Diagram Types Explained: Class, Sequence & Use Case Guide (2026)
Learn the 14 UML diagram types with examples. Step-by-step guide to creating class diagrams, sequence diagrams, and use case diagrams for software projects.
")
How to Draw a Volcano: Step-by-Step (Easy Labeled Diagram)
Learn how to draw a volcano step by step — an easy labeled cross-section for science class. Simple shapes for the cone, magma chamber, conduit, vent, and erupting ash cloud, plus a free instant generator.