Venn Diagram Generator for 2, 3 & 4 Sets
Make a Venn diagram online with 2, 3, or 4 overlapping circles. Type your sets for a precise, auto-labeled diagram, or describe one for an AI illustration — then export SVG or PNG, free.
Type your set items — renders an exact Venn diagram with correct region counts as SVG, free
Set data
One item per line. Counts are computed for you.
Items are matched case-insensitively and deduplicated.
Each region shows its exact count and example items.
Counts are computed by exact set membership. Download an editable SVG for slides, reports, and worksheets.
Venn Diagram Generator
Free to try ·
Your Venn diagram will appear here
Describe the Venn diagram you want
Venn Diagram Examples
2- and 3-circle diagrams covering comparisons, themes, and overlaps
Two-Circle Comparison
A classic 2-set comparison: unique traits in each circle, shared traits in the overlap.
Three-Circle Venn
Three sets create seven regions — every pairwise and central overlap is labeled.
Concept Comparison
Great for compare-and-contrast study notes — what is unique versus what is shared.
Overlapping Themes
Map where research domains intersect — the center is where all three meet.
The "Sweet Spot" Venn
The popular skills-overlap format, where the center region is the goal state.
Science Topic Venn
Any two topics with shared and distinct features map cleanly onto a 2-set Venn.
What is a Venn diagram?
A Venn diagram uses overlapping circles to show how groups (sets) relate. Each circle is one set, the overlap holds the items the sets share, and the parts that do not overlap hold what is unique to each set. It is the fastest way to picture comparisons, relationships, and logic — which is exactly what this generator draws, with every region placed and labeled for you.
Two ways to make a Venn diagram here
- Data mode: type or paste the items in each set and the tool calculates the overlaps, places every region, and labels the diagram automatically — accurate every time, no dragging or aligning.
- AI illustration mode: describe the Venn diagram you want in plain English and the tool generates a polished, presentation-ready illustration with themed colors and styling.
- Use data mode when correctness matters (homework, set logic, reports); use AI mode when you want a visual, on-brand graphic for slides or social.
2, 3, and 4-circle Venn diagrams
A 2-circle Venn is best for a straight comparison of two things. A 3-circle Venn creates seven distinct regions and is ideal for the "sweet spot" format where the center is where all three meet. A 4-set Venn needs ellipses rather than circles to keep every combination visible. This generator builds 2, 3, and 4-set diagrams and keeps all the regions readable, so you do not have to redraw anything by hand.
How to make a Venn diagram from your data
- Choose how many sets you need (2, 3, or 4) and give each one a clear label.
- Enter the items in each set — one per line, or paste a list straight from your notes or a spreadsheet.
- The tool finds what the sets share and what is unique, then places each item in the correct region.
- Adjust labels and colors, then export a clean SVG or PNG to drop into a doc, slide, or worksheet.
Reading a Venn diagram: union, intersection, and difference
The overlap of two circles is the intersection (A ∩ B) — items that belong to both sets. Everything inside either circle is the union (A ∪ B). The part of one circle that sits outside the other is the difference — items unique to that set. Naming these regions turns a Venn diagram into a tool for set logic and problem solving, not just a picture, which is why it is a staple in math, statistics, and reasoning questions.
When to use the AI illustration mode
Reach for AI illustration mode when you want a styled, eye-catching graphic rather than a strict data layout — a themed comparison for a presentation, a blog graphic, or a social post. For anything where the regions must be exactly right, such as a graded assignment or a set-theory problem, use data mode so the overlaps are computed rather than drawn by hand.
Frequently Asked Questions
Related Diagram Tools
 Research
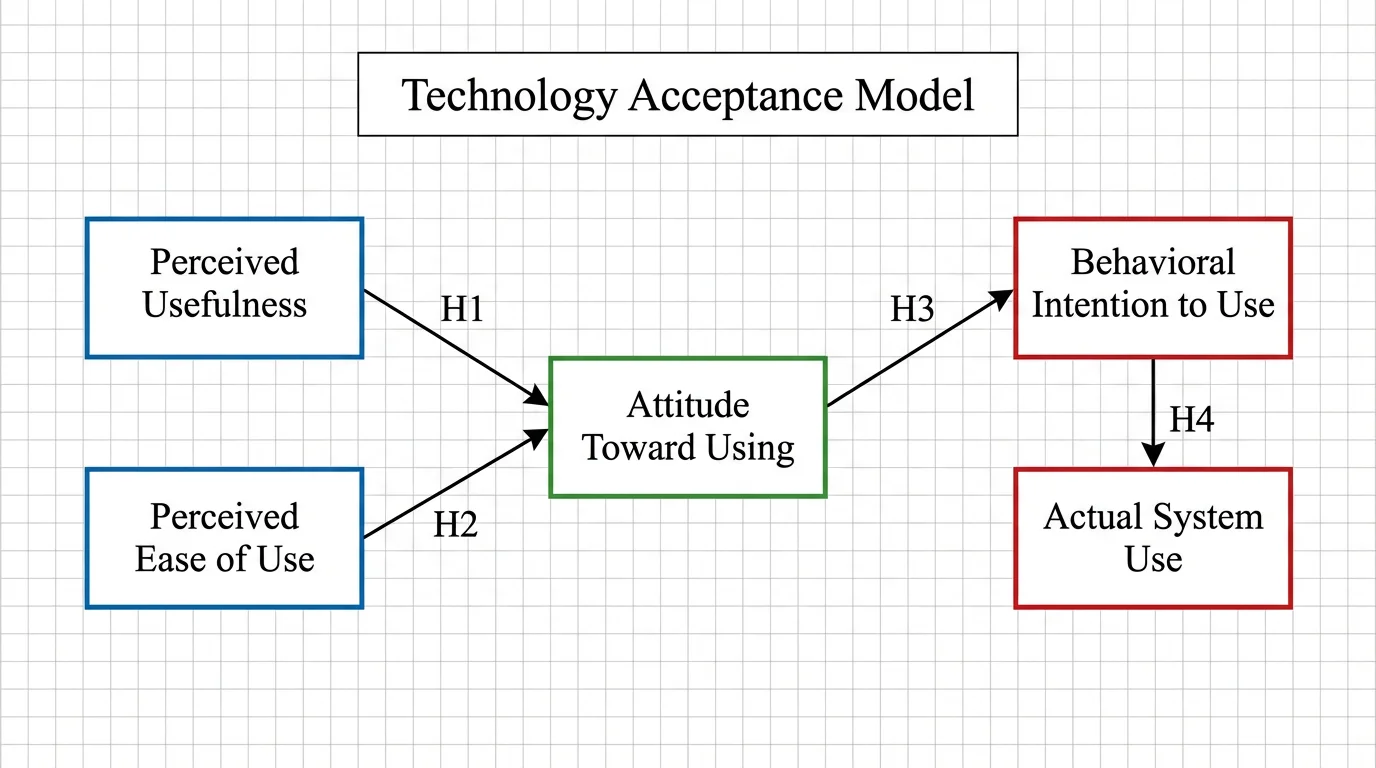
Conceptual Framework Generator
Map variables and relationships into a clear conceptual framework for research.
 Education
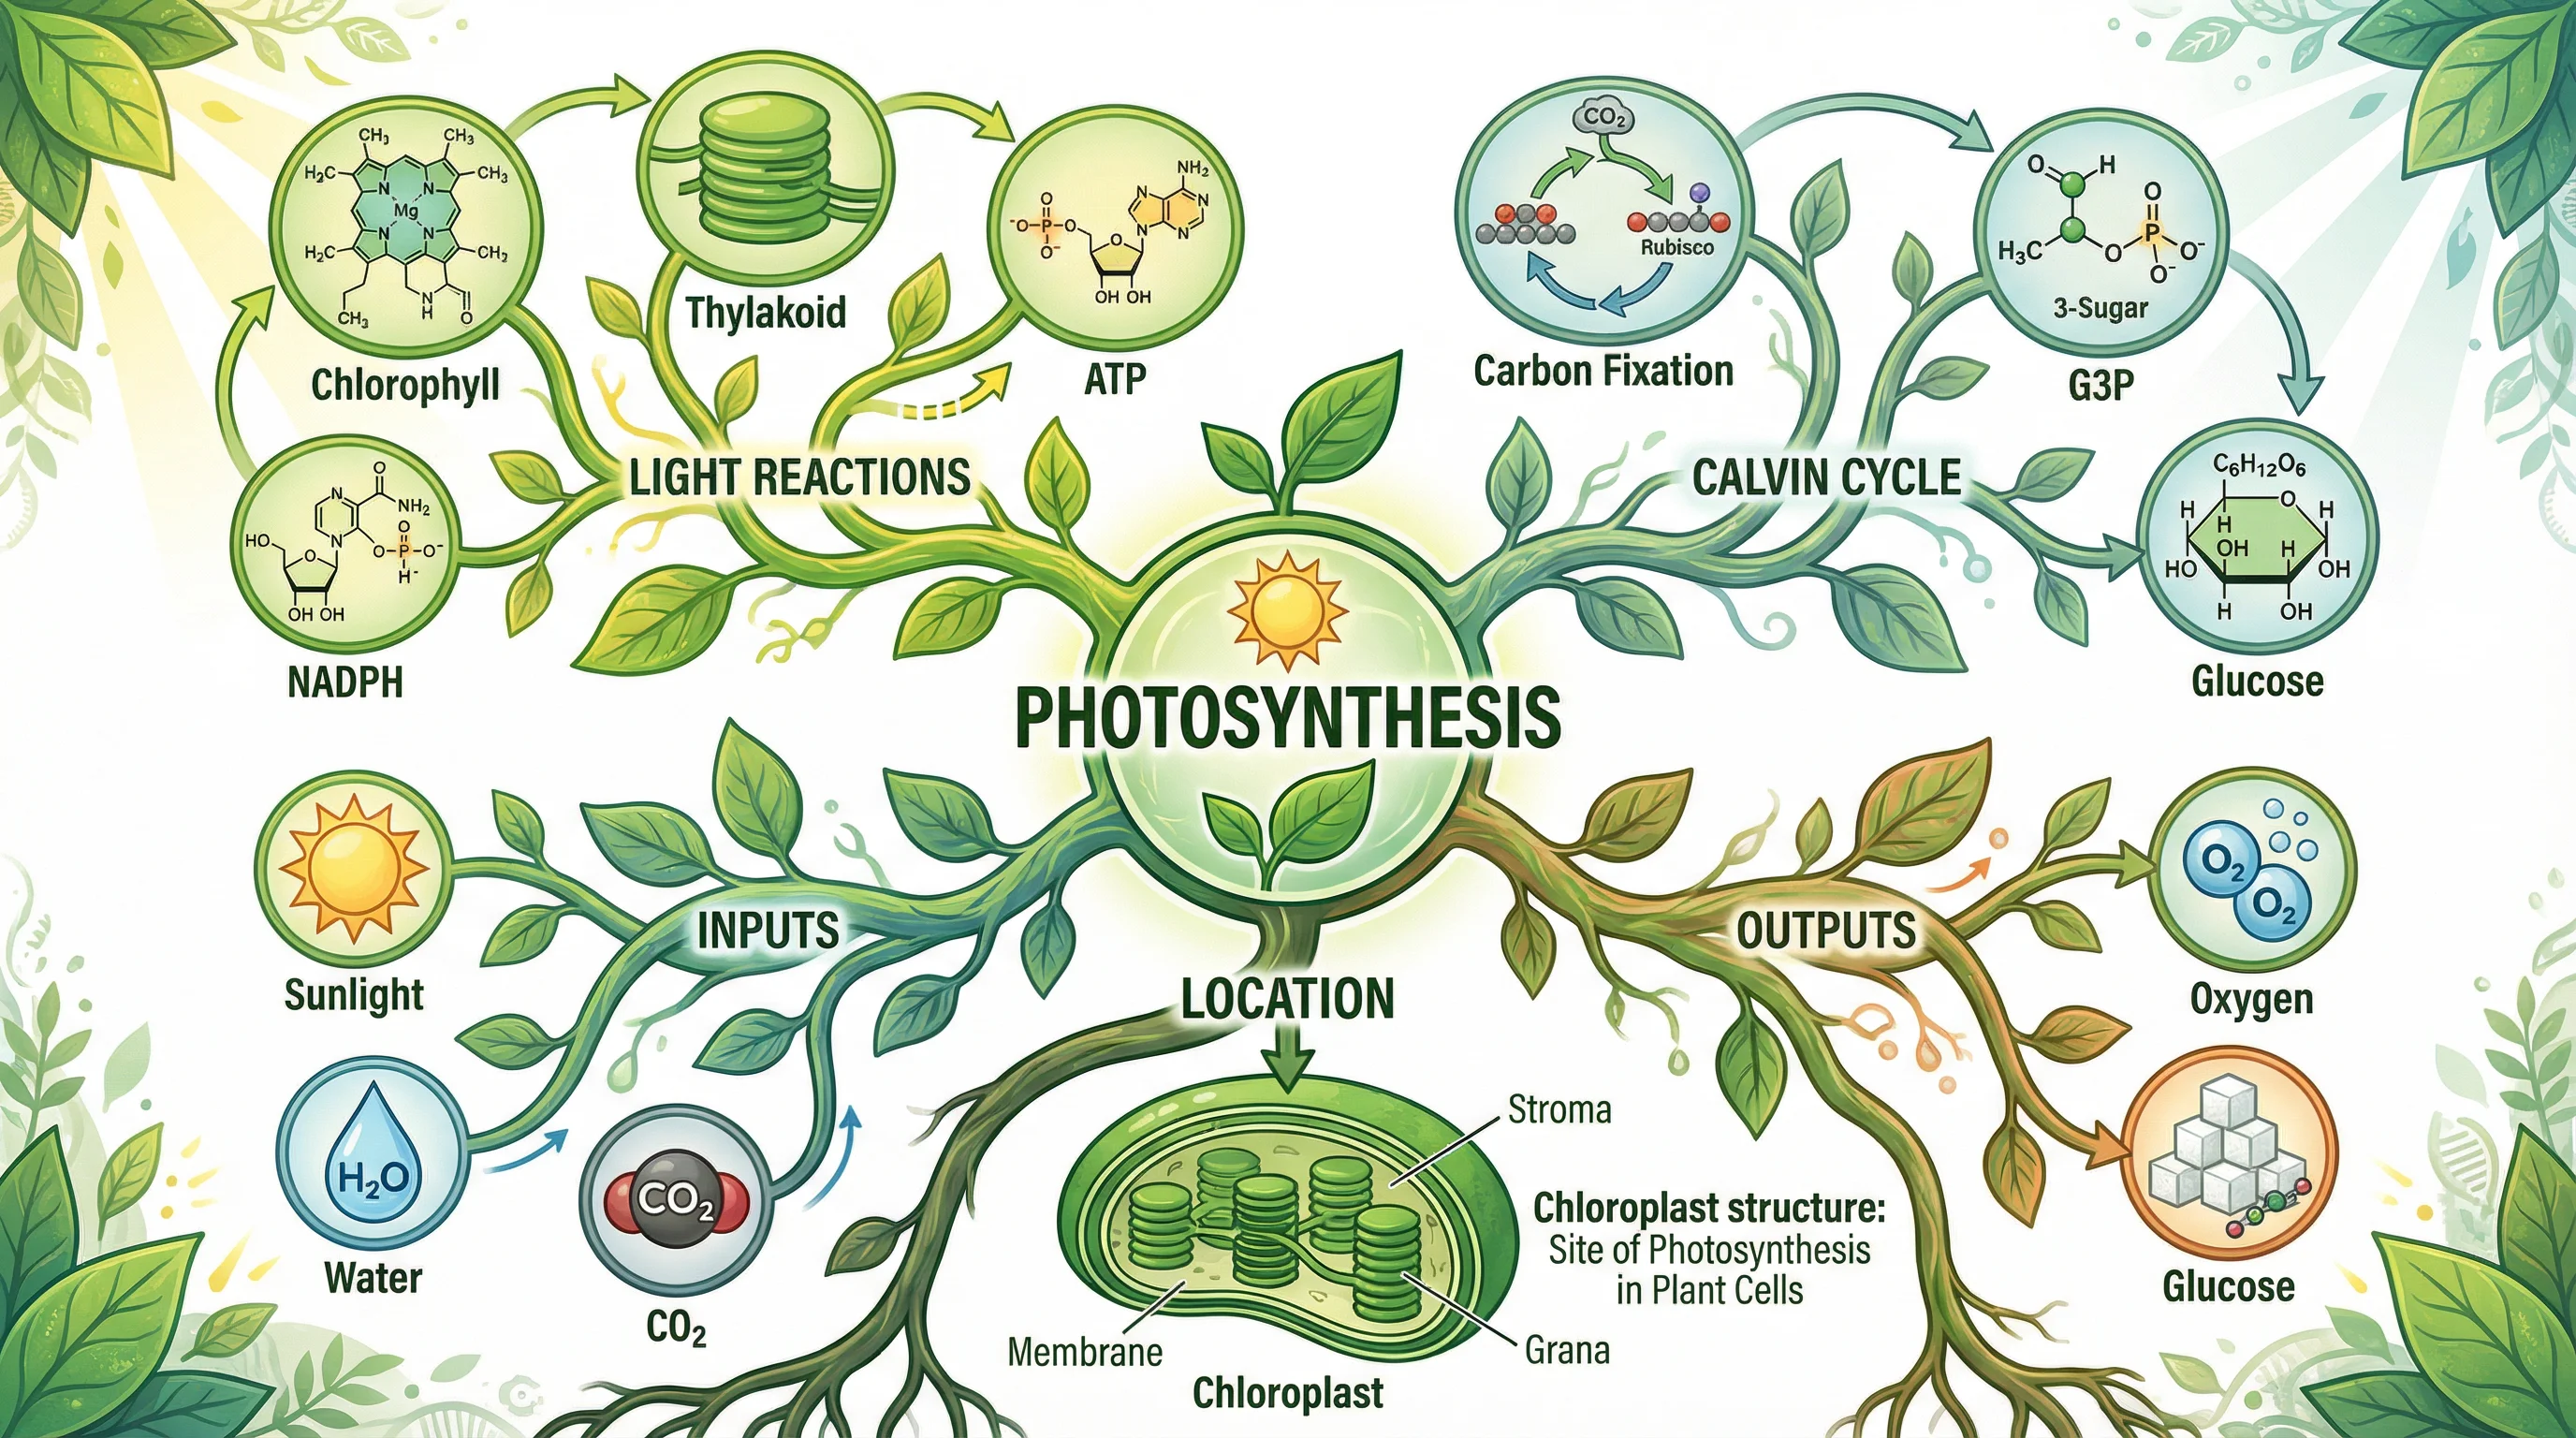
Mind Map Generator
Turn a topic into an organized mind map with branches and sub-branches.
 Visualization
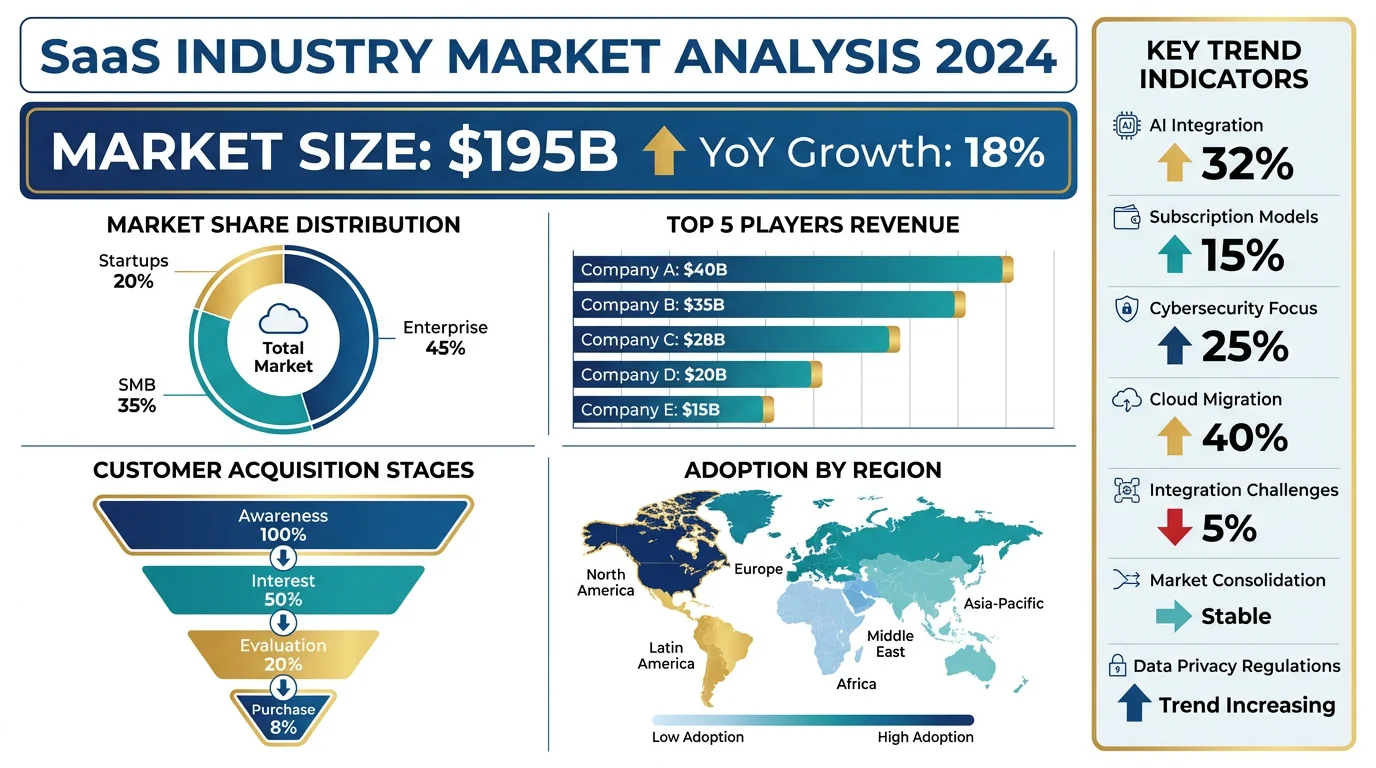
AI Infographic Generator
Create clean, shareable infographics from your data and key points.