
Best AI Scientific Illustration Tools in 2026: BioRender Alternatives Compared
Compare the best AI scientific illustration tools for 2026: BioRender, Mind the Graph, SciDraw, Illustrae, and more. Pricing, features, and honest reviews.
Best AI Scientific Illustration Tools in 2026: Complete Guide
This comparison is for people who already have BioRender in the tab, or who just saw FigureLabs, and need to decide which seat to pay for. It is not a promise that any tool — including ConceptViz — will pass a journal’s figure check on the first export.
If you only need the current BioRender numbers, read BioRender Pricing 2026. If you need the drawing method for an organ, read Anatomical Illustration for Research Papers.
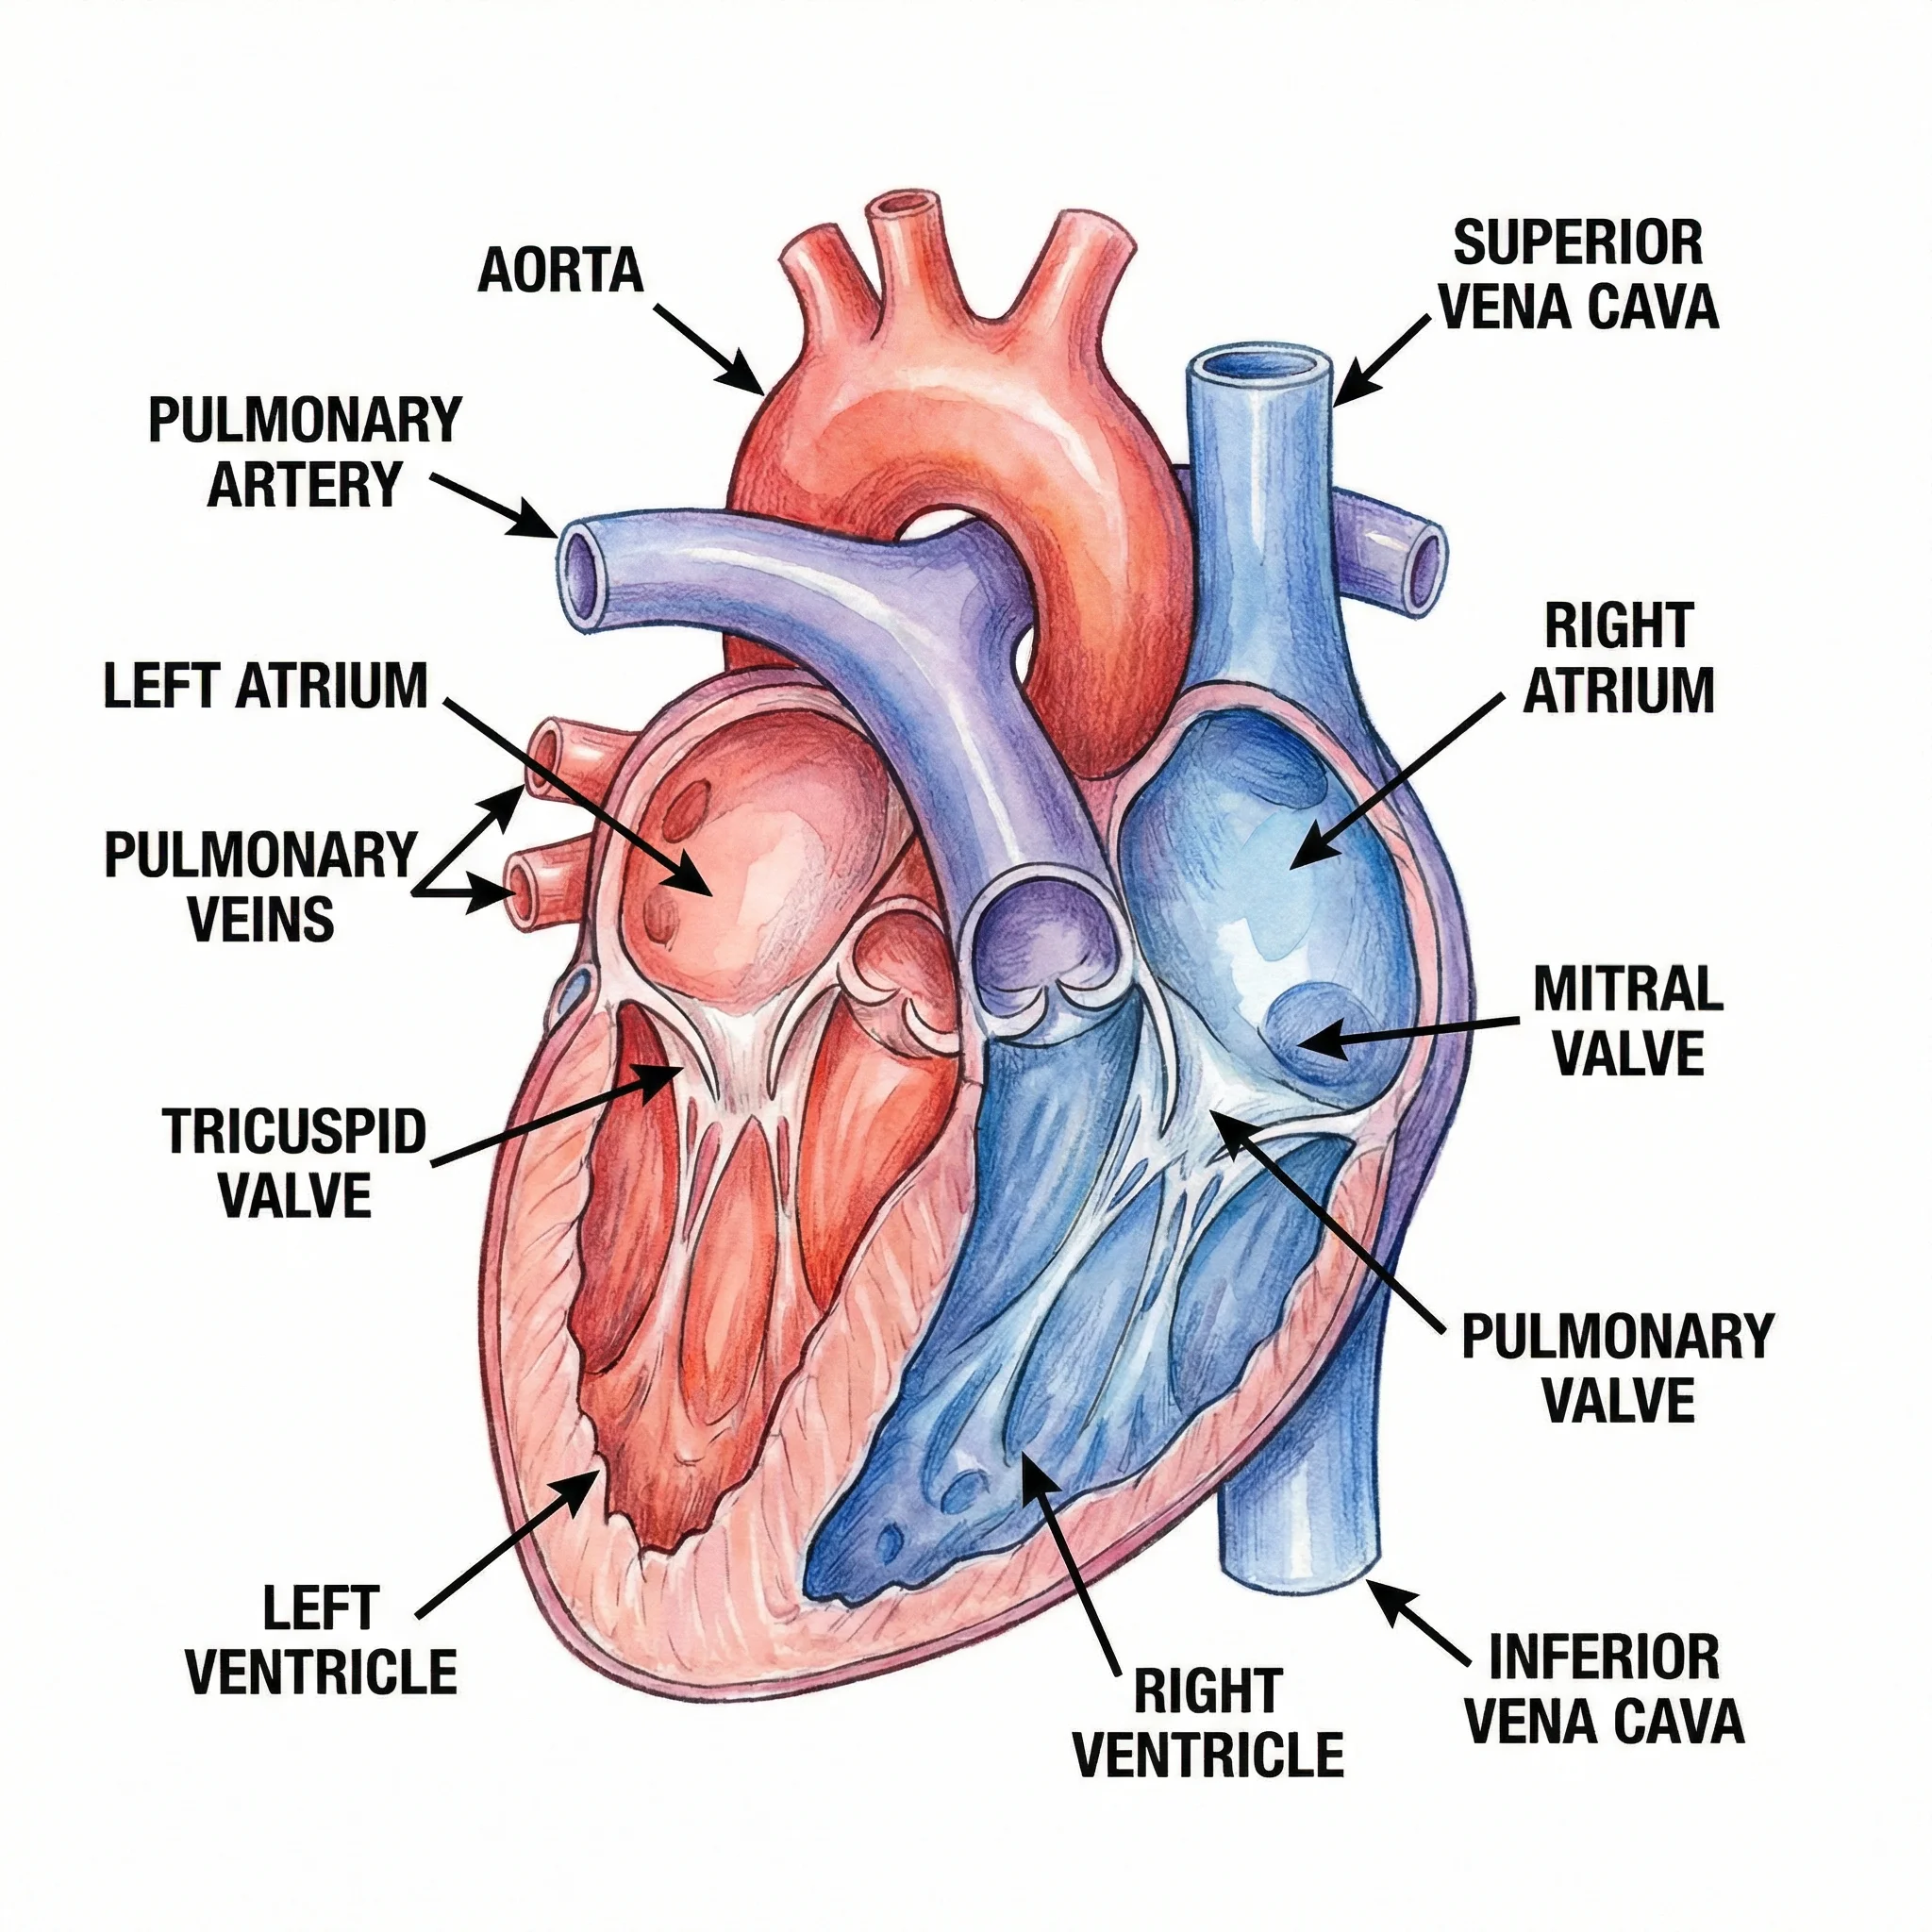
Medical Illustration Generator
Custom anatomy and surgical-plane figures when the icon library does not have your view. Check labels against a textbook before you submit.
Draft a medical figure →What this comparison is actually about
Five tools. Different jobs.
| Tool | Job it is built for | Price shape (Sep 2026) |
|---|---|---|
| ConceptViz | Custom one-off figures from a written brief | Credit packs, no seat |
| BioRender | Icon-based biology figures, shared lab language | Academic Individual $35/mo yearly ($39 monthly); Industry Individual $95/mo yearly |
| FigureLabs | AI text / sketch → figure, SVG / PPTX on paid plans | Free trial credits; paid from about $9/mo (Starter); confirm on figurelabs.ai |
| Mind the Graph | Stock scientific illustrations + editor | Subscription (confirm current) |
| Illustrae | AI scientific figures, billed per seat | Monthly / annual (confirm on illustrae.com) |
SciDraw (the community icon dump) is not on this table. It is a download site, not a 2026 AI product. Canva is a general design tool; it is not a scientific illustration platform.
The dimensions that matter (not a star rating)
| Dimension | Ask this |
|---|---|
| Library vs generation | Are you assembling known icons, or drawing a view that does not exist? |
| Who edits after | Can a co-author nudge one receptor, or do you regenerate? |
| License / citation | Free plan vs paid publication rights; does the vendor require a credit line? |
| Export | PNG only, or SVG / PPTX / AI you can still edit? |
| Cost for this paper | Another annual seat, or one credit pack? |
“Publication-ready” is a vendor slogan. Journals care about resolution, fonts, and whether the anatomy is correct. No generator removes that check.
1. ConceptViz — Best when the icon does not exist
ConceptViz generates a full illustration from a brief. Use it when BioRender’s library does not have your surgical plane, your mutant phenotype, or a graphical abstract that should not look like an icon collage.
It is weaker than BioRender when the lab already shares a folder of cells and you need to move one icon four pixels.
What it is good at
- Custom anatomy, mechanisms, and one-panel visual abstracts
- Pay-per-figure instead of a second lab seat
- Separate tools so you do not dump every request into one “scientific” box
What it is not
- Not an icon canvas with weekly lab templates
- Not unlimited generation
- Not a substitute for checking labels, scale bars, and journal size tables
Pricing
Credit packs (Standard and Pro). No monthly seat. Trial credits are not a production budget.
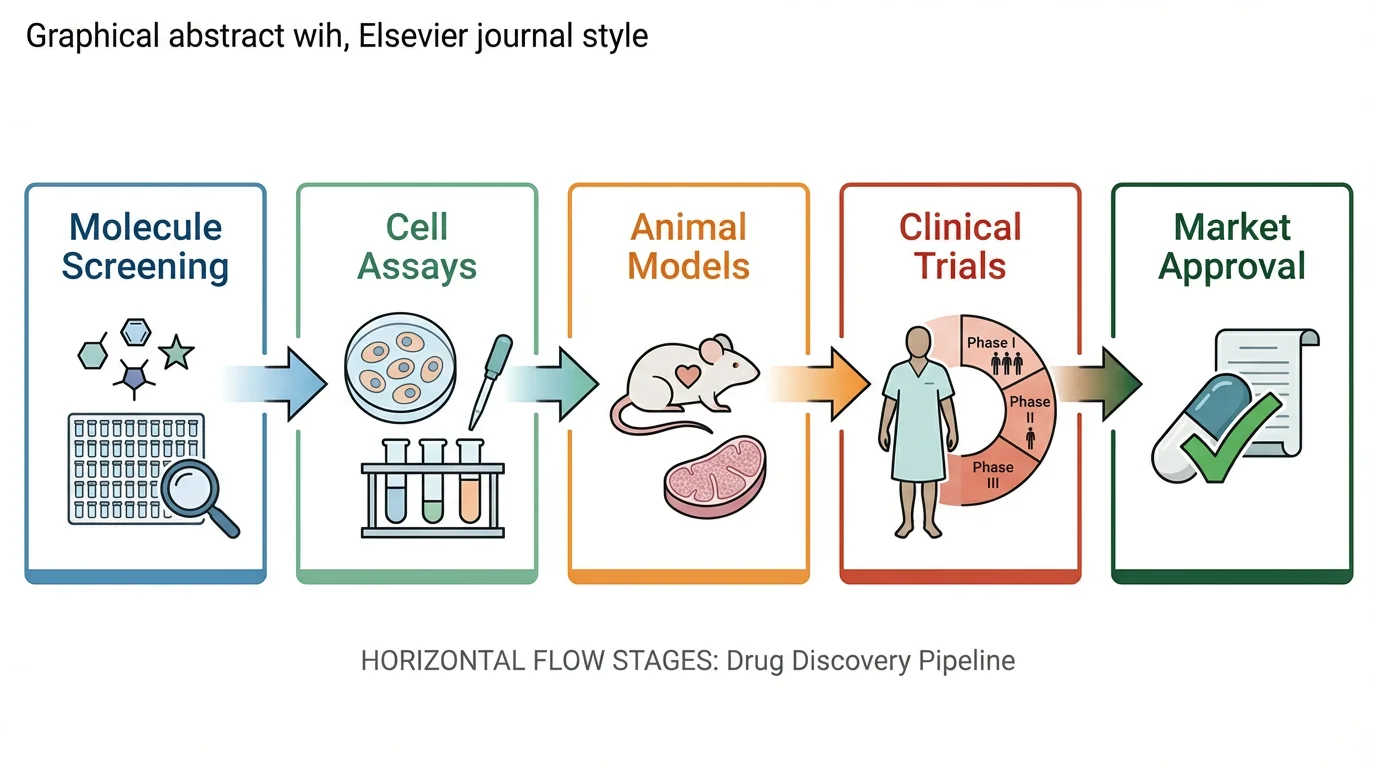
Graphical Abstract Maker
Single-panel visual abstract. Check Elsevier / Cell / Nature size tables before you export.
Draft a graphical abstract →
AI Scientific Image Generator
Mechanisms, cells, and methods figures from a written brief. Not a BioRender icon library.
Draft a scientific figure →
Custom anatomy is the usual reason people leave an icon tool. The labels still have to match a textbook.
2. BioRender — Best icon library for weekly biology figures
BioRender is still the default for cells, membranes, pathways, and experimental cartoons that must look like the rest of the lab’s papers.
Strengths
- Large, consistent icon language
- Shared folders and comments
- Institution seats (marginal cost near zero if the university already pays)
- Optional Graphing and AI add-ons (metered, not included in the base seat)
Limits
- You are assembling icons. Odd surgical views and non-bio figures fall off the library
- Paid plans still require a BioRender citation on completed graphics that include their content
- Free-plan figures are not cleared for journal PDFs
- Industry seats are a different price list than Academic
Pricing (list, yearly billing; monthly is higher)
From BioRender’s public pricing page (September 2026; full table in BioRender Pricing 2026):
| Plan | List price |
|---|---|
| Academic Individual | $35/mo billed yearly, or $39/mo |
| Academic Lab | Recent public listings: 5 seats about $99/mo yearly — confirm extra-seat math on BioRender |
| Academic Institution | Quote |
| Industry Individual | $95/mo billed yearly, or $115/mo |
| Industry Team | $5,700/year for 5 seats, or $570/month; extra seats $115/month |
Graphing: $15 / seat / month Academic, $49 Industry. AI-assisted generation: from $5 / month Academic, from $25 Industry, on annual billing. Those are add-ons.
3. FigureLabs — Best AI-native BioRender companion
FigureLabs (figurelabs.ai) is an Oxford-alumni product that sells text-to-figure, image-to-figure, and vector export as the main workflow, not a side add-on. Their own FAQ positions it as a BioRender companion: generate a base, export SVG / PPTX, finish layout in BioRender, PowerPoint, or Illustrator.
What they ship (from their site, Sep 2026)
- Generate from text, sketch / photo, or a reference
- Region redraw, text edit, background remove
- Paid plans: SVG and editable PPTX, built-in canvas, “publication authorization”
- Flowchart and plot products on the same account
- Free plan: one-time starter credits plus a daily refresh; they state free use is non-commercial
Limits (read their claims as claims)
- Credit-metered. A generation, a redraw, and a vector export each cost credits (their FAQ lists 50 / 60 / 150 as example costs — confirm before you budget a paper)
- “Clean SVG for journals” is their marketing. Your journal still has its own rules
- Weaker than BioRender if the job is only assembling the lab’s existing icon set
Pricing
They advertise scientific illustration from $9/month (Starter). Plus, Pro, Team, and Business sit above that. Public sale posts have shown Plus around $15/month on annual billing; treat that as a promo, not a permanent list. Confirm on figurelabs.ai/pricing.
4. Mind the Graph — Best stock-illustration hybrid
Mind the Graph sits between a clip-art library and an editor. Useful when you want a finished-looking scientific drawing and you are willing to browse a catalog.
Strengths
- Large stock set aimed at science
- Templates for common paper and poster layouts
- Usually cheaper than an Industry BioRender seat
Limits
- The look is recognizable if your field already uses the same stock cells
- Not the same as a custom anatomical view
- Confirm current publication license on their site — do not copy a 2024 blog’s terms
Pricing
Subscription. Public third-party pages still quote low monthly prices; verify on mindthegraph.com before you tell a PI a number.
5. Illustrae — Best if you already like their figure style
Illustrae is an AI scientific-illustration product billed per seat. Keep it in the comparison if a collaborator already works there. Do not pick it only because an older list ranked it “#3.”
Strengths
- AI generation aimed at papers and posters
- Seat pricing is easy to compare against Academic Individual
Limits
- Smaller public footprint than BioRender or FigureLabs
- Confirm export formats and commercial / journal terms on illustrae.com — we are not restating a stale feature sheet
Pricing
Monthly and annual seats. Confirm the current list before you renew anything.
Side-by-side
| ConceptViz | BioRender | FigureLabs | Mind the Graph | Illustrae | |
|---|---|---|---|---|---|
| Core motion | Prompt → custom figure | Icon assemble | Prompt / sketch → figure | Stock + editor | Prompt → figure |
| Best user | One-off custom view | Weekly biology cartoons | Fast AI draft + vector out | Catalog shoppers | Existing fans |
| Edit after | New brief / new generate | Nudge icons | In-app edit + SVG / PPTX (paid) | Editor | In-app (confirm) |
| Journal license | Your figure; you still check the journal | Paid plan + required citation | Paid “publication authorization”; free = non-commercial | Confirm current terms | Confirm current terms |
| Price model | Credits | Seat (+ add-ons) | Credits inside a seat | Seat | Seat |
| Typical cash out | One pack for this paper | $35/mo Academic Individual yearly; $95/mo Industry Individual yearly | From ~$9/mo Starter | Subscription | Seat |
How to choose
Stay on BioRender (or get the institutional seat) when you make icon-based biology figures every week and the lab already shares folders.
Add FigureLabs when you want an AI first pass and a vector file to finish in BioRender or PowerPoint — and you accept credit metering.
Add or switch to ConceptViz when the figure is custom anatomy, a non-icon graphical abstract, or a one-time grant line item. Do not buy a second BioRender seat for a single organ drawing.
Mind the Graph / Illustrae when a co-author already lives there or you specifically want their catalog / style.
Anatomical illustration method
Views, labels, and what journals actually reject — before you pick a vendor.
A visual abstract is a different job from a BioRender pathway cartoon. Use the tool that matches the panel, then check the journal’s size table.
Frequently Asked Questions
What is the best AI tool for scientific illustration in 2026?
There is no single best tool. BioRender is still the default for weekly icon-based biology figures. FigureLabs is the AI-native option with SVG / PPTX export on paid plans. ConceptViz is the pay-per-figure option when you need a custom view the library does not have. None of them remove the need to check anatomy and journal specs.
Is BioRender worth it in 2026?
Yes if you assemble biology icons every week or your university already pays for Institution. Less yes if you need one custom anatomical figure this quarter — Academic Individual is $35/month billed yearly, Industry Individual is $95/month billed yearly, and add-ons are extra. See our BioRender pricing 2026 breakdown.
Can I publish figures made with these tools in journals?
BioRender: paid Academic or Industry, plus their required citation on completed graphics that include BioRender content. FigureLabs: they state paid plans include publication authorization and free plans are non-commercial. ConceptViz: you own the export; you still have to meet the journal’s figure rules. Always read the current vendor terms before submission.
What is the difference between BioRender and FigureLabs?
BioRender is an icon library with optional AI. FigureLabs is an AI generator that sells vector export and editing as the core product, and they describe themselves as a companion you can finish in BioRender. Price and credit rules are different; confirm both sites before you add a second seat.
Are there free AI scientific illustration tools?
ConceptViz and FigureLabs both offer limited free credits. BioRender’s free plan is not cleared for journal PDFs. Free always means a cap, a watermark, or a non-commercial license — not unlimited publication figures.
Can AI replace a scientific illustrator?
No. AI is a first draft. A cover, a textbook plate, or a figure where one wrong vessel is a clinical error still needs a human who knows the anatomy. Use AI to get to a redline, not to skip the check.
Conclusion
Pay for the job, not the brand:
- Weekly icon biology: BioRender (or the campus seat)
- AI draft + vector out: FigureLabs, then finish in the tool your lab already uses
- Custom anatomy / visual abstract / one-off: Medical Illustration Generator, Graphical Abstract Maker, or AI Scientific Image Generator
Related: BioRender vs ConceptViz · FigureLabs vs ConceptViz · BioRender Pricing 2026 · Anatomical Illustration for Research Papers · How to Make a Graphical Abstract
Categories
More Posts

Free AI Graphical Abstract Makers for Research Papers (2026)
Compare the best free AI graphical abstract makers for researchers. Create journal-ready visual abstracts for Elsevier, Cell & Nature — no design skills needed.
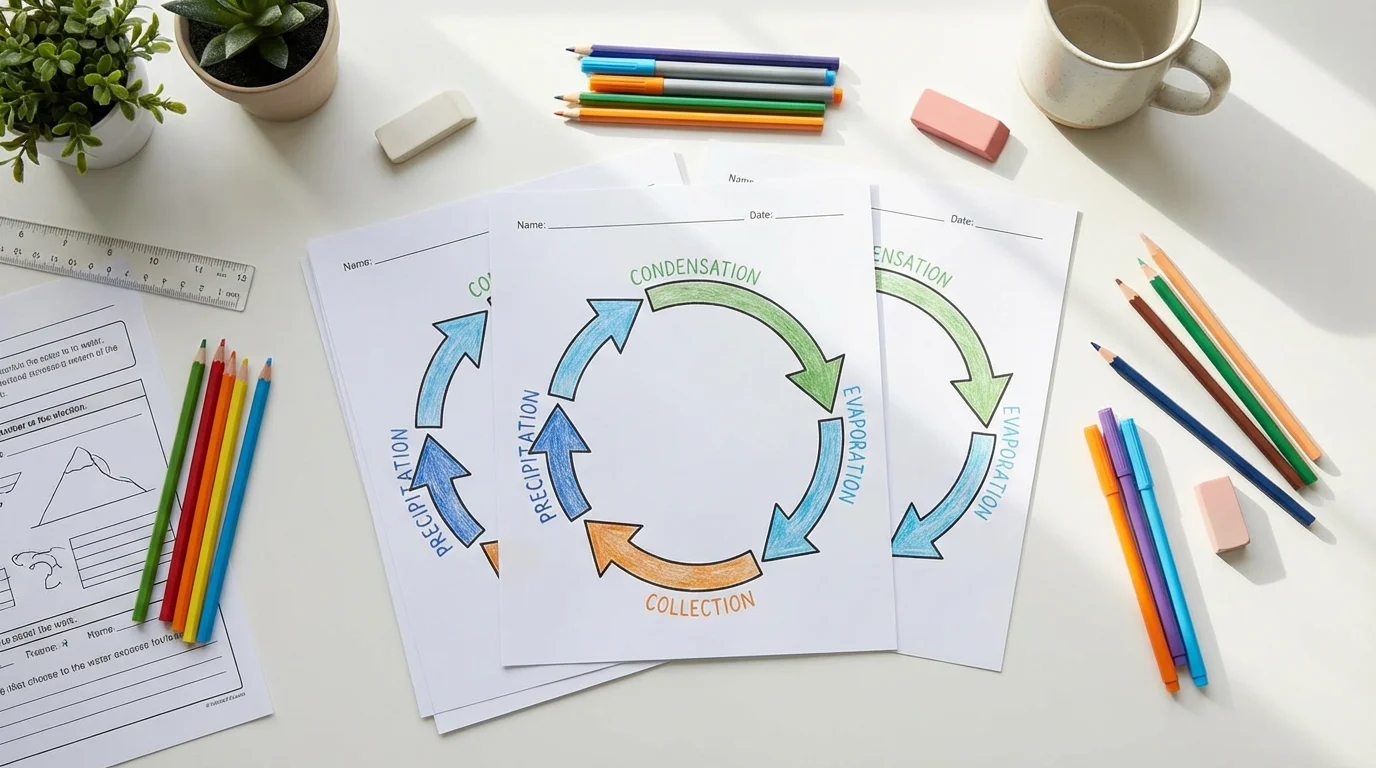
Free Printable Water Cycle Worksheets for Teachers (2026)
Free printable water cycle worksheets for elementary, middle, and high school, with labeled diagrams, blank quiz worksheets, and NGSS-aligned activities.
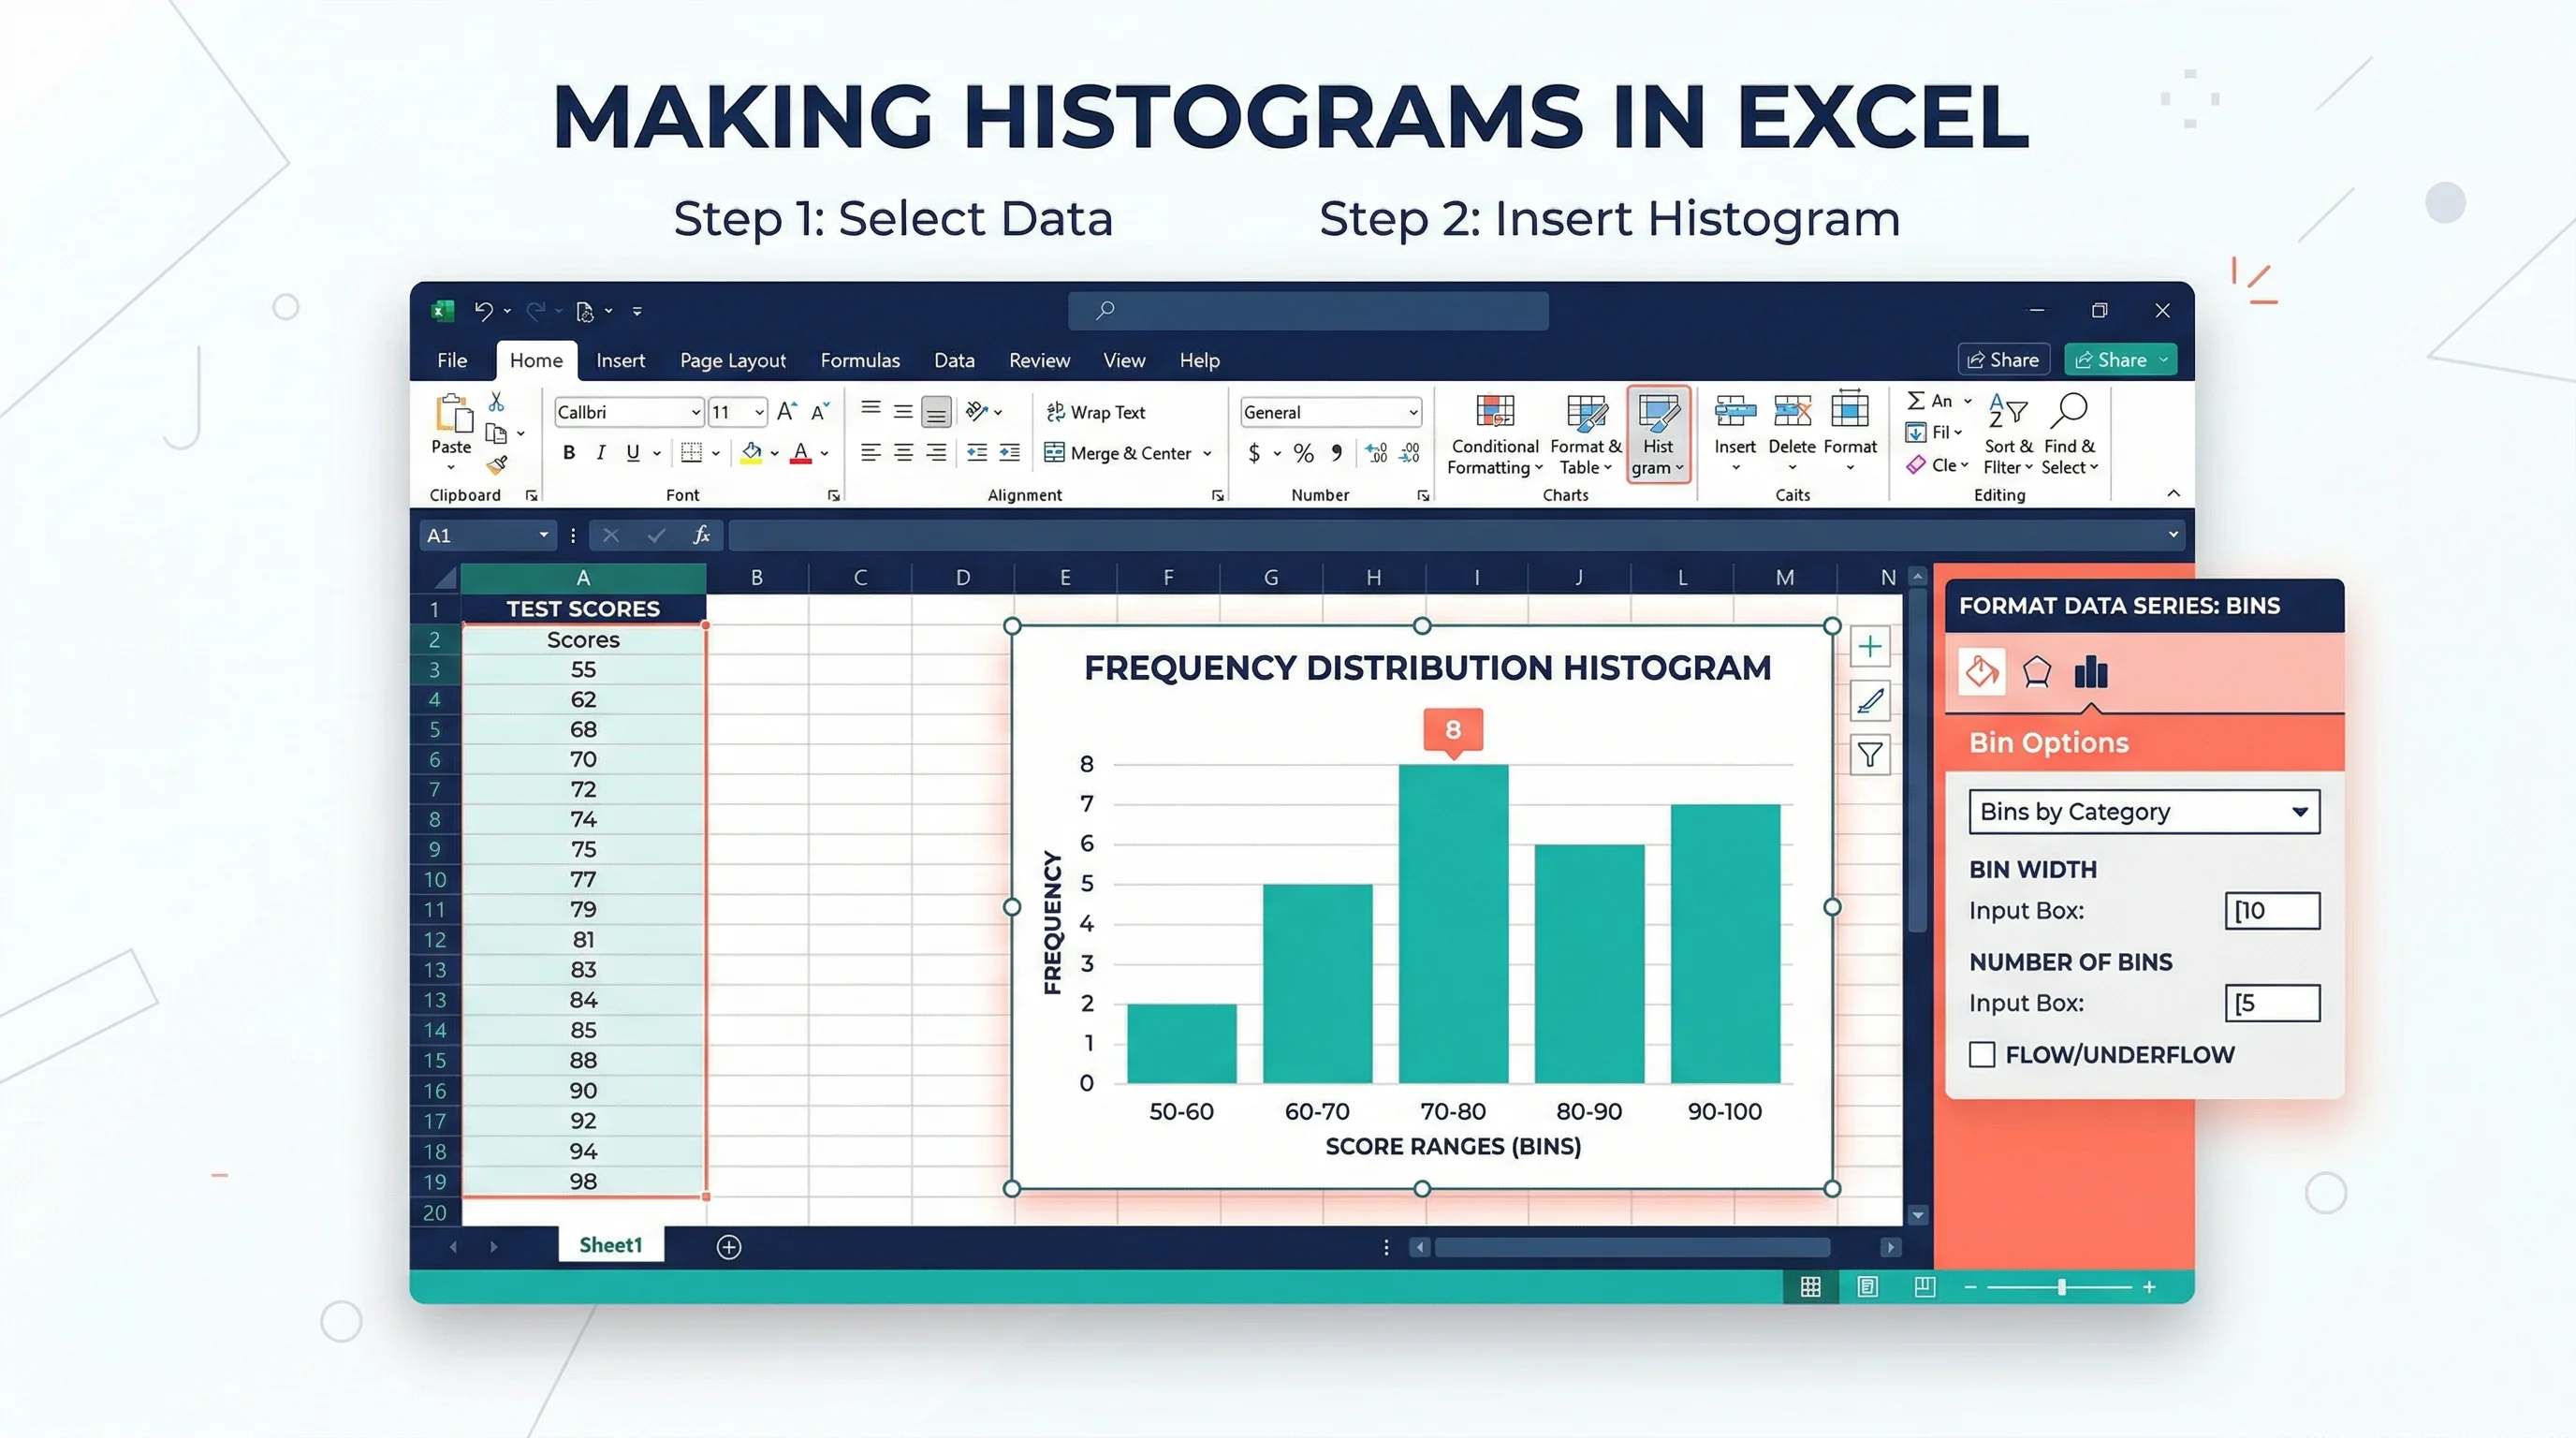
How to Make a Histogram in Excel: Step-by-Step Guide (2026)
Learn how to create a histogram in Excel with the built-in Histogram chart, bin controls, and formatting tips. Covers Excel 365, 2024, 2021, 2019, and 2016.