
How to Make a Schematic Diagram: Step-by-Step Guide for Scientists and Students
Learn how to make a schematic diagram for science, lab experiments, and research. Step-by-step guide covering rules, symbols, software tools, and examples for biology, chemistry, and physics.
A schematic diagram is one of the most important communication tools in science. Whether you are documenting a distillation setup for a chemistry lab report, mapping the signal path in a physics experiment, or illustrating a gel electrophoresis protocol for a paper, a clear schematic diagram shows your reader exactly how your experiment works — often better than paragraphs of text ever could.
This guide walks you through everything you need to know about how to make a schematic diagram: the conventions, the step-by-step process, subject-specific examples, and the tools that make the job faster.
Schematic Diagram Maker
Generate accurate schematic diagrams for lab setups, chemistry apparatus, and experimental systems with AI.
Try it free →What Is a Schematic Diagram?
A schematic diagram is a simplified, symbolic representation of a system or process. Unlike a realistic illustration that tries to look like the actual object, a schematic diagram uses standardized symbols and connecting lines to show how components relate to each other — prioritizing function and flow over visual accuracy. ScienceDirect defines schematic diagrams as graphical representations that "use abstract, often standardized symbols and lines to depict the components and interconnections within a system."
In science and engineering, schematic diagrams appear in several forms:
| Type | Used In | What It Shows |
|---|---|---|
| Lab apparatus diagram | Chemistry, biology | Physical setup of equipment for an experiment |
| Circuit diagram | Physics, electronics | Connections between electronic components |
| Block diagram | Engineering, systems science | High-level flow between functional units |
| Process flow diagram | Biochemistry, chemical engineering | Steps in a chemical or biological process |
| Biological pathway diagram | Molecular biology, pharmacology | Molecular interactions and signaling cascades |
The common thread: schematic diagrams use agreed symbols, clean lines, and minimal decoration to convey maximum information.
Why Schematic Diagrams Matter in Science
Examiners, journal reviewers, and lab partners use schematic diagrams to quickly check whether you understand how your experiment works. A poorly drawn diagram — with unlabeled components, crossed leader lines, or inaccurate proportions — raises immediate doubts about the quality of your thinking.
A well-constructed schematic diagram does the following:
- Lets readers replicate your experimental setup from the figure alone
- Identifies potential safety issues (e.g., one-way valves in gas collection setups)
- Provides a permanent record of the exact configuration used in a study
- Satisfies journal and examiner requirements for methodological transparency
For guidance on broader scientific illustration standards, see our guide to making scientific diagrams for research papers.
The Golden Rules of Scientific Schematic Diagrams
Before picking up a pencil or opening software, internalize these rules. They apply across biology, chemistry, and physics:
1. Use standard symbols, not realistic drawings Draw apparatus using cross-sectional symbols (e.g., a beaker shown as a rectangle with a curved bottom, not a photograph). This is especially important for chemistry lab diagrams.
2. Draw in two dimensions Schematic diagrams are always 2D, even if the real apparatus is 3D. Never attempt to draw in perspective.
3. Keep lines clean and continuous Use single, unbroken lines for connections. Avoid overlapping lines where possible. Where two lines cross without connecting, use a bridge symbol (a small arc over one line).
4. Label everything Every component, chemical, or stage needs a label. Place labels horizontally outside the diagram, connected to their component with a straight leader line using a ruler.
5. Show direction of flow Use arrows to show the direction of electrical current, gas flow, fluid movement, or reaction progression.
6. Add a descriptive title The title should describe exactly what the diagram represents: "Apparatus for the Preparation and Collection of Carbon Dioxide by Acid–Carbonate Reaction" is better than "CO₂ Setup."
Step-by-Step: How to Make a Schematic Diagram
Step 1: Define the scope before you draw
Decide what your diagram needs to show. Ask yourself:
- What is the starting material or input?
- What are the main stages or components?
- What is the output or endpoint?
- What level of detail does the reader need?
For a lab report, you typically show the full apparatus from input to output. For a research paper methods section, you may need a higher-level block diagram that shows the experimental pipeline.
Step 2: Sketch the flow on paper first
Even if you plan to use software, rough out the diagram on paper first. Draw boxes or symbols for each component, then arrange them in a logical left-to-right or top-to-bottom flow. This prevents the common mistake of starting in software and then realizing the layout doesn't work.
Step 3: Use the correct symbols for your discipline
Chemistry lab apparatus: Draw cross-sections of glass equipment. A conical flask is shown as a triangle with a short neck. A round-bottom flask is an oval with a neck. Tubing is shown as two parallel lines.
Physics and electronics: Use IEC or IEEE standardized circuit symbols. Resistors, capacitors, batteries, and switches all have specific symbols that must be used consistently.
Biology pathway diagrams: Use standard arrow types — activation arrows (→), inhibition bars (⊣), and phosphorylation symbols (circled P). Check the conventions of the specific field (e.g., biochemistry uses different notations from cell signaling).
Step 4: Place components and connect them
Arrange components so the flow reads naturally (left to right or top to bottom for most Western audiences). Connect components with clean, straight lines. Use right-angle bends rather than diagonal lines where possible — they look more professional and are easier to label.
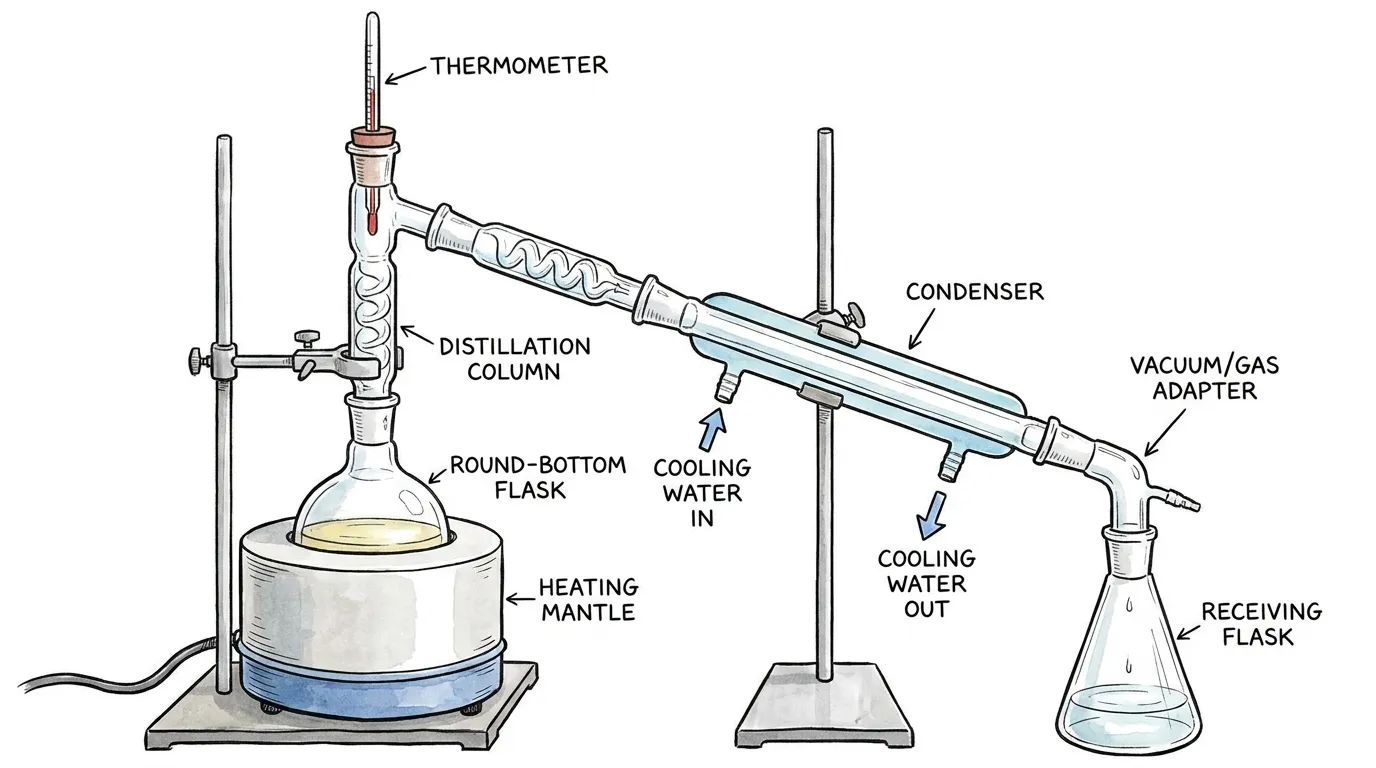
A schematic diagram of a laboratory distillation setup showing each component in standard cross-sectional style with directional flow arrows.
Step 5: Add labels with ruler-drawn leader lines
Label every component. For lab apparatus diagrams:
- Draw leader lines horizontally or at 45° angles using a ruler
- Never let leader lines cross each other
- Place all label text horizontally (never vertically)
- Use correct scientific terminology ("condenser," not "cooling tube")
For circuit diagrams, label component values next to the symbols (e.g., "10 kΩ" next to a resistor, "9V" next to a battery).
Step 6: Add directional arrows and annotations
Show which direction things flow. In chemistry diagrams, arrows typically show gas flow or the direction of distillate travel. In circuit diagrams, arrows show conventional current direction. In biological pathway diagrams, arrows show the direction of signal propagation.
Add short annotations where needed — for example, a temperature label at a heating element, or a note indicating "cooling water in/out" at a condenser.
Step 7: Write the title and add a scale if needed
Place a descriptive title below or above the diagram. For microscopy and magnified diagrams, include a scale bar or magnification factor. For circuit diagrams, include a legend if you have used non-standard symbols.
Schematic Diagram Examples by Discipline
Chemistry: Lab Apparatus Diagrams
Chemistry schematic diagrams follow very specific conventions taught in high school and reinforced through university. The key rules:
- All glassware drawn in cross-section (showing the inside, not a 3D view)
- Heat sources shown with the standard Bunsen burner or triangle symbols
- One-way valves and safety traps included wherever back-siphoning is a risk
- All chemical labels included with concentration and volume where relevant

Schematic diagram of an electrolysis cell showing cathode, anode, electrolyte solution, and the direction of ion movement.
Common chemistry schematic diagrams students must master:
- Distillation and fractional distillation apparatus
- Gas collection (over water and by upward/downward displacement)
- Titration setup
- Electrochemical cells and electrolysis cells
- Reflux apparatus
Biology: Lab Protocol and Pathway Diagrams
Biology schematic diagrams range from lab procedure diagrams (showing PCR setups, gel electrophoresis rigs, and centrifugation protocols) to molecular pathway diagrams (signal transduction, gene expression, metabolic cycles).
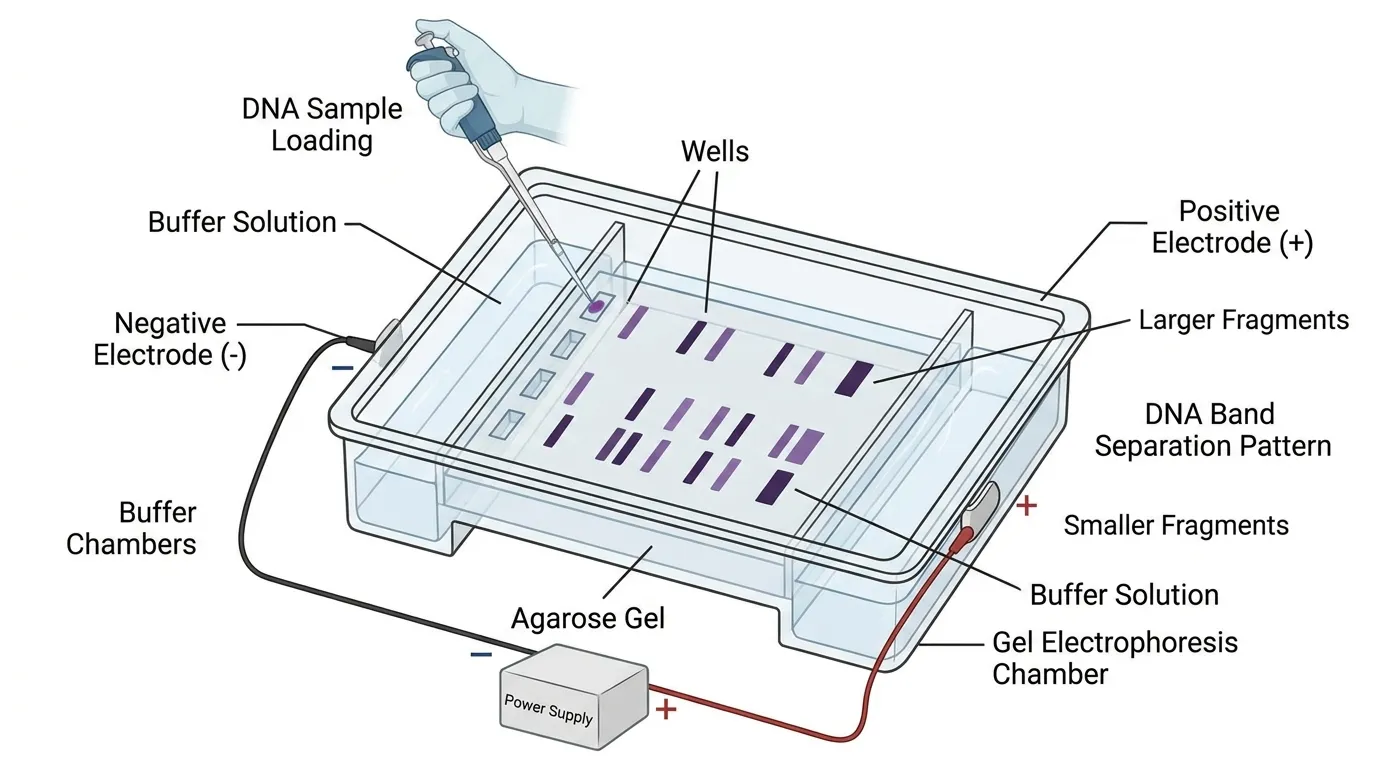
Schematic diagram of a gel electrophoresis apparatus showing the horizontal gel tank, agarose slab, sample wells, buffer solution, and electrode polarity.
For lab procedure diagrams, include the key equipment and show the sequence of steps. For pathway diagrams, use standard arrow conventions and clearly distinguish activation from inhibition.
For a deeper dive into biological illustration conventions, see our Biology Drawing Guide.

Schematic diagram of a PCR thermal cycler showing the three temperature stages (denaturation, annealing, extension) and the cycling block structure.
Physics: Circuit and Optical Diagrams
Physics schematic diagrams are among the most strictly standardized in all of science. Circuit diagrams use IEC or IEEE symbols with no deviation. Ray diagrams use specific arrow conventions for light direction.
For circuit diagrams specifically, see our detailed guide to creating circuit diagrams online.
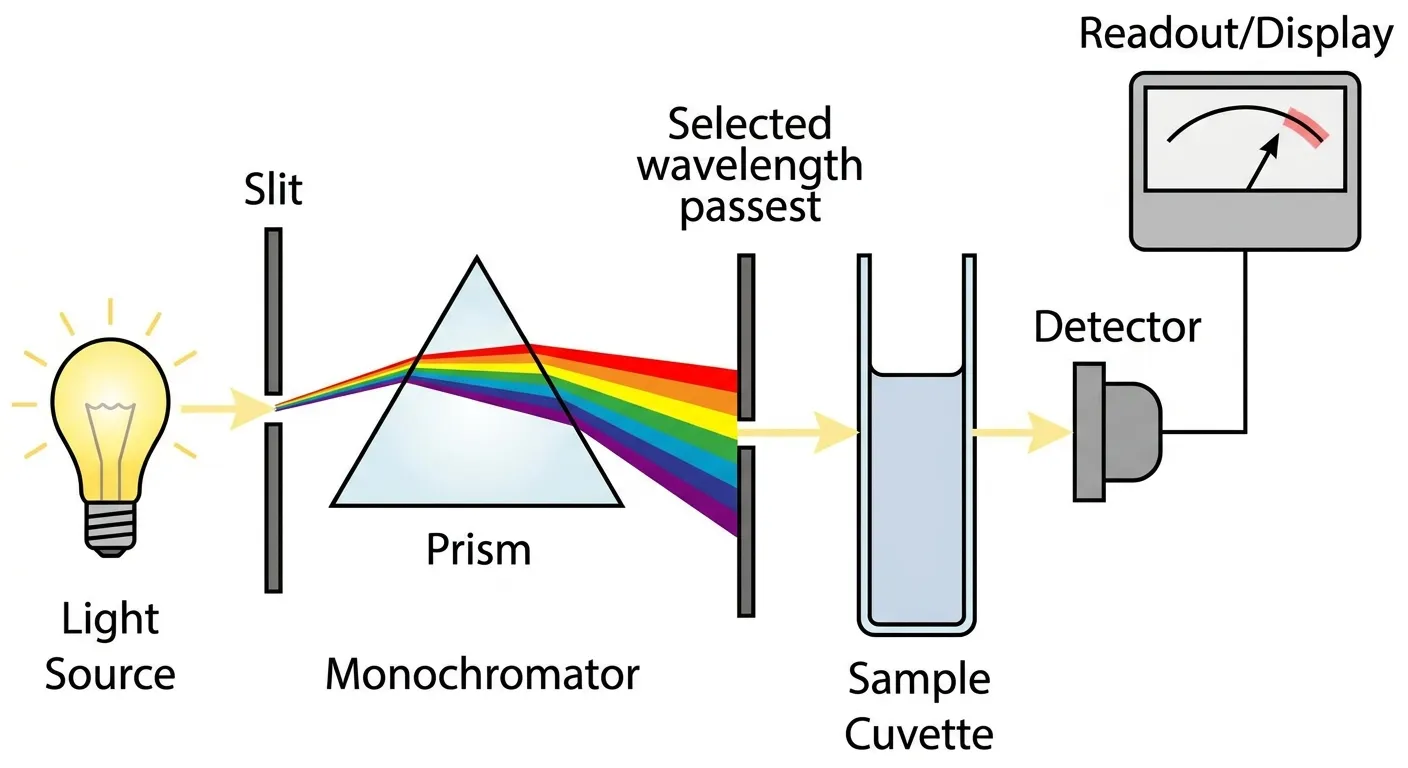
Schematic diagram of a spectrophotometer showing the optical path from the light source through the monochromator, sample cuvette, and to the photodetector.
Key physics schematic diagrams to master:
- Series and parallel circuit diagrams
- Ray diagrams for lenses and mirrors
- Force diagrams (free body diagrams)
- Optical bench setups
- Wave interference patterns
Choosing the Right Tool: Hand Drawing vs. Software vs. AI
The right tool depends on your situation:
| Situation | Best Tool | Why |
|---|---|---|
| Exam or lab notebook | Hand drawing with pencil + ruler | Required; no software available |
| Thesis or journal paper | Vector software (Inkscape, Illustrator) or AI | Print-ready quality, editable |
| Quick reference or homework | AI generator (ConceptViz) | Fast, labeled, no software skills needed |
| Electronics/engineering | Dedicated tools (KiCad, LTspice, Eagle) | Specialized symbols and simulation |
| Chemistry lab diagrams | Chemix (free, browser-based) | Specialist tool with chemistry apparatus library |
For hand drawing: Use an HB pencil for lines, a ruler for all straight lines and leader lines, and erase cleanly before inking. Follow the conventions of your discipline exactly — examiners check for standard symbols. Portland State University's guidelines for preparing schematic diagrams provide a useful reference for chemistry lab reports.
For digital diagrams in research papers: Vector formats (SVG, PDF) are essential — raster diagrams will pixelate when the paper is printed. Inkscape is free and capable; Adobe Illustrator is the industry standard.
For chemistry lab diagrams specifically: Chemix is a free, browser-based editor built specifically for drawing lab apparatus diagrams — it includes a full library of standard chemistry equipment symbols and requires no software installation.
For speed: AI tools like the ConceptViz Schematic Diagram Maker generate labeled scientific schematic diagrams from a text description in seconds — useful for creating reference diagrams, study materials, and draft figures before polishing in a vector editor.
Schematic Diagram Maker
Generate labeled schematic diagrams for chemistry, biology, and physics experiments with AI.
Common Mistakes to Avoid
Drawing realistic rather than schematic Students often draw what the apparatus looks like rather than its schematic symbol. A round-bottom flask should be drawn as a circle with a neck — not as a detailed 3D illustration. The moment you start shading or showing thickness of glass walls, you have crossed from schematic to illustration.
Forgetting flow direction A schematic diagram without directional arrows leaves the reader guessing. Always show which way things move: current, gas, liquid, signal, or information.
Crossed leader lines Leader lines that cross other leader lines or cross the diagram itself look messy and confuse the reader. Plan your label positions before drawing leader lines. If necessary, use a key or legend instead of trying to label every component with a direct leader line.
Missing components Every component that affects the experiment needs to appear in the diagram. A distillation setup missing the thermometer or a circuit diagram missing the ammeter will lose marks and may indicate to reviewers that you did not understand the setup.
Inconsistent line weights Use the same pen or pencil pressure throughout. The boundary of the main apparatus can be slightly thicker to distinguish it from internal details and connecting tubing, but otherwise keep line weights consistent.
No title An untitled schematic diagram is incomplete. The title should describe exactly what the diagram represents, specific enough that a reader can understand it without reading the surrounding text.
For a broader look at science drawing conventions for students, see our science drawings guide for students.
Related Reading
- How to Create Circuit Diagrams Online — Detailed guide to electronics schematic conventions and tools
- Biology Drawing Guide — Scientific illustration techniques for biological specimens and processes
- How to Make Scientific Diagrams for Research Papers — Publication-standard figure preparation for journals
- Chemix — Free browser-based chemistry lab diagram tool (external)
- Schematic Diagram overview — ScienceDirect Topics — Academic definition and context (external)
- EdrawMax Science Diagram Guide — Types, examples, and software overview (external)
Frequently Asked Questions
What is the difference between a schematic diagram and a circuit diagram?
A circuit diagram is a type of schematic diagram specifically used to show electrical circuits using standardized electronic component symbols (resistors, capacitors, switches, etc.). The term 'schematic diagram' is broader and includes circuit diagrams as well as lab apparatus diagrams, biological pathway diagrams, block diagrams, and process flow diagrams. All circuit diagrams are schematic diagrams, but not all schematic diagrams are circuit diagrams.
What symbols are used in schematic diagrams?
The symbols depend on the discipline. In chemistry, standard cross-sectional shapes represent glassware (triangles for conical flasks, ovals for round-bottom flasks) and specific symbols represent Bunsen burners, condensers, and safety equipment. In electronics/physics, IEC or IEEE standardized symbols represent resistors, capacitors, batteries, switches, diodes, and transistors. In biology, arrows with different styles indicate activation (→), inhibition (⊣), and phosphorylation. Always use the symbol set specified by your curriculum, institution, or target journal.
How do I draw a schematic diagram by hand?
Use a sharp HB pencil, a ruler for all straight lines, and plain white unlined paper. Sketch the layout lightly first, then draw the main components using standard symbols for your discipline. Connect components with clean straight lines using the ruler. Add labels with horizontal leader lines (never freehand). Write a descriptive title. Review against the actual apparatus to check for missing components. Finally, go over the diagram with a fine-tip pen (0.3mm or 0.5mm) if a clean ink version is needed.
What is a schematic diagram used for in science?
In science, schematic diagrams are used to document experimental setups (chemistry lab apparatus, physics rigs), communicate methods in research papers and lab reports, illustrate biological processes (molecular pathways, enzyme mechanisms, physiological cycles), and show the design of systems or devices (electronic circuits, spectroscopy setups, imaging systems). They are a standard requirement in school and university science exams, and in methods sections of scientific publications.
Can I use AI to make a schematic diagram?
Yes. AI tools like ConceptViz's Schematic Diagram Maker can generate labeled schematic diagrams from text descriptions — for example, describing a distillation setup or a PCR apparatus and receiving a clean labeled diagram in seconds. AI-generated diagrams are useful as reference diagrams for study, as starting points for polishing in vector software, or for creating figures for presentations and grant documents. For exam diagrams, hand drawing is still required.
How do I label a schematic diagram correctly?
Labels should be placed outside the diagram, connected to their component with a straight ruler-drawn leader line ending with a small dot or arrow at the component. All label text should be horizontal (never angled or vertical). Leader lines should never cross each other. Use standard scientific terminology — write 'condenser' not 'cooling tube,' 'electrolyte solution' not 'liquid in the middle.' For complex diagrams with many components, number the components and provide a numbered key alongside the diagram.
What is the difference between a schematic diagram and a wiring diagram?
A schematic diagram uses abstract standardized symbols to show how components function and connect — it prioritizes the logical flow of a system. A wiring diagram shows the physical layout and actual routing of wires or connections — it prioritizes the real-world spatial arrangement to help with installation and troubleshooting. In electronics, you would use a schematic diagram to understand how a circuit works and a wiring diagram to connect the physical components correctly.
What software is best for making schematic diagrams?
The best software depends on your discipline. For chemistry lab apparatus: Chemix (free, browser-based, specialist tool). For electronics circuits: KiCad or LTspice (both free and powerful). For general scientific diagrams: Inkscape (free vector editor) or Adobe Illustrator (industry standard). For AI-generated scientific schematics across disciplines: ConceptViz Schematic Diagram Maker. For simple diagrams and classroom use: Google Slides or PowerPoint with a shape library.
Categories
More Posts
")
UML Diagram Types Explained: Class, Sequence & Use Case Guide (2026)
Learn the 14 UML diagram types with examples. Step-by-step guide to creating class diagrams, sequence diagrams, and use case diagrams for software projects.
")
Block Diagrams Explained: How to Create One with Examples (2026 Guide)
Learn what block diagrams are and how to create them step by step. Covers system block diagrams, functional block diagrams, and process block diagrams with real examples.
")
8 Best Free ChemDraw Alternatives in 2026 (For Drawing Chemical Structures)
Compare the best free ChemDraw alternatives: ChemSketch, MarvinSketch, MolView, ChemDoodle & more. Draw chemical structures without expensive subscriptions.