树状图制作工具 AI智能生成
描述您的层级结构或分类,AI将即时生成专业树状图。适用于系统发育学、分类学、概率分析和决策树。
树状图生成器
By using ConceptViz, you agree not to generate or edit adult, sexual, explicit, unsafe, or policy-violating content. See Content Policy.
免费试用 ·
树状图将在此处显示
描述您的层级结构,然后点击生成
树状图示例
浏览不同领域的示例,或在上方自行生成
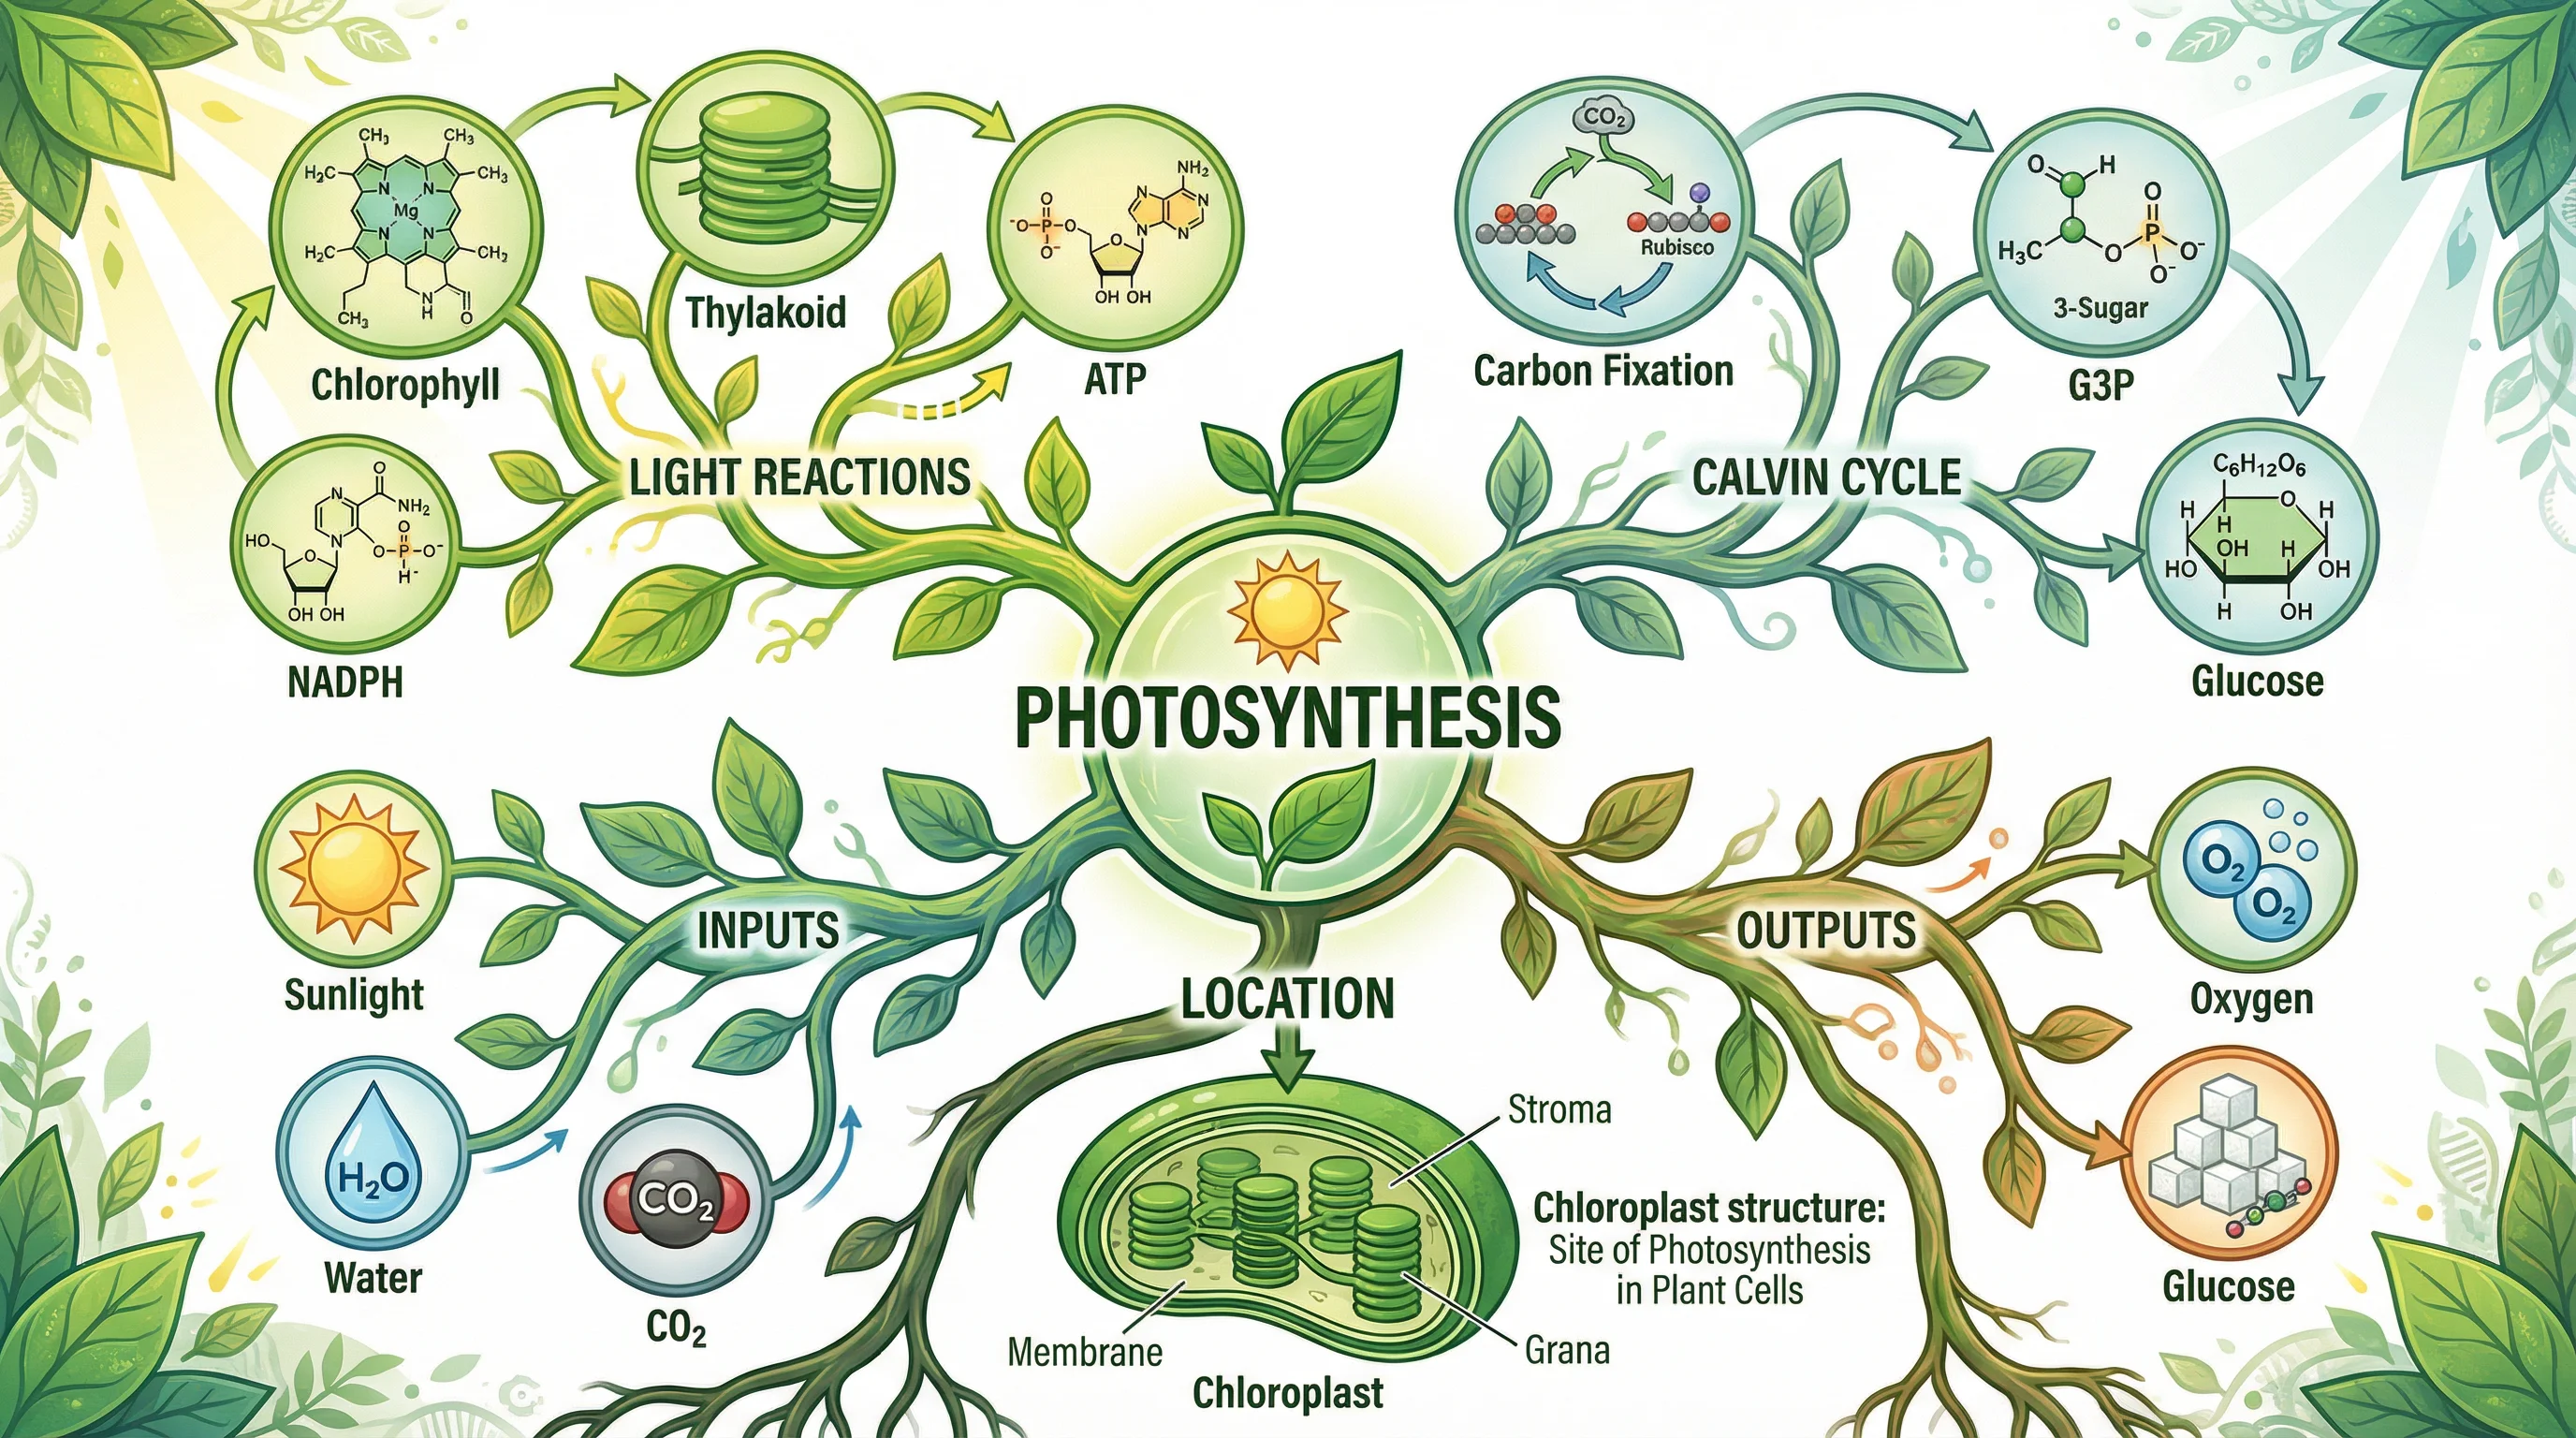
系统发育进化树
系统发育树,展示脊椎动物各类群的进化分歧,适合生物学课程和研究论文。
分类学分类树
完整的分类学分类树,展示从界到种的层级体系。
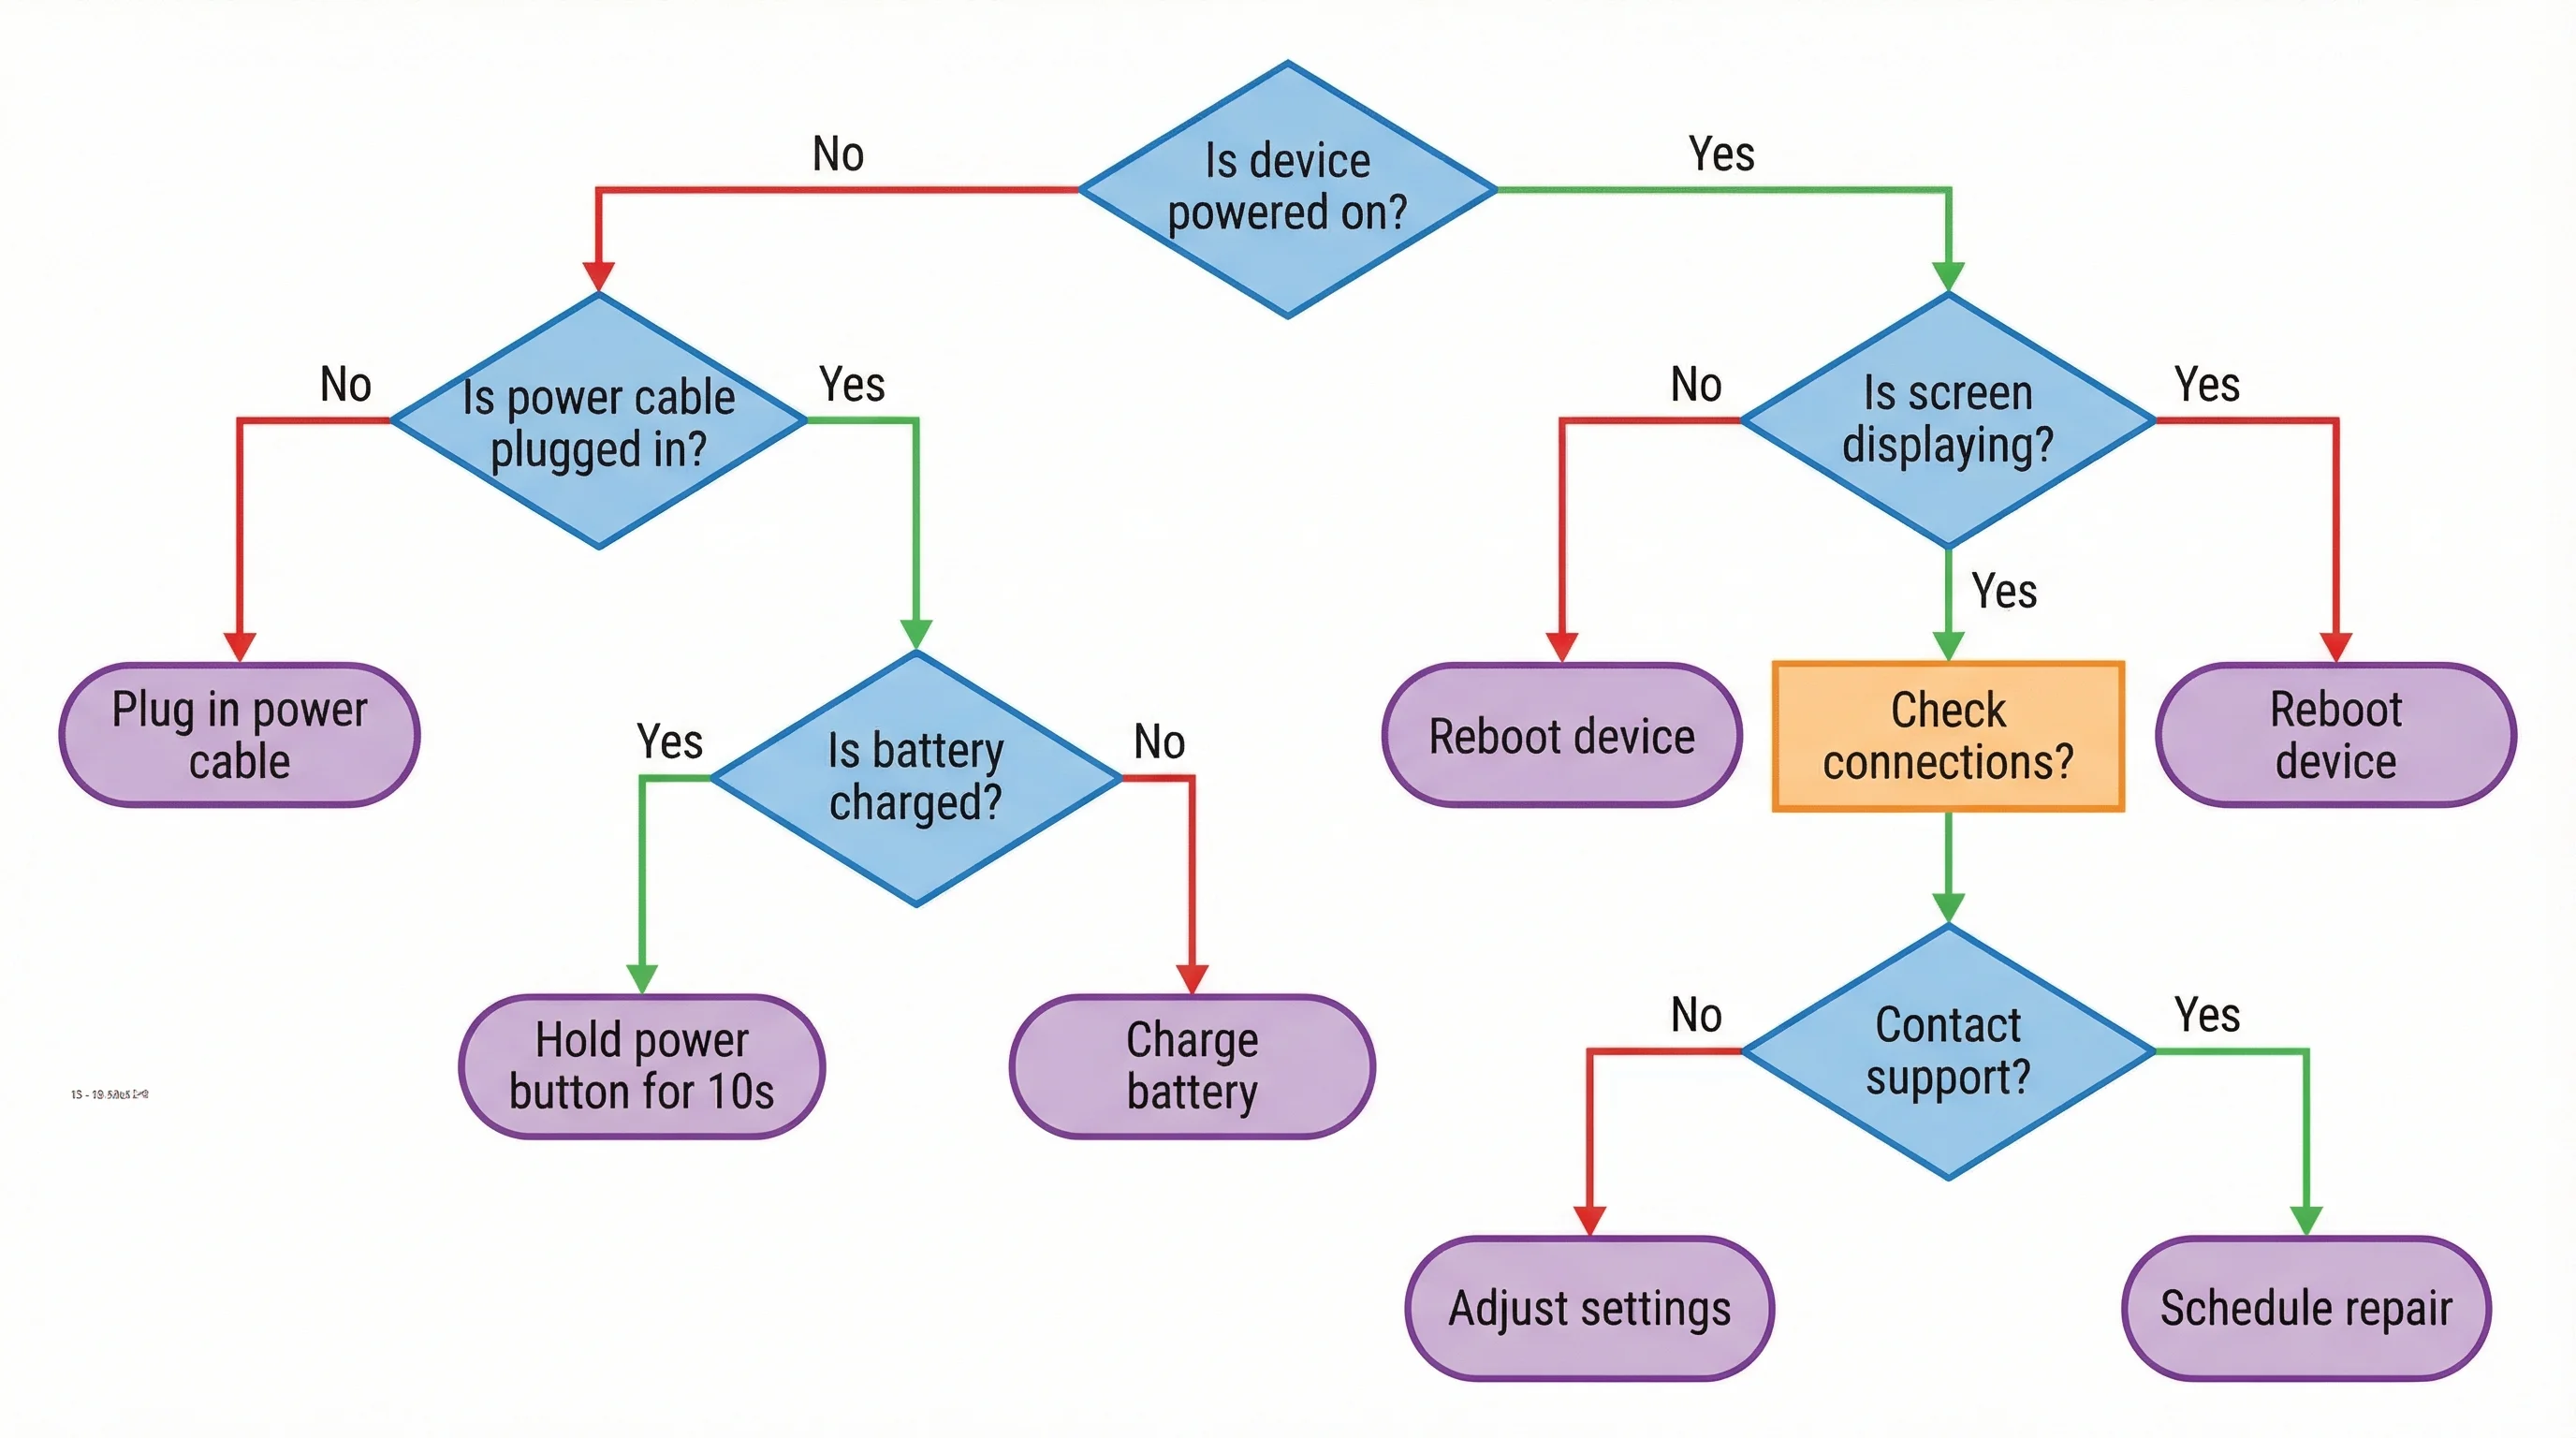
研究方法决策树
根据研究问题、数据类型和研究目标选择适当研究方法的决策树。
概率树状图
概率树图,展示统计实验多个阶段的条件概率。
研究实验室组织层级图
大学研究实验室的组织结构图,展示从主要研究员到本科助理的各个职位。
生物体分类
涵盖生命三域及其界的综合生物体分类树。
什么是树状图?
树状图是一种层级可视化图形,从单一根节点出发,向外分支为越来越细化的类别或结果。因其形似树木的分支结构而得名,广泛用于数学、生物学、统计学、计算机科学和组织管理等领域。树状图以清晰的父子结构呈现项目之间的关系,让复杂的层级关系和顺序流程一目了然。
树状图的类型
- 系统发育树:描绘物种之间的进化关系,展示共同祖先和随时间推移的分歧点
- 分类学分类树:将生物体按照从域、界到属、种的层级排列
- 决策树:列出选择及其可能后果,广泛用于研究方法和临床诊断
- 概率树:展示顺序事件的所有可能结果及各分支的相关概率
- 组织架构树:展示机构、实验室或公司内部的汇报结构和职位层级
- 进化枝图:一种特殊的系统发育图,按共享衍生特征对生物体进行分组,不考虑时间尺度
为什么在研究中使用树状图?
树状图在科学研究中不可或缺,因为它能将复杂的层级数据转化为直观的视觉结构。在生物学中,系统发育树是传达进化假说和分类关系的主要工具。在统计学中,概率树帮助研究者计算复合事件概率并可视化实验结果。决策树指导方法选择和临床诊断流程。对于学术论文和演示文稿,树状图提供了一种普遍可理解的格式,评审者和受众能够快速理解。
如何创建有效的树状图?
首先确定层级结构的根概念或起点。定义分支逻辑:是基于分类标准、时间分歧、条件结果还是组织角色?保持树的每个层级在粒度上保持一致。为每个节点和分支使用清晰简洁的标签。应用色彩编码区分分支或层级,提高可读性。保持均衡的间距,避免图表一侧过于拥挤。我们的AI工具会自动处理所有这些设计原则,根据简单的文字描述生成发布级别的树状图。
在生物学、统计学和教育中的应用
- 进化生物学:构建系统发育树,假设物种关系和祖先谱系
- 分类学:使用从域到种的林奈分类层级对生物体进行系统性分类
- 概率与统计学:计算多阶段实验结果、贝叶斯推理和条件概率
- 临床研究:构建诊断决策树和治疗路径算法
- 教育:教授学生跨STEM学科的分类技能、逻辑推理和过程分解
- 计算机科学:表示数据结构、文件系统和解析算法