甘特图在线制作 甘特图
立即生成专业甘特图。描述你的项目或上传任务数据,获得清晰的时间线,随时可用于汇报演示。
Upload your task list (CSV with task, start date, duration) — generates precise Gantt charts
Gantt Chart Maker
By using ConceptViz, you agree not to generate or edit adult, sexual, explicit, unsafe, or policy-violating content. See Content Policy.
免费试用 ·
Your Gantt chart will appear here
Describe the project timeline you want
Gantt Chart Maker
Paste data, upload a file, or use sample data to continue.
By using ConceptViz, you agree not to generate or edit adult, sexual, explicit, unsafe, or policy-violating content. See Content Policy.
免费试用 ·
Your Gantt chart will appear here
Upload task data to generate a precise Gantt chart
甘特图示例
浏览甘特图示例,或在上方生成你自己的甘特图
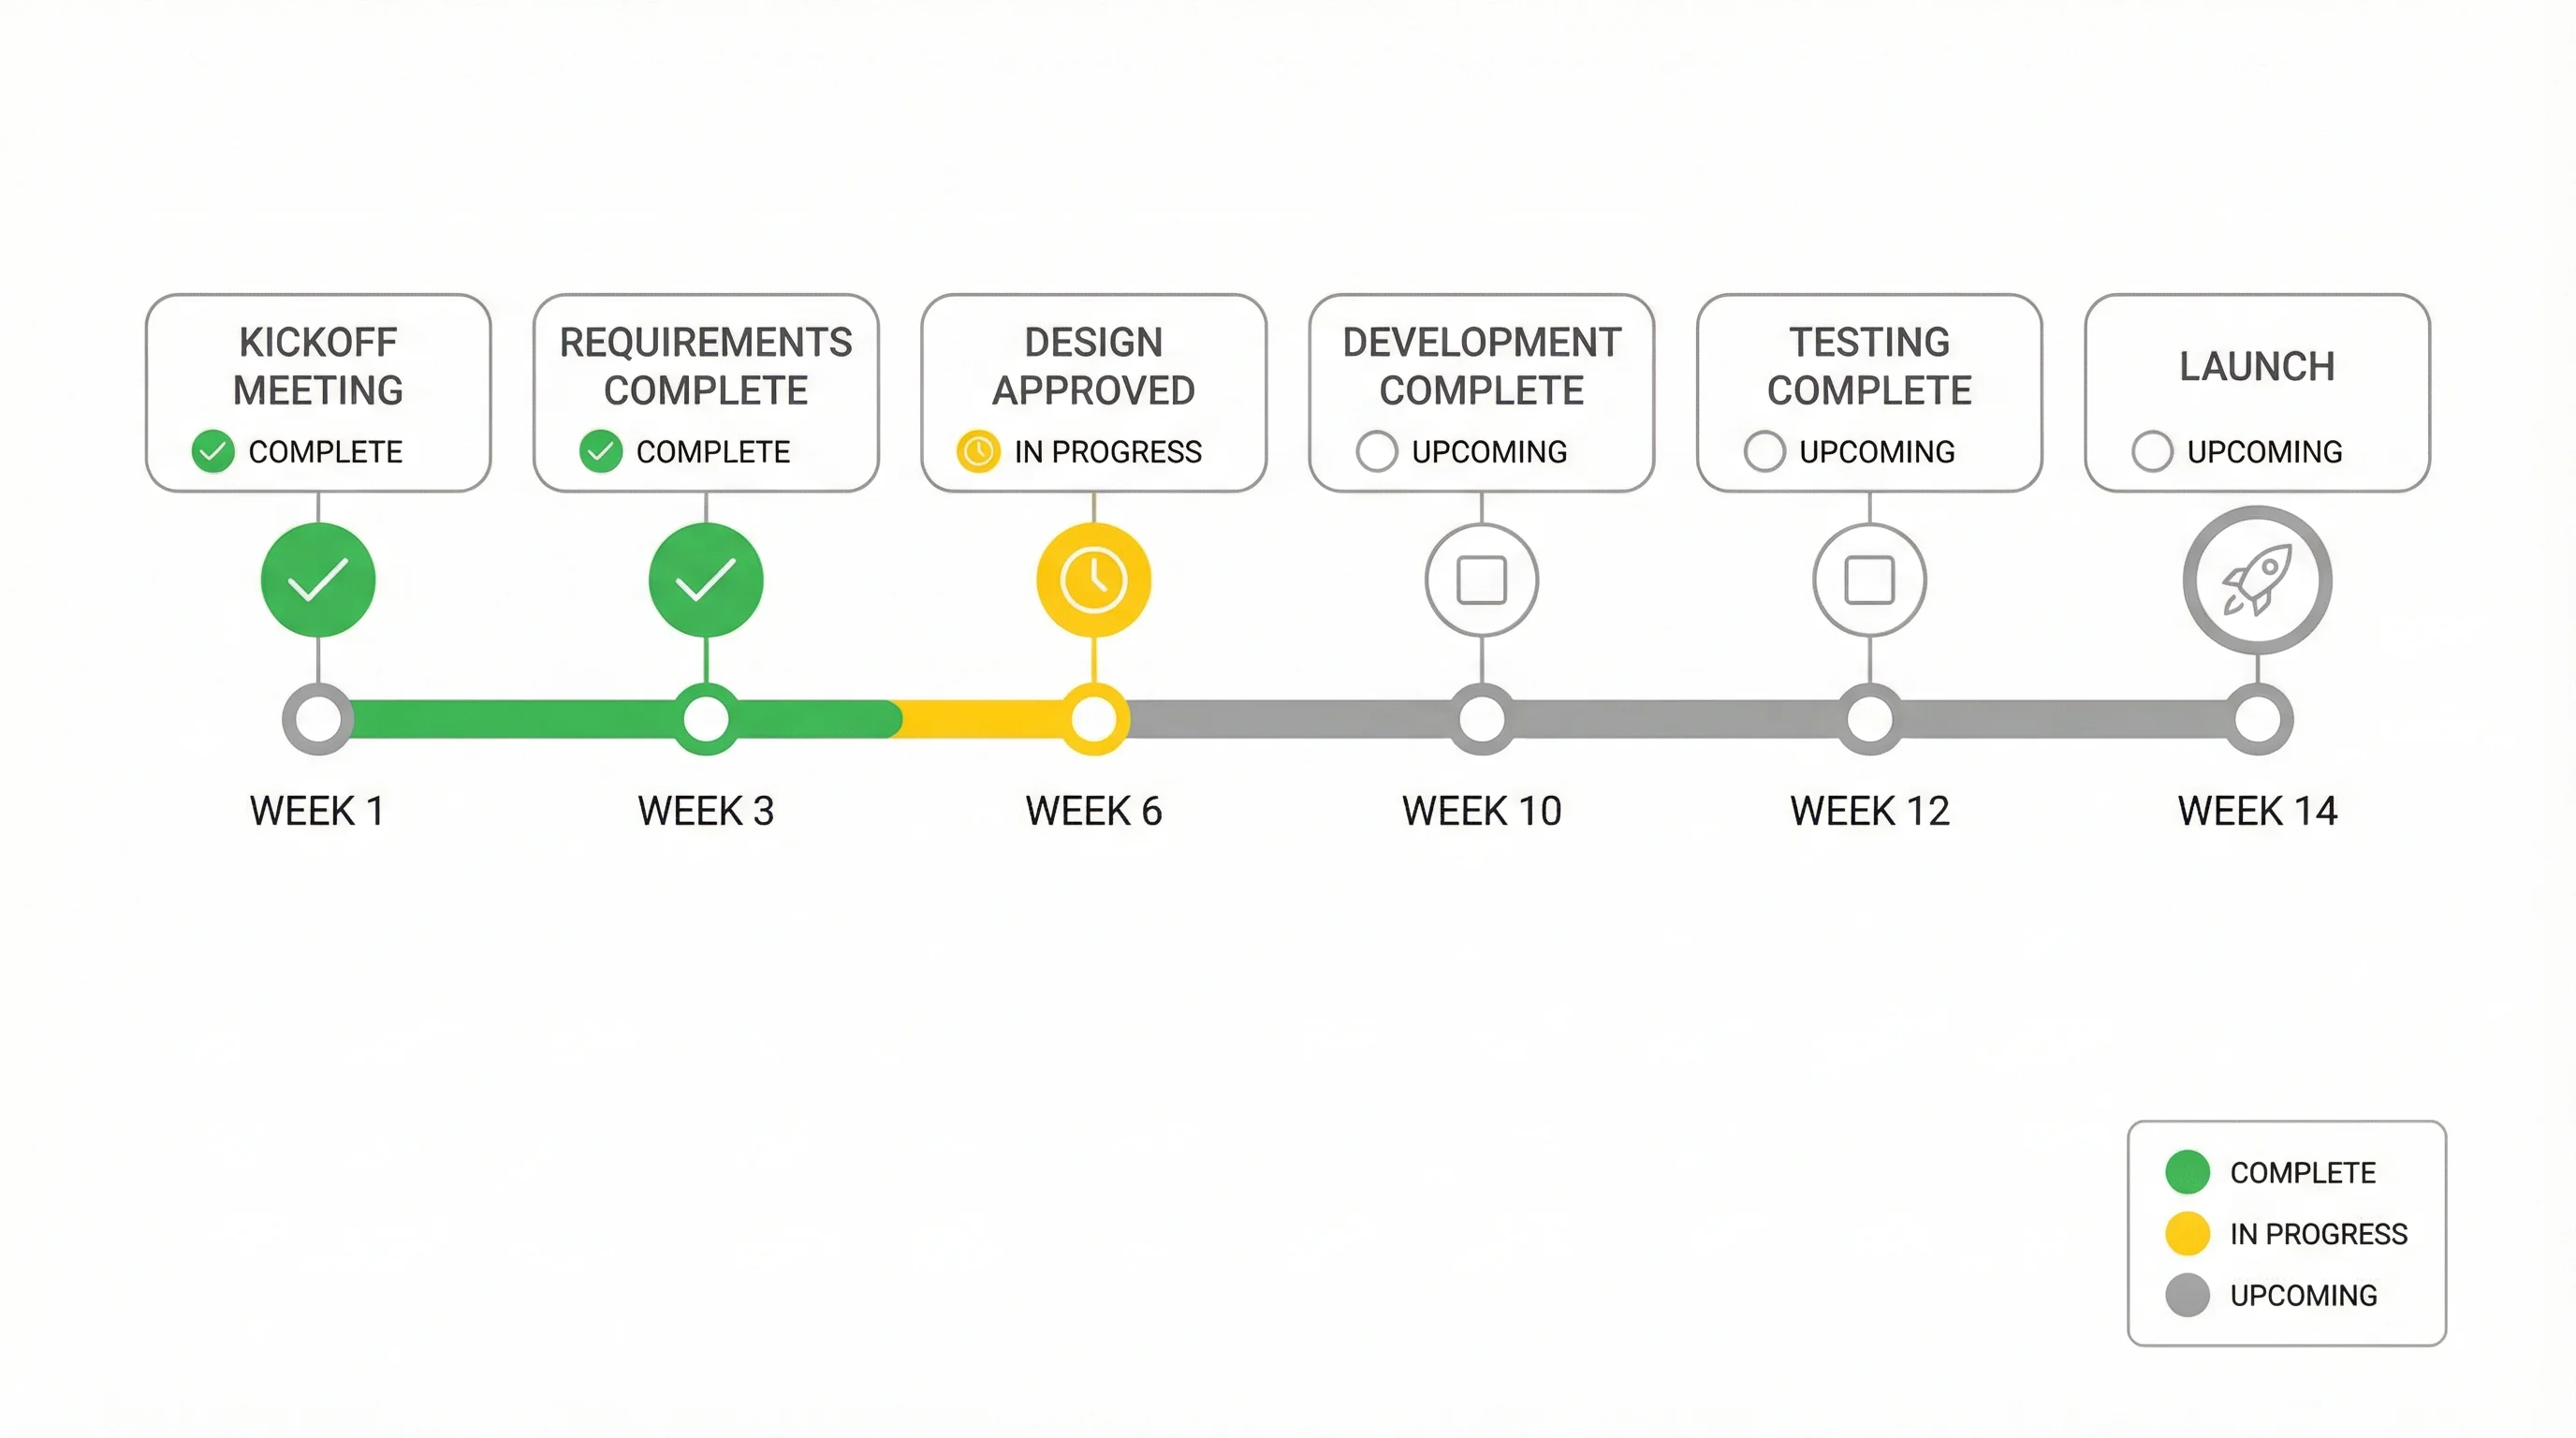
项目里程碑时间线
清晰的项目里程碑甘特图,带阶段分组和里程碑标记。
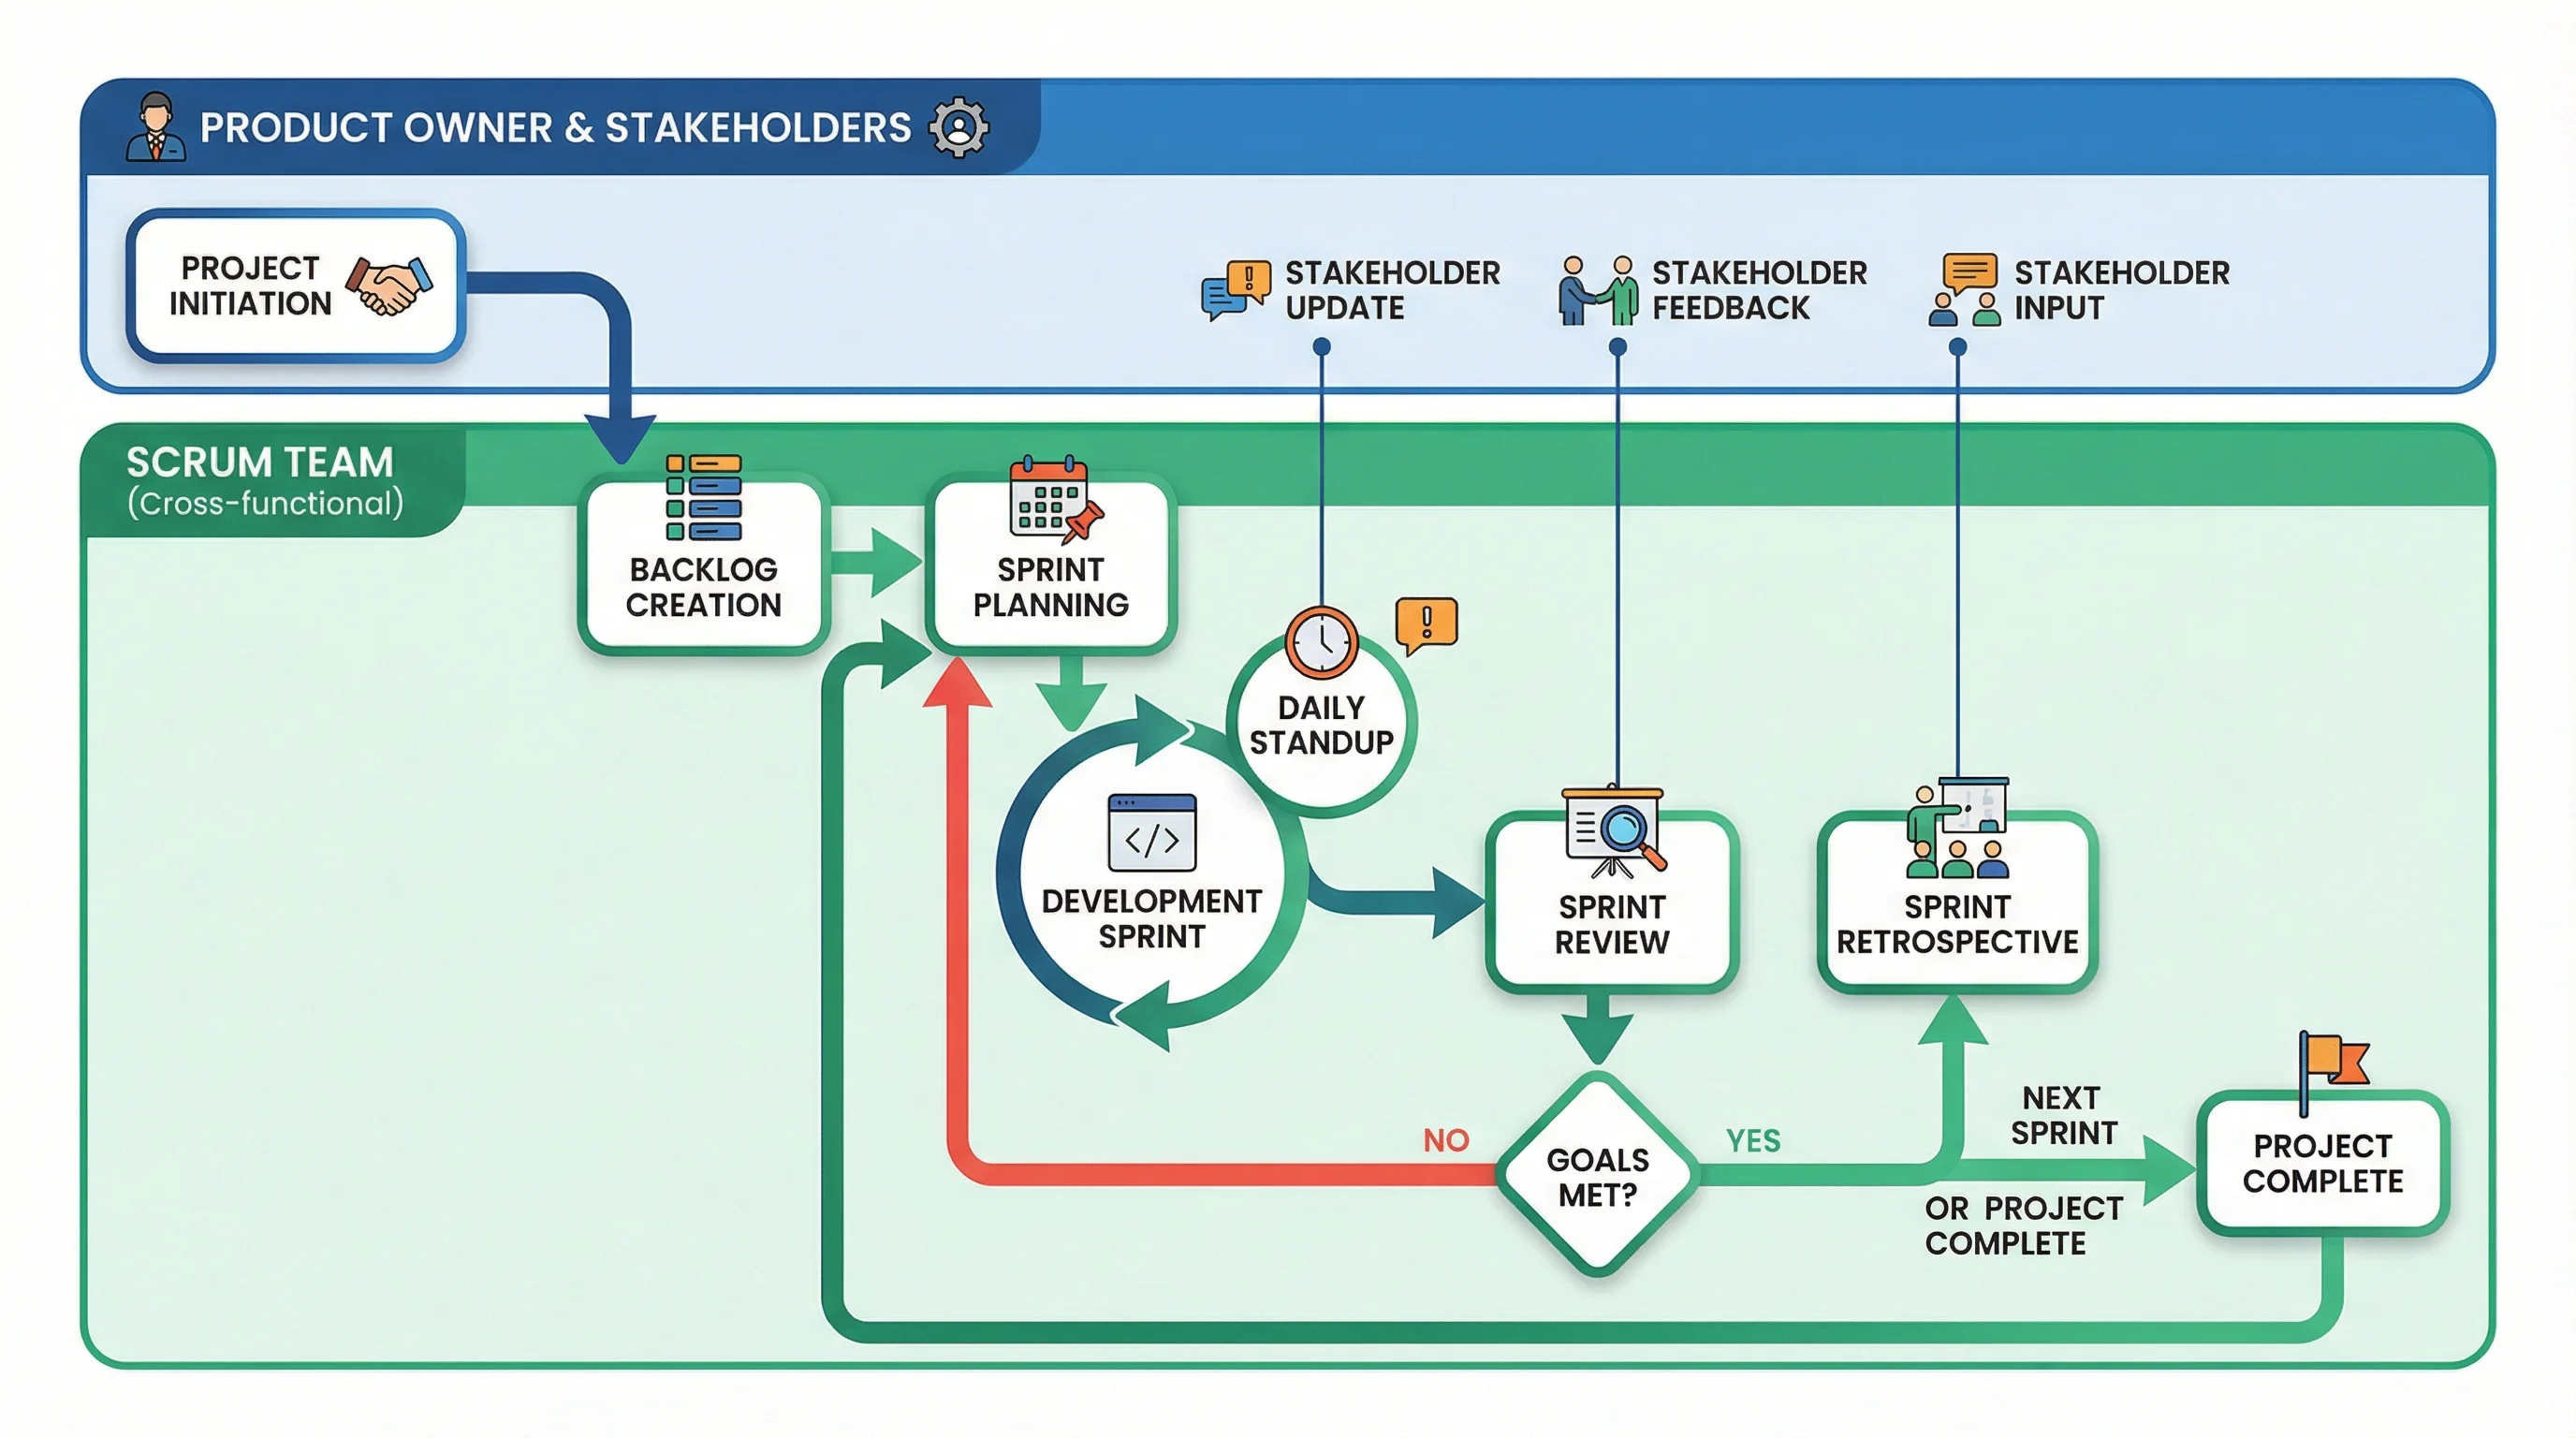
产品路线图
基于Sprint任务组织的产品路线图甘特图。
研究进度计划
适合课题申报和论文时间线的学术研究甘特图。
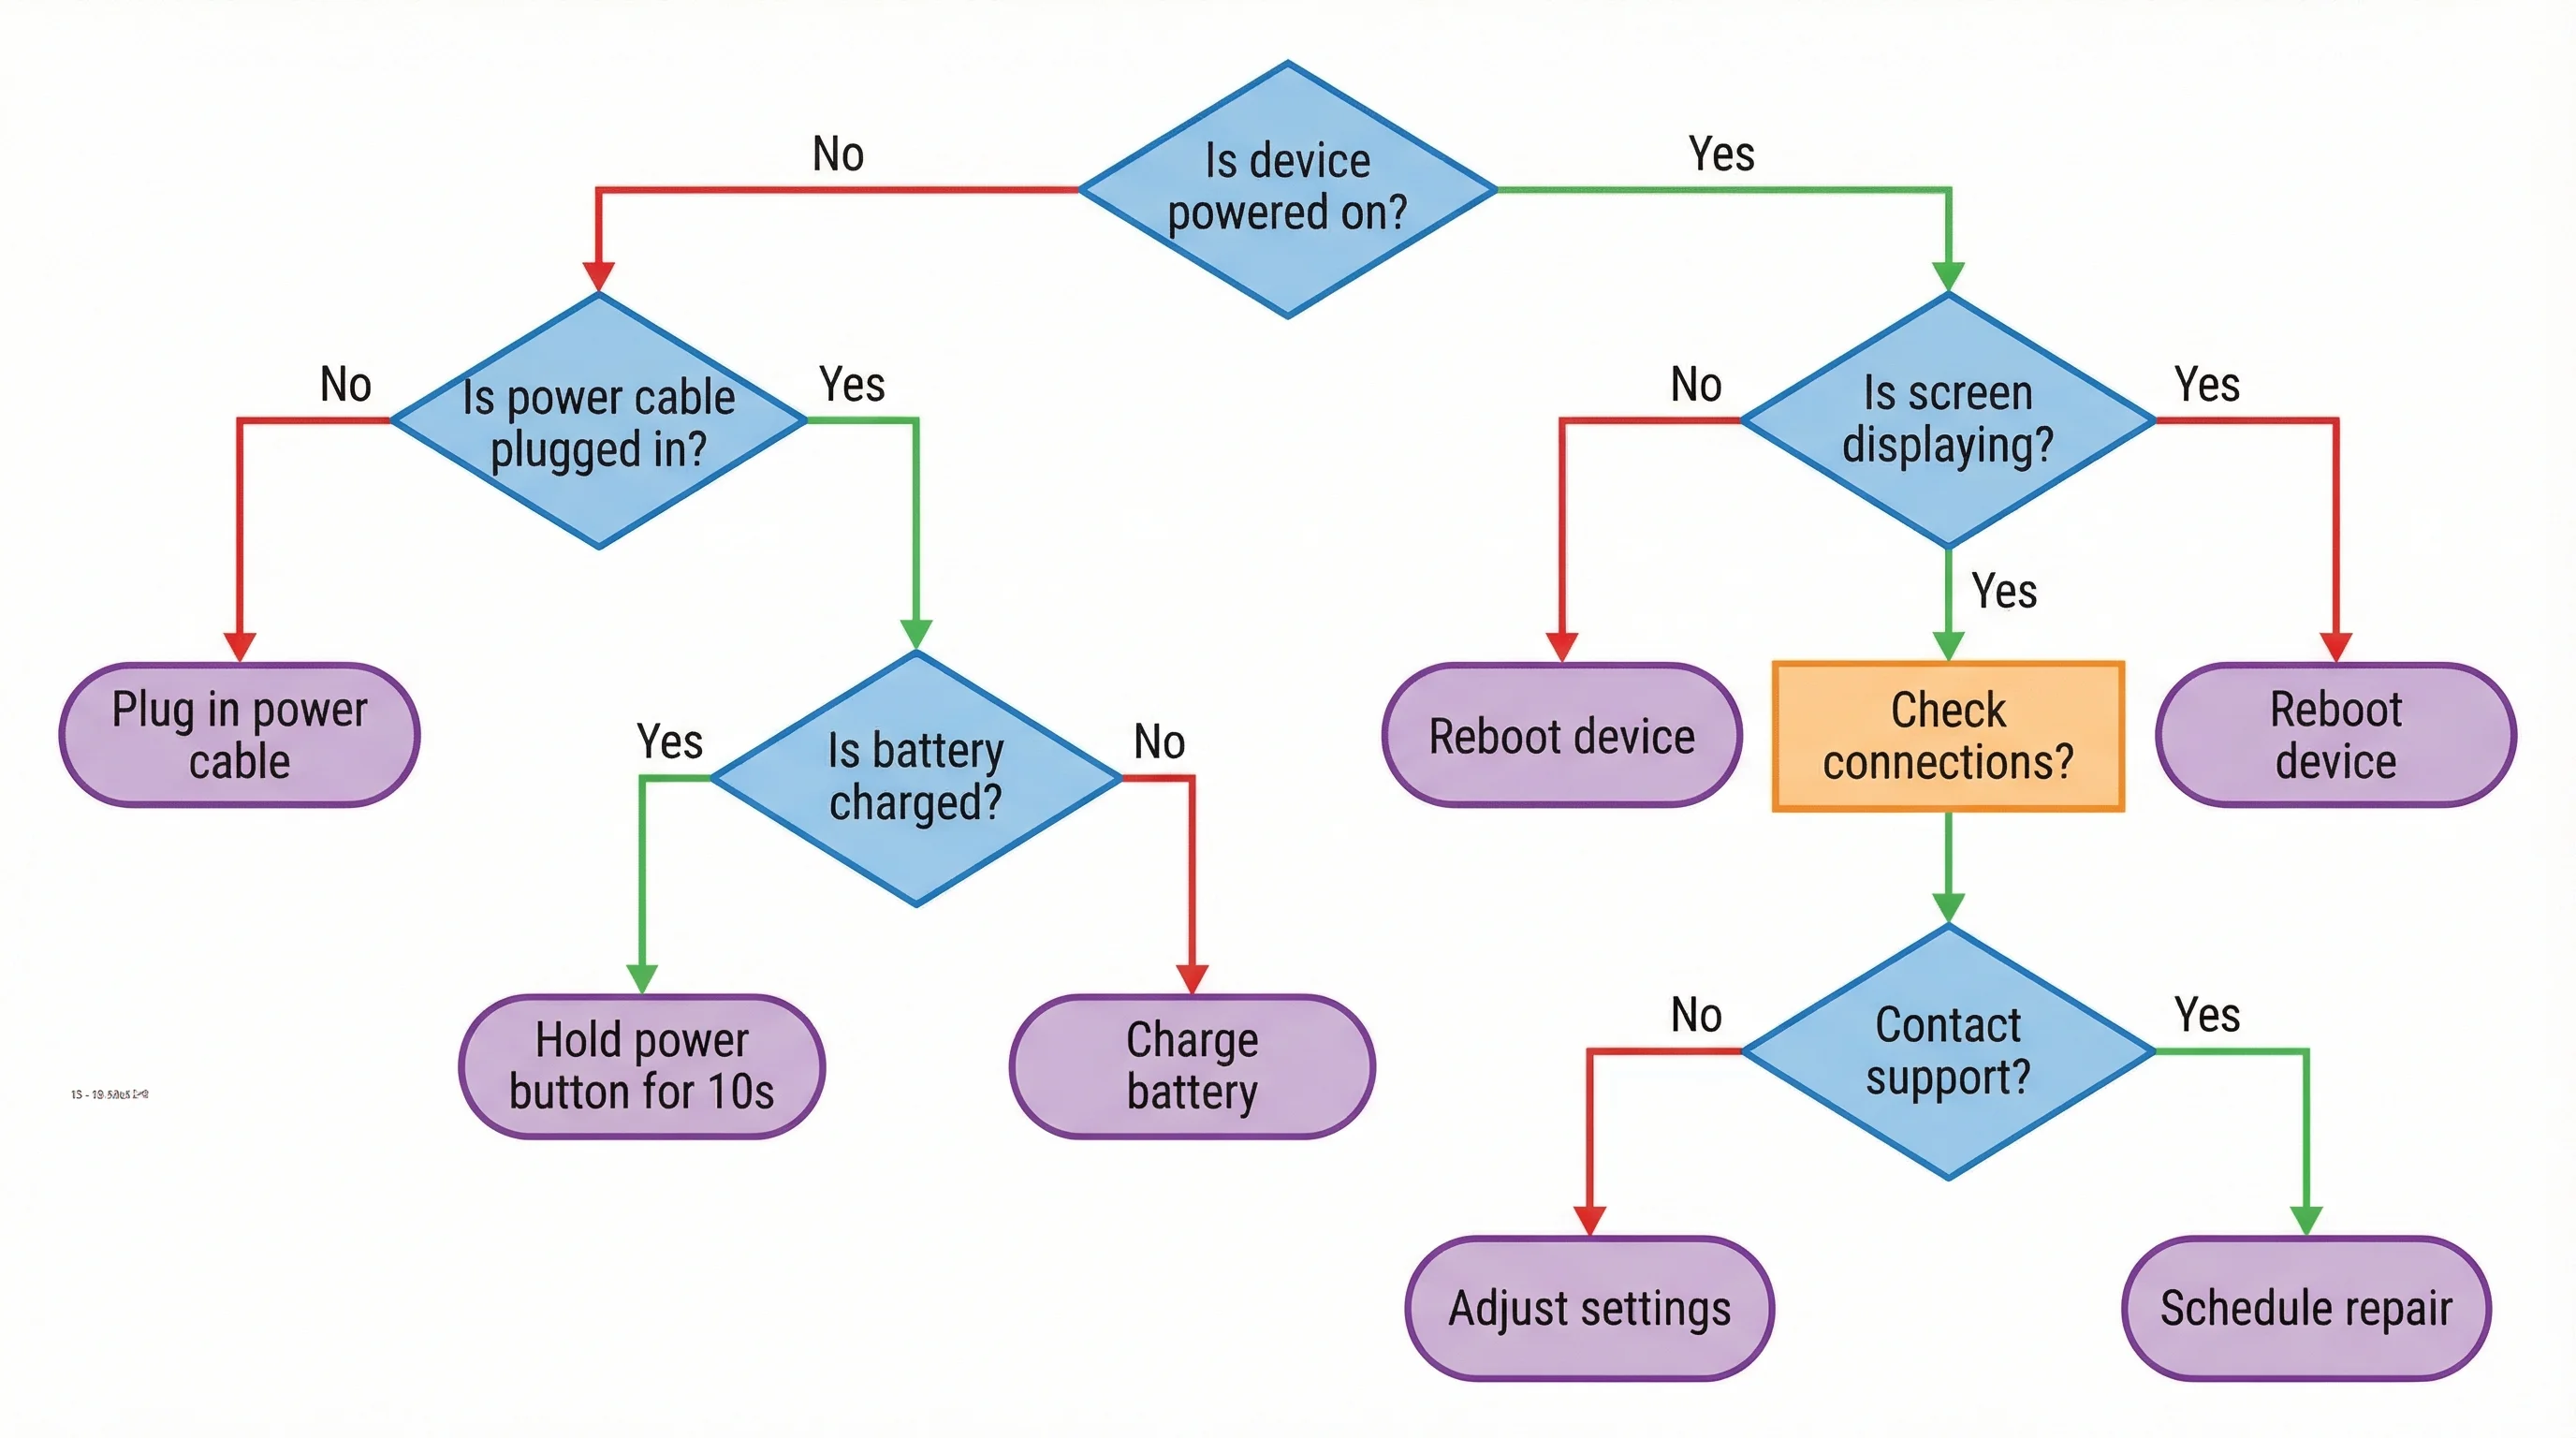
技术迁移计划
带关键路径高亮的IT迁移甘特图。
活动策划时间线
含供应商和物流协调的活动策划甘特图。
内容日历
多内容渠道并行的内容营销甘特图。
什么是甘特图?
甘特图是将任务与时间对应展示的横向条形图。每个条形代表一项任务,其位置和长度分别表示任务的开始时间和持续时长。甘特图是项目排期的标准工具,广泛应用于软件开发、建筑工程、学术研究和活动策划等各个行业。
甘特图的适用场景
- 规划有明确开始日期和持续时长的项目进度
- 向利益相关方和团队成员传达时间线安排
- 跟踪实际进度与计划里程碑的对比
- 识别任务重叠、依赖关系和瓶颈风险
- 为课题申报和论文研究创建研究时间线
- 协调多团队并行工作流的联合发布
甘特图最佳实践
普通任务使用统一颜色,仅对里程碑或工作流使用强调色。将第一个任务置于顶部,按时间顺序从上到下排列。收紧日期轴以消除空白区域。用菱形或对比色条标记关键里程碑。汇报进度时用深色填充条形显示完成情况。避免在同一时段堆叠过多任务。
甘特图 vs 时间线 vs 路线图
甘特图专注于精确日期和持续时长的任务级排期。时间线沿日期轴展示关键事件和里程碑,无详细任务条形。路线图以时间段为维度呈现功能或举措的战略视图,无需精确日期。需要排期精度时使用甘特图,里程碑沟通时使用时间线,战略规划时使用路线图。