Bode Plot Generator from Transfer Function
Generate Bode magnitude and phase plots from numerator and denominator coefficients. Calculate crossover frequencies, gain margin, phase margin, and export SVG, PNG, or CSV.
Transfer function
Coefficients are descending powers of s.
H(s) = 1 · [1] / [1, 1]
Bode Plot Examples
Explore common transfer-function responses for filters and control systems
First-Order Low-Pass Filter
Magnitude rolls off after the corner frequency and phase approaches -90 degrees.
Second-Order Control System
A typical second-order response for control-system homework and stability checks.
First-Order High-Pass Filter
A high-pass response with rising low-frequency magnitude and phase moving toward zero.
Lead Compensator
A control-design example that changes phase and gain across a target band.
Notch Filter
A frequency-selective example for signal processing and vibration analysis.
Integrator Response
An integrator response with -20 dB per decade slope and -90 degree phase.
What is a Bode plot generator?
A Bode plot generator evaluates a transfer function across a logarithmic frequency range and draws two frequency-response plots: magnitude in decibels and phase in degrees. Engineers and students use these plots to inspect filters, amplifiers, control loops, compensators, and signal-processing systems.
What can you enter?
- Numerator coefficients in descending powers of s, such as 1, 2 for s + 2.
- Denominator coefficients in descending powers of s, such as 1, 1.4, 1 for s^2 + 1.4s + 1.
- Overall gain K, frequency range, frequency units, and sample count.
- Presets for common systems including low-pass, high-pass, integrator, lead compensator, and notch filter.
How the calculator works
The tool evaluates H(jω) = K · N(jω) / D(jω) at logarithmically spaced frequencies. Magnitude is calculated as 20 log10 |H(jω)| and phase is calculated from the complex angle, then unwrapped so the phase curve is easier to read. Crossover frequencies and margins are estimated from curve crossings.
When should you use it?
- Use it for quick control-system checks before moving to MATLAB, Python, or lab measurement tools.
- Use it to understand how poles, zeros, damping, and gain change magnitude and phase.
- Use it for teaching examples, homework verification, filter prototyping, and report visuals.
- Use the SVG, PNG, or CSV export when you need the plot in slides, notes, worksheets, or documentation.
Accuracy notes
This calculator is designed for continuous-time rational transfer functions. Margin values are interpolated from sampled frequency points, so they are useful for quick analysis and teaching. For high-stakes engineering decisions, verify final values in your course-approved or project-approved control-system software.
常见问题
Related Engineering Tools
 Engineering
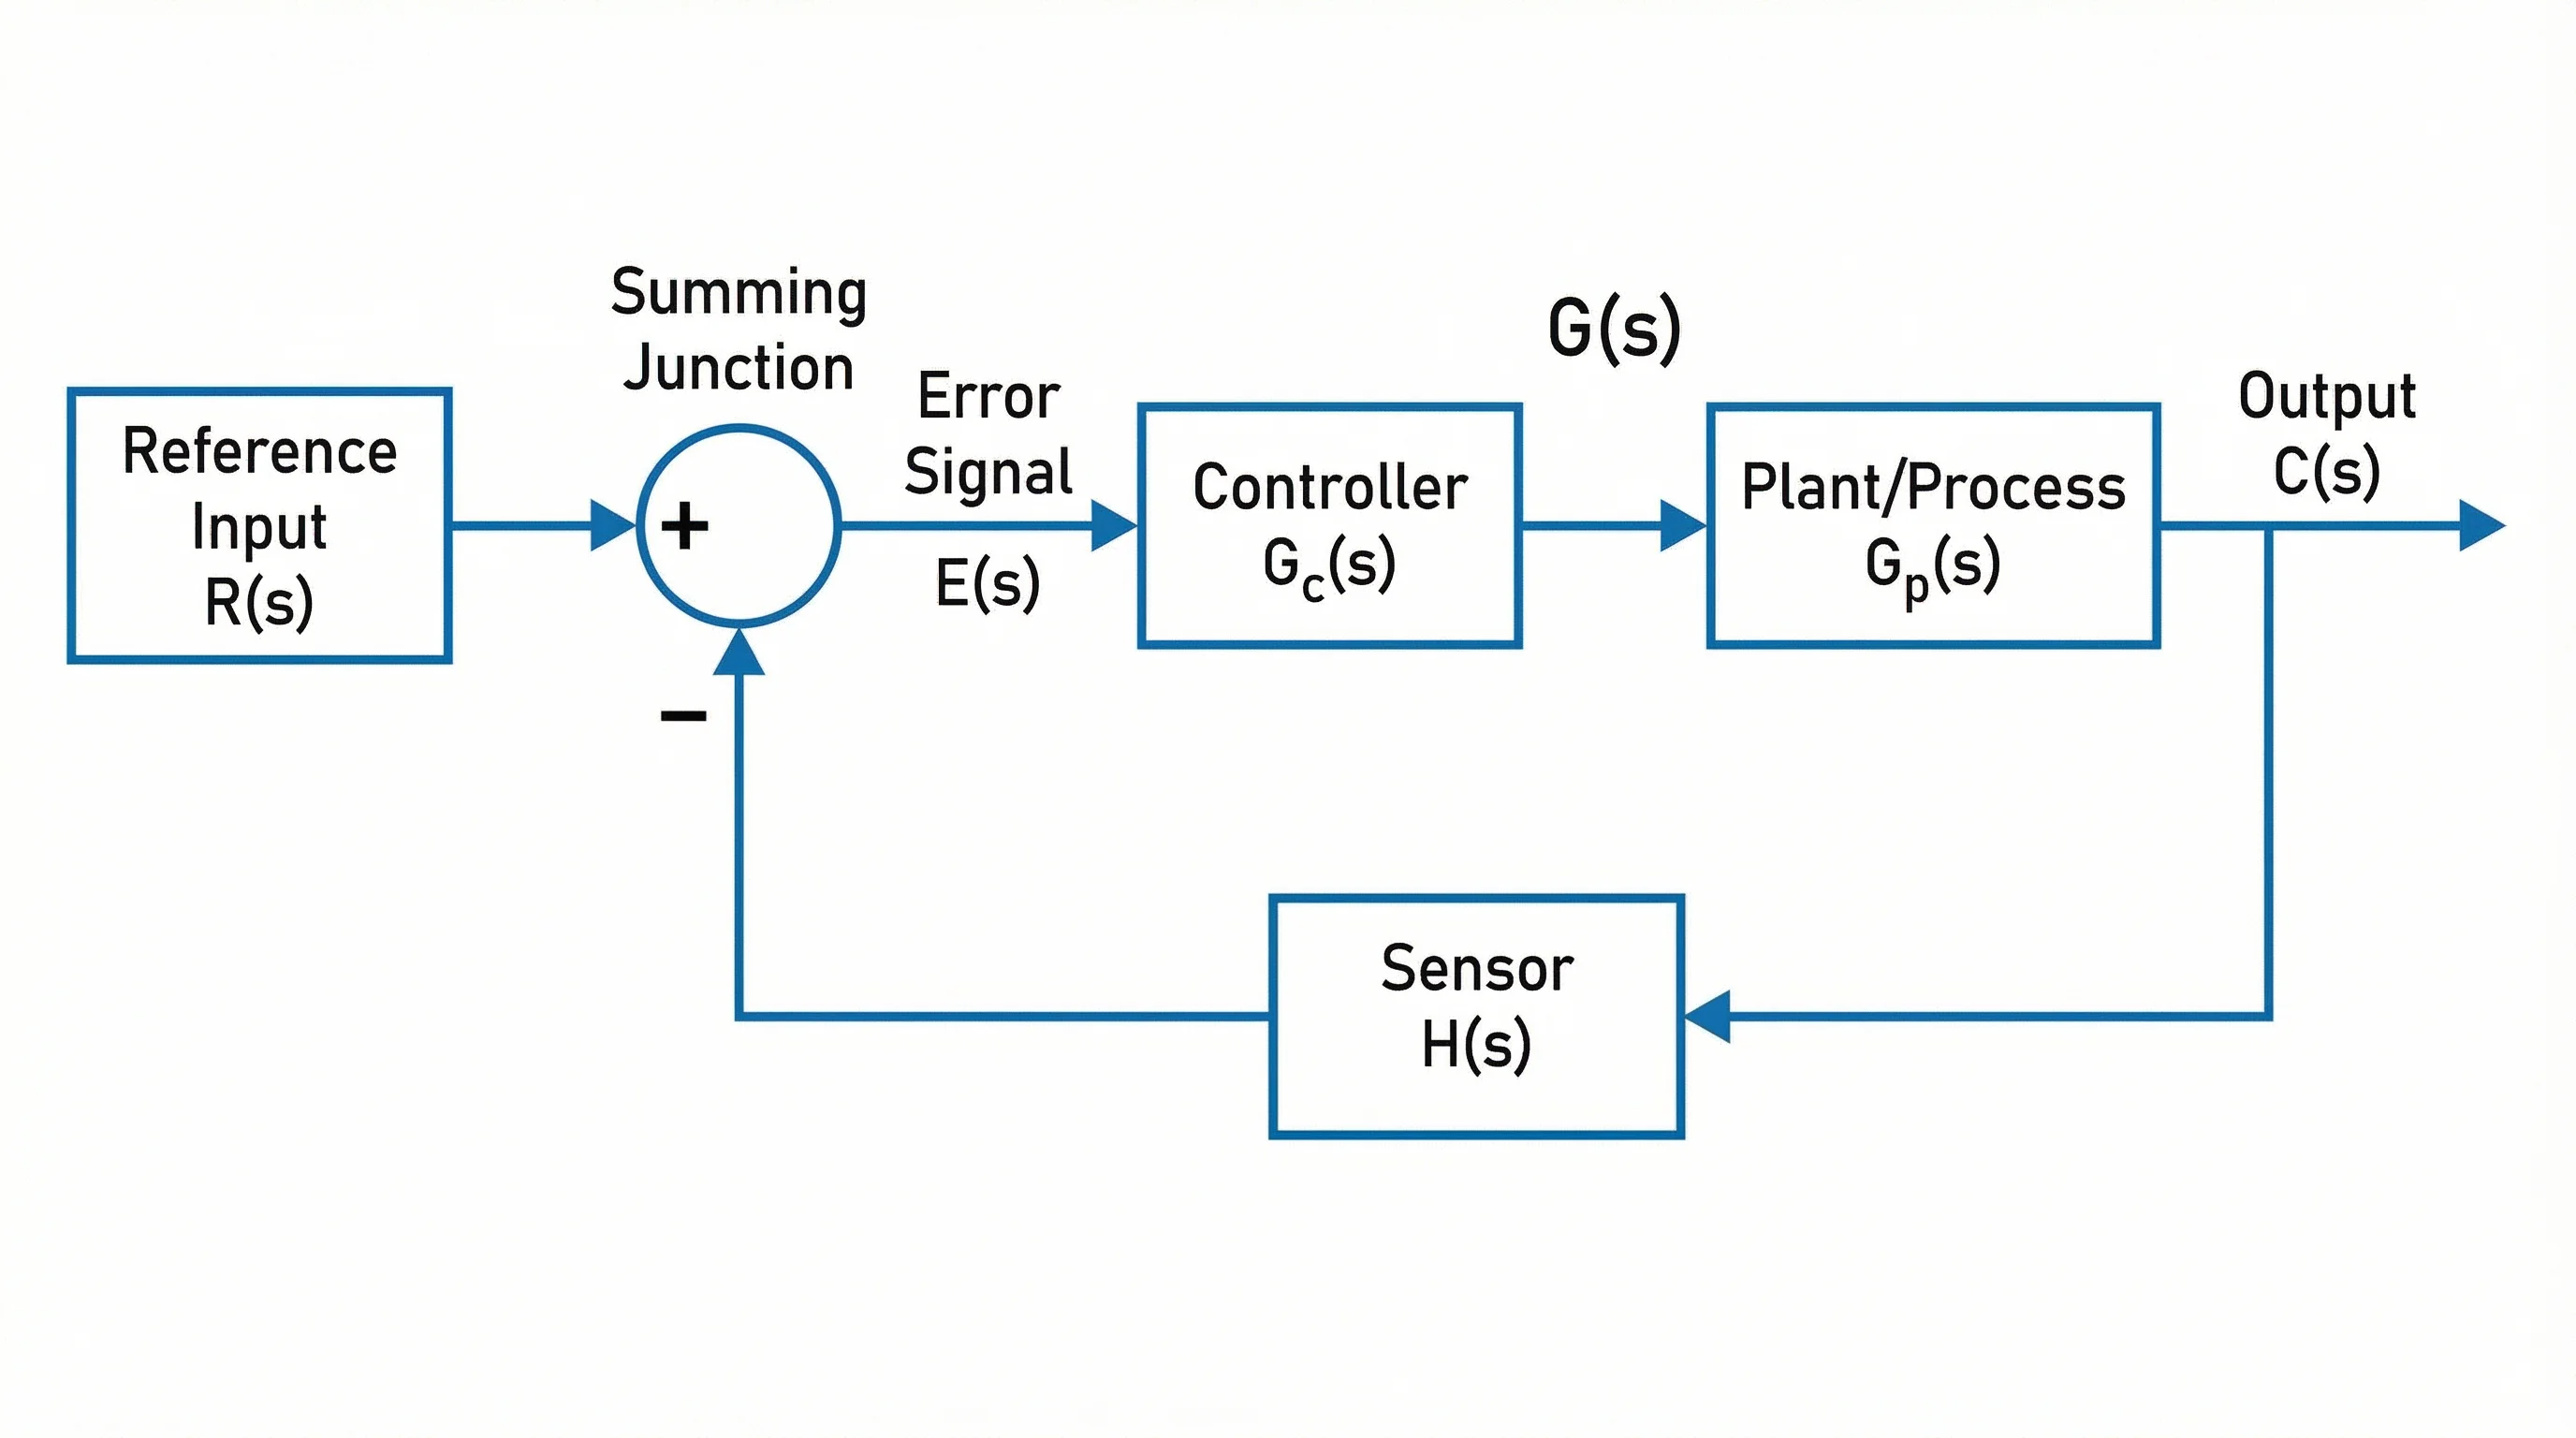
Block Diagram Generator
Create control-system block diagrams, feedback loops, and signal-flow visuals.
 Physics
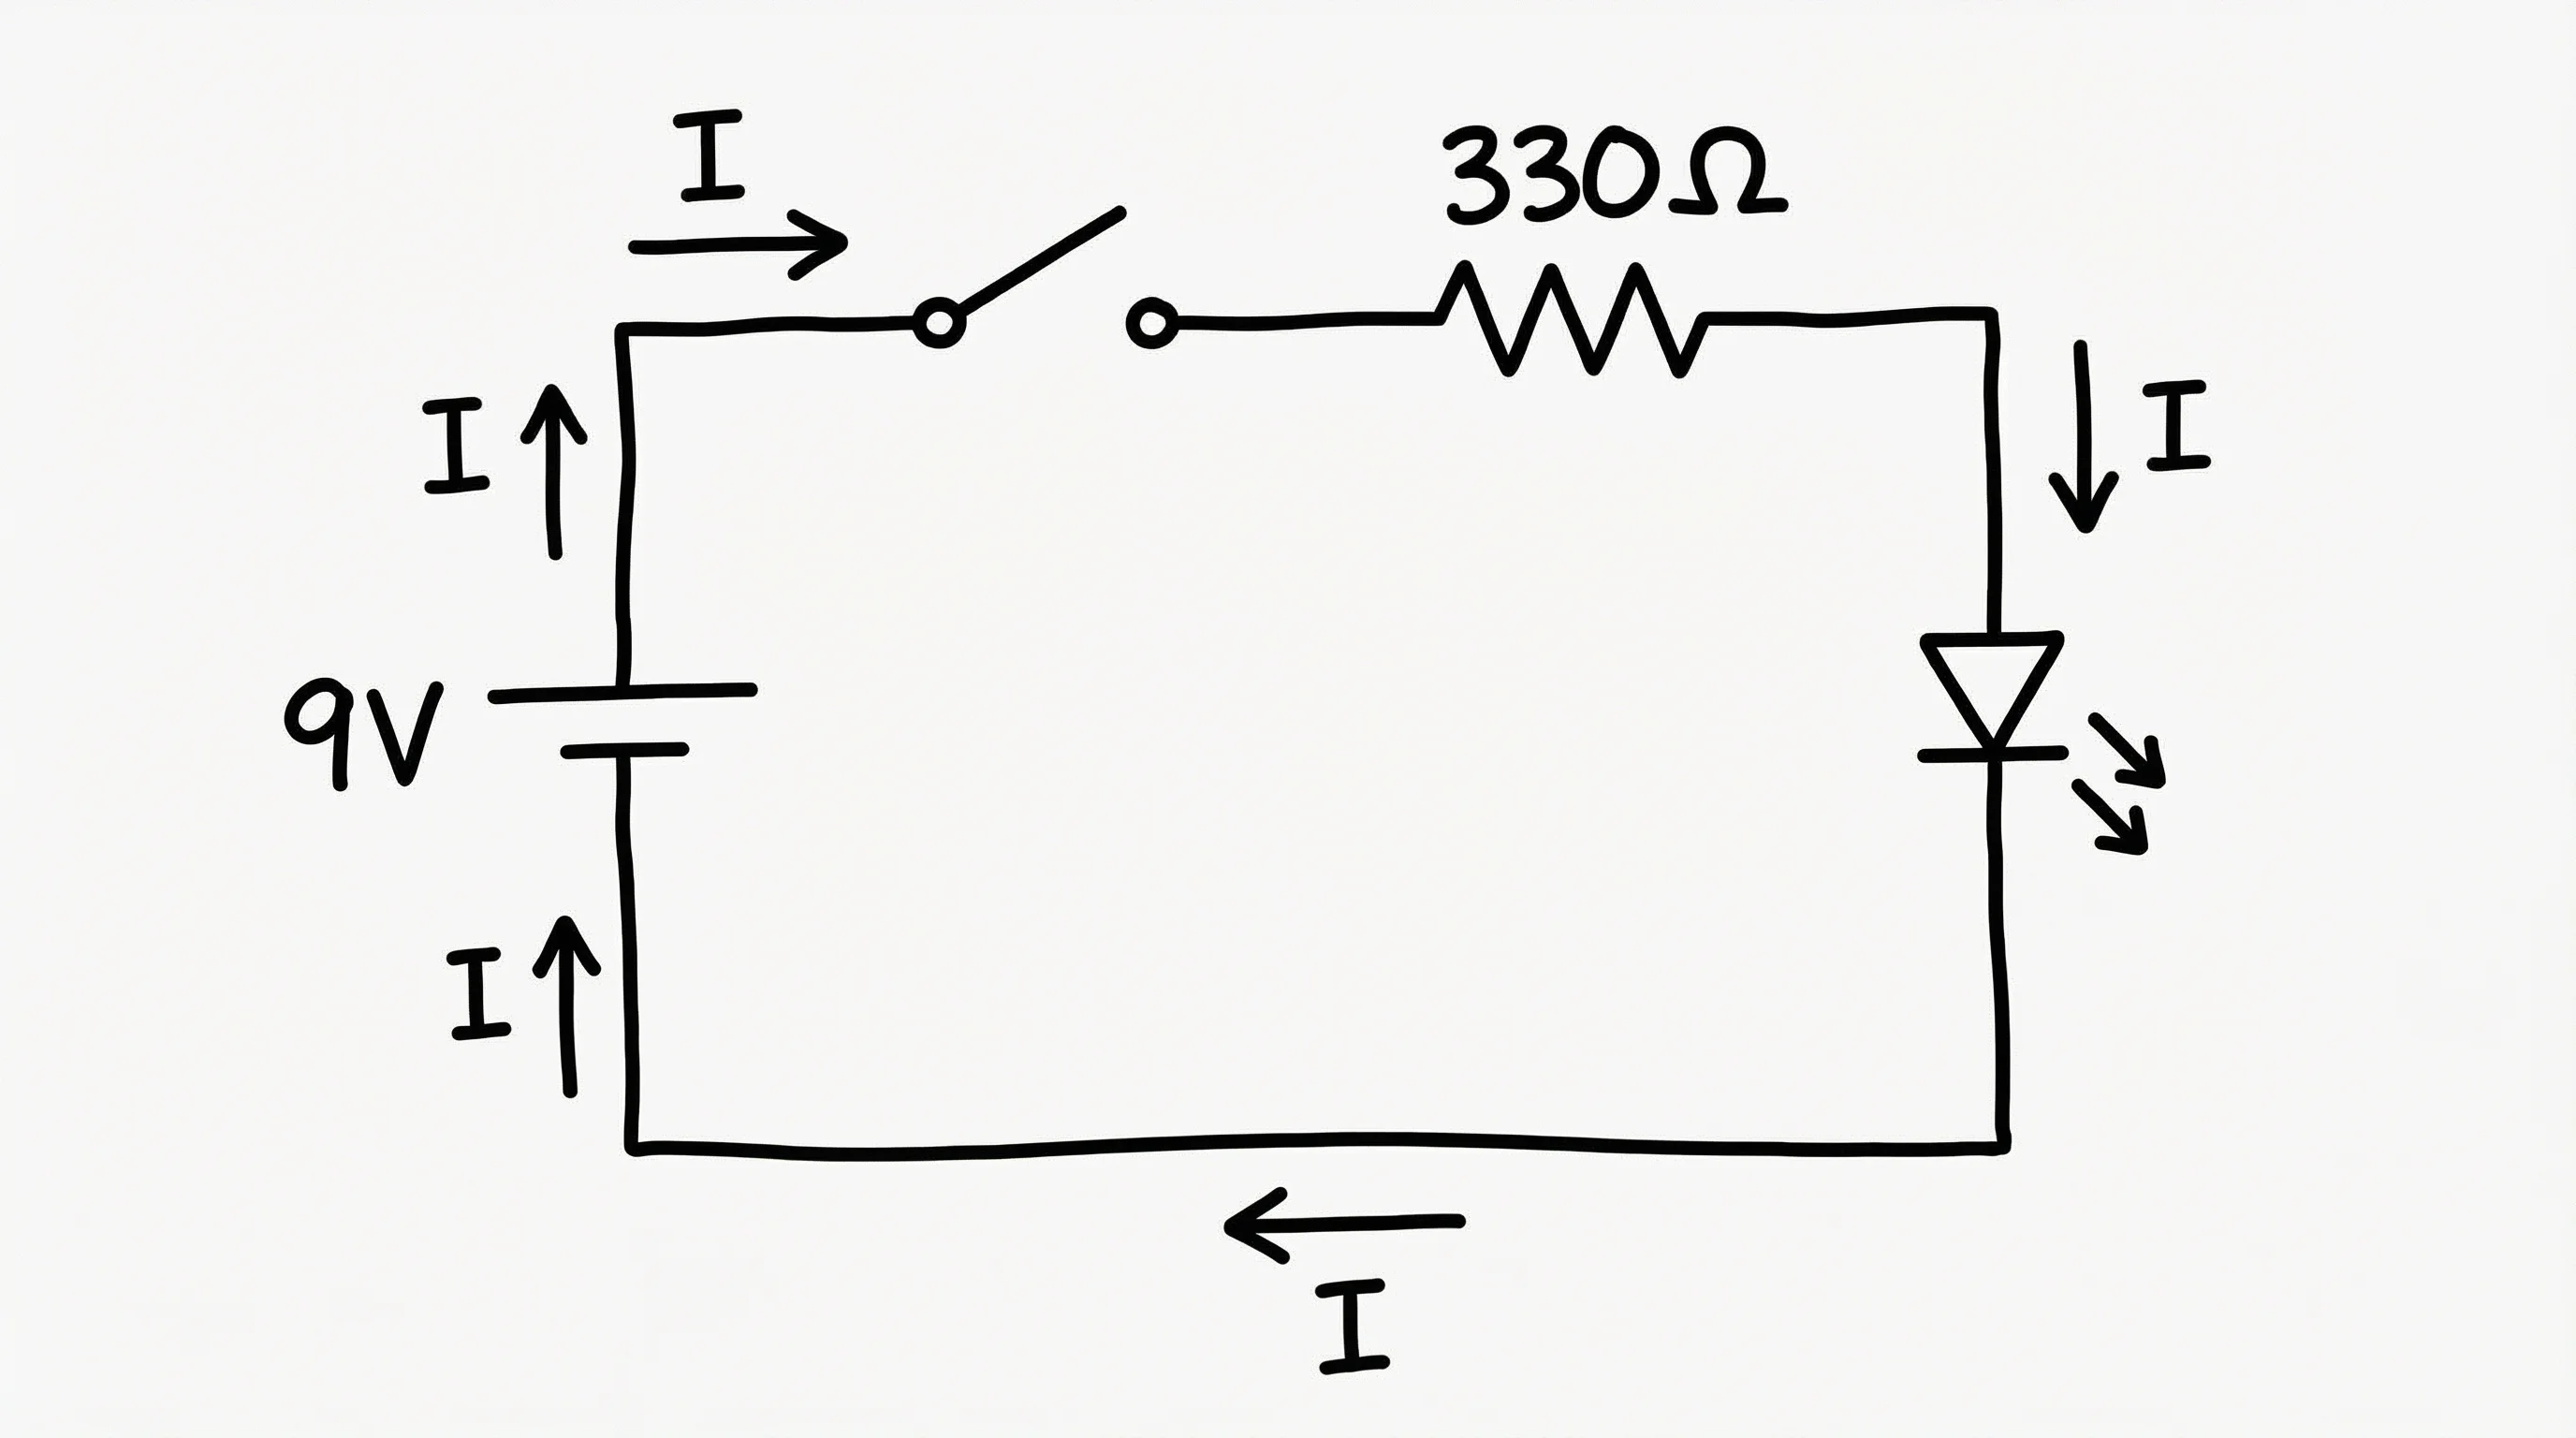
Circuit Diagram Maker
Create circuit diagrams for filters, electronics, and engineering notes.
 Research
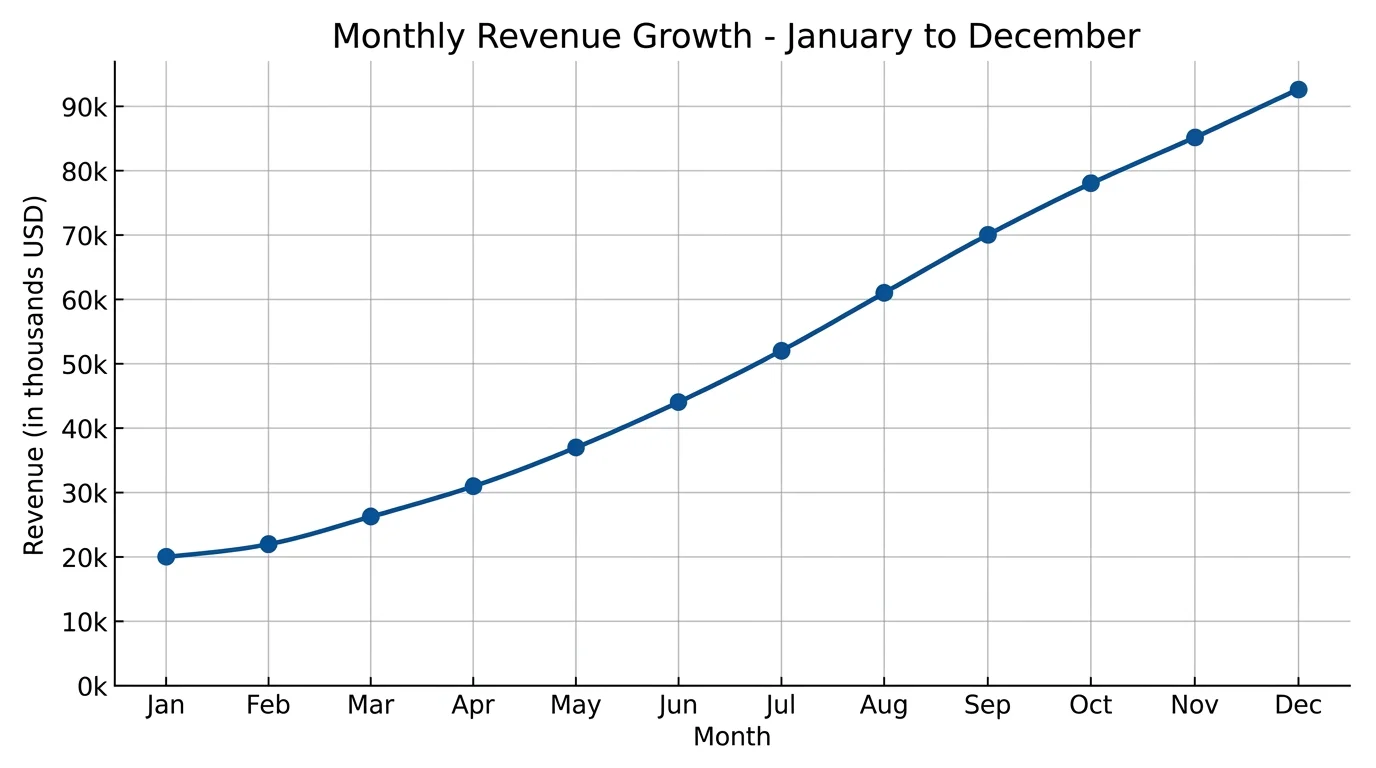
Line Chart Maker
Create line charts and time-series plots from data for reports and presentations.