Block Diagram Maker for Systems & Signal Flow
Make a block diagram online from a plain-English description. Show your system as functional blocks connected by arrows for signal and data flow — control loops, communication systems, signal pipelines, and architecture overviews. Generate, then export, free.
Block Diagram Generator
Free to try ·
Your block diagram will appear here
Describe your system and click Generate
Block Diagram Examples
Control, communication, signal, embedded, and process diagrams
Control System Block Diagram
A closed-loop control system: the summing junction compares reference and feedback to produce an error signal driving the controller.
Signal Processing Pipeline
Each block is one processing stage; arrows trace the signal left to right from input through to output.
Communication System Diagram
A classic transmitter–channel–receiver layout, with the noise source added at the channel between the two chains.
Power Supply Block Diagram
A functional view of a regulated supply — what each stage does, not the detailed circuit inside it.
Embedded System Architecture
A microcontroller at the center, linked to memory, I/O, and interfaces by bidirectional data buses.
Process Overview Diagram
A high-level process overview, with a feedback loop routing rejects back for rework.
What is a block diagram?
A block diagram represents a system as a set of functional blocks connected by lines and arrows that show how signals or data flow between them. Each block stands for one part of the system — a component, a stage, or a subsystem — and is labeled by what it does rather than how it is built inside. The arrows between blocks show the direction of flow, so you can read the whole system at a glance: where the input enters, what happens to it at each step, and where the output leaves. This generator draws exactly that picture from a plain-English description of your system.
Blocks, arrows, and feedback loops
- Blocks: rectangles that each represent a function, stage, or subsystem — a controller, a filter, an amplifier, a service — labeled by what it does.
- Arrows: directed lines that connect the blocks and show which way the signal or data moves from one block to the next.
- Summing junctions: small circles where two or more signals combine, used to compute an error signal (reference minus feedback) in control systems.
- Feedback loops: arrows that route an output back to an earlier block, the defining feature of a closed-loop control system.
- Inputs and outputs: arrows entering and leaving the diagram that mark where the system starts and ends.
Where block diagrams are used
Block diagrams are the standard high-level view across engineering. In control systems they show plants, controllers, sensors, and feedback paths with labeled transfer functions. In communication systems they lay out the transmitter chain, the channel, and the receiver chain. In signal processing they trace a pipeline of stages such as filtering, sampling, and analysis. In electronics and embedded design they show how a microcontroller connects to memory, sensors, and interfaces. And in software and operations they give a process or architecture overview — services, queues, and data stores connected by the flows between them. Anywhere you need to explain a system without drowning in detail, a block diagram is the right tool.
How to make a block diagram from a description
- List the functional blocks of your system — the components or stages, each labeled by what it does.
- Decide the order of flow: which block receives the input, which blocks pass to which, and where the output leaves.
- Note any feedback: outputs that loop back, summing junctions, or quality-control and rework paths.
- Write all of that as a single description and generate — the tool arranges the blocks, connects them with directional arrows, and adds feedback loops where you described them.
Block diagram vs. circuit schematic
A block diagram is a high-level functional view: it shows what each part of the system does and how data or signals move between parts. A circuit schematic is a detailed, component-level drawing that shows every resistor, capacitor, transistor, and wire with exact electrical connections. The two answer different questions. A block diagram of a power supply has one block labeled "Voltage Regulator"; the schematic shows the actual regulator circuit inside it. Reach for a block diagram when you want to communicate structure and flow, and a schematic when you need to build or analyze the actual circuit.
Open-loop and closed-loop systems
In an open-loop system, signals flow straight through from input to output with no feedback — the system does not measure or correct its own result. In a closed-loop system, an output is measured by a sensor and fed back to a summing junction, which compares it to the reference and produces an error signal that the controller acts on. That feedback loop is what lets the system self-correct, and it is one of the clearest things a block diagram can show: the loop is literally drawn as an arrow from the output back to the front of the system.
Frequently Asked Questions
Related Diagram Tools
 Visualization
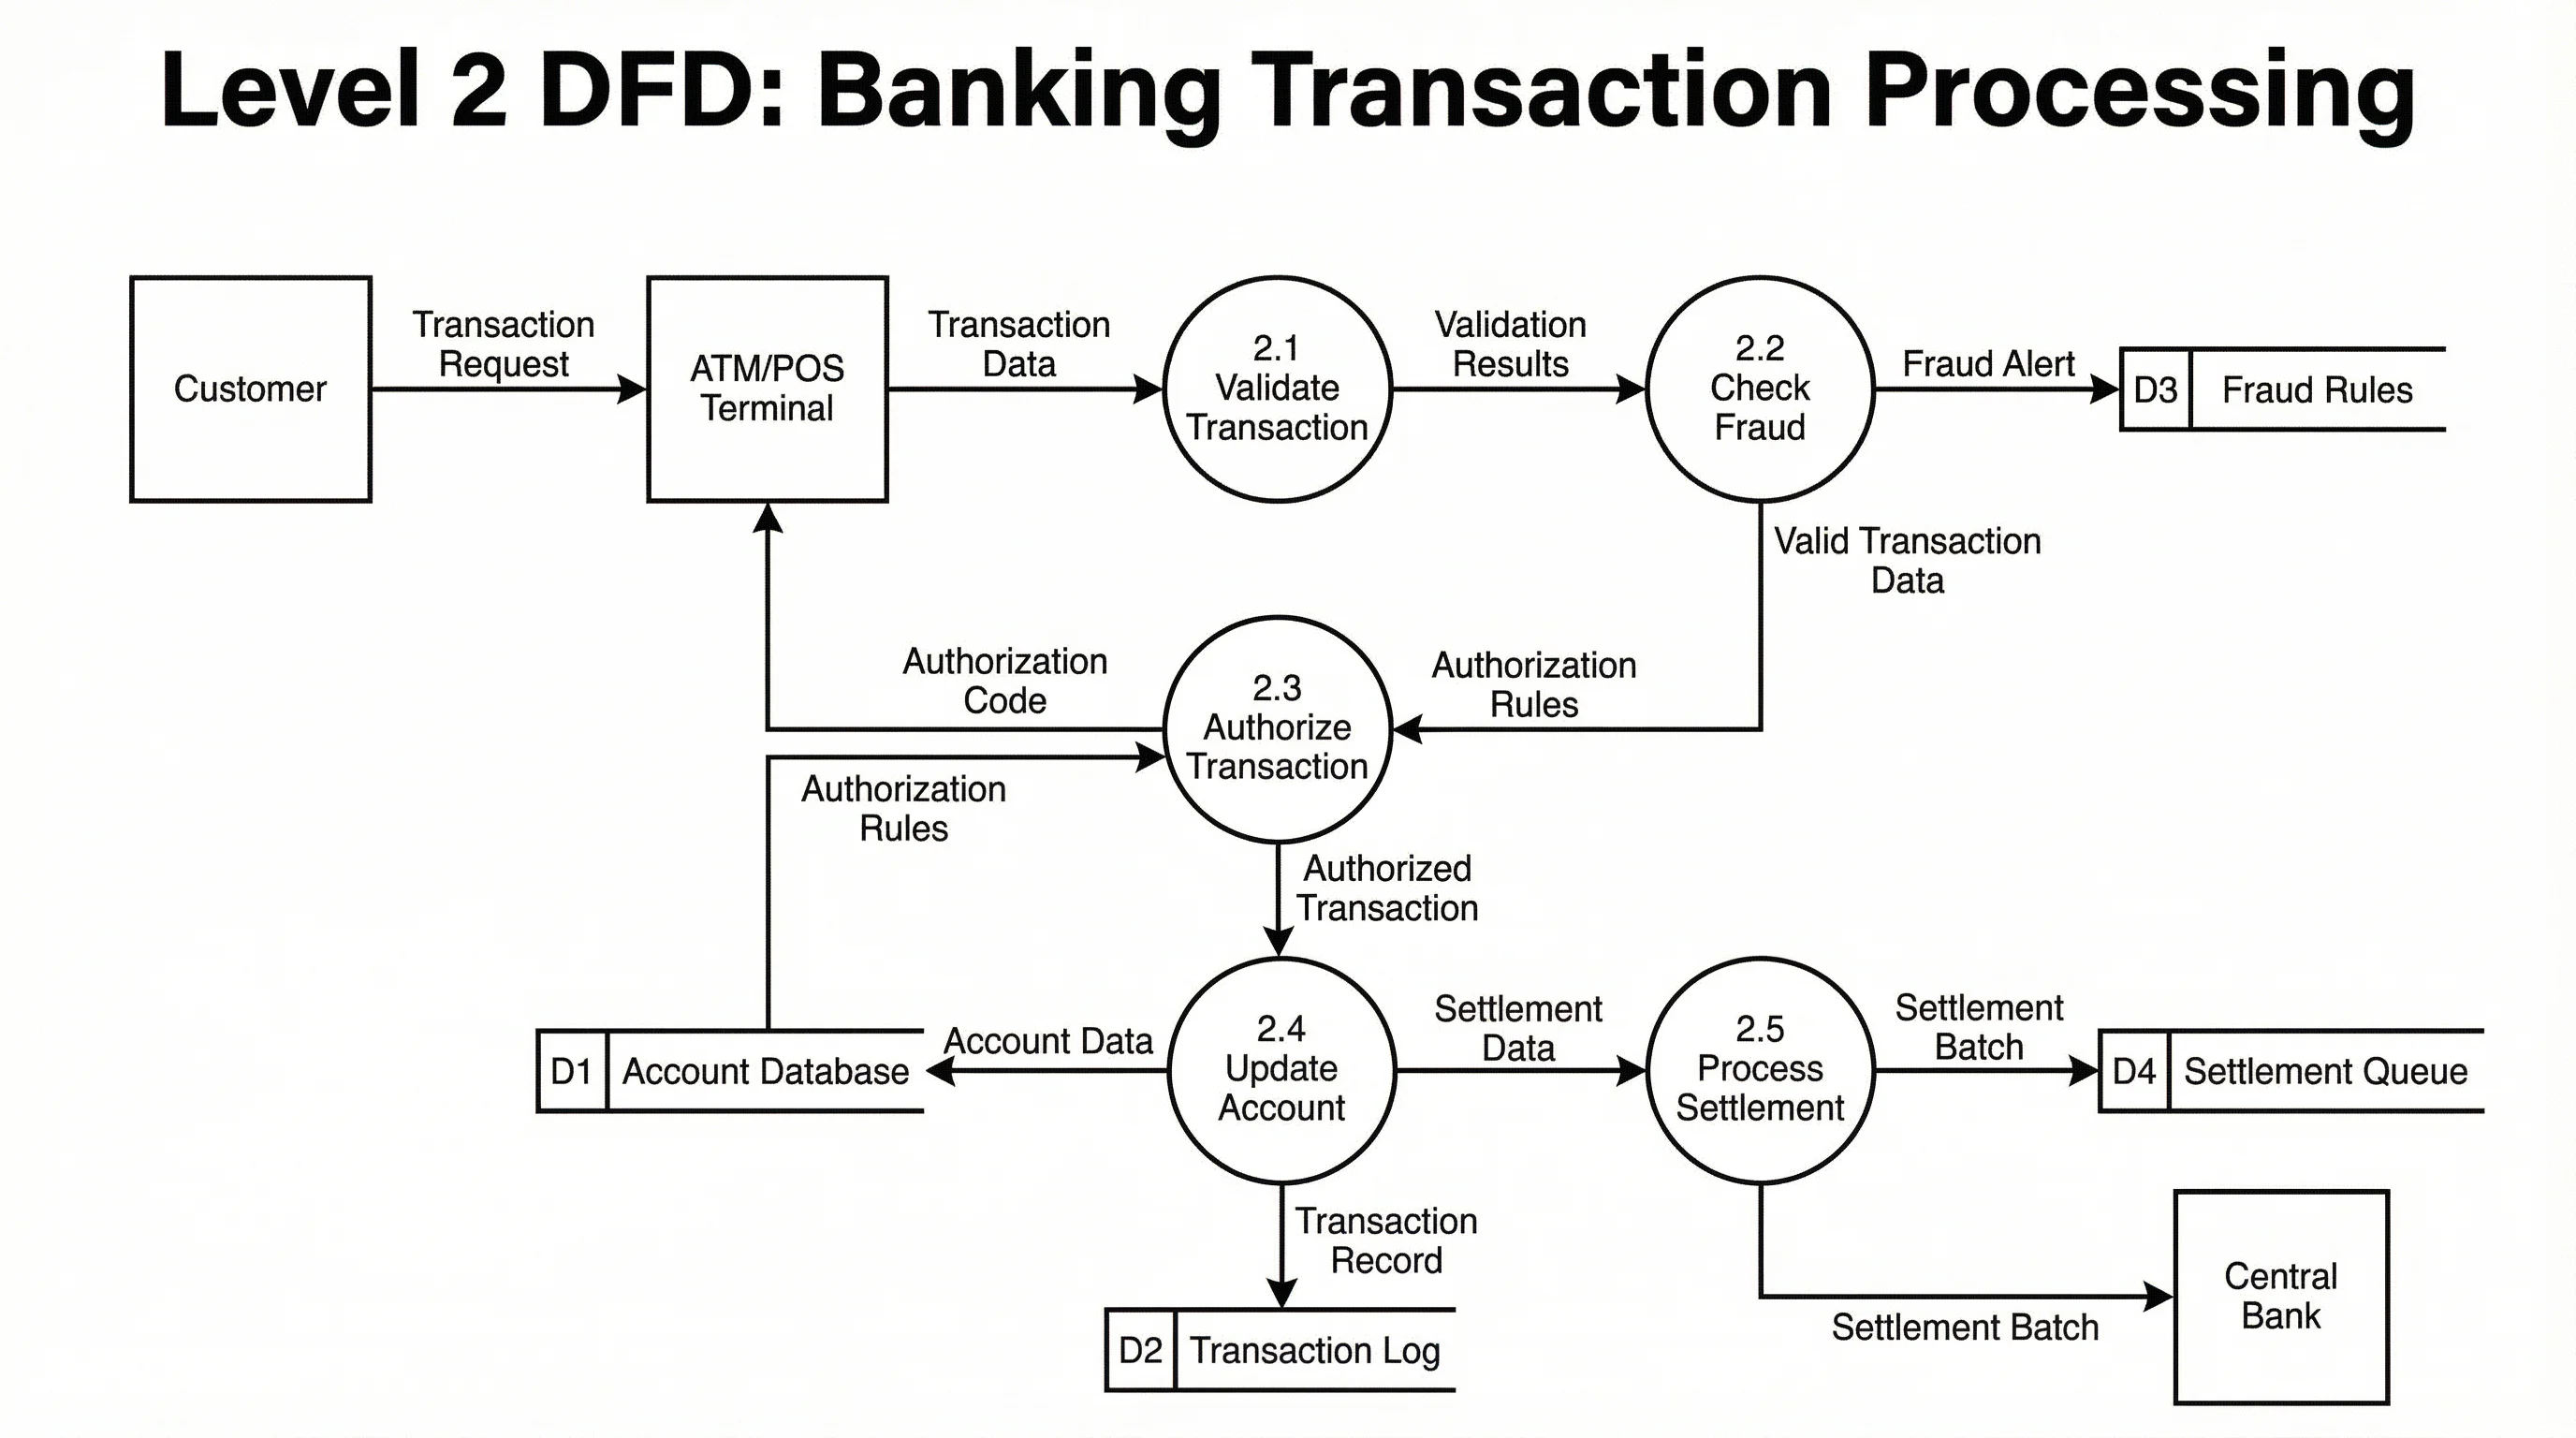
Data Flow Diagram Generator
Map how data moves through a system with processes, data stores, and flows.
 Visualization
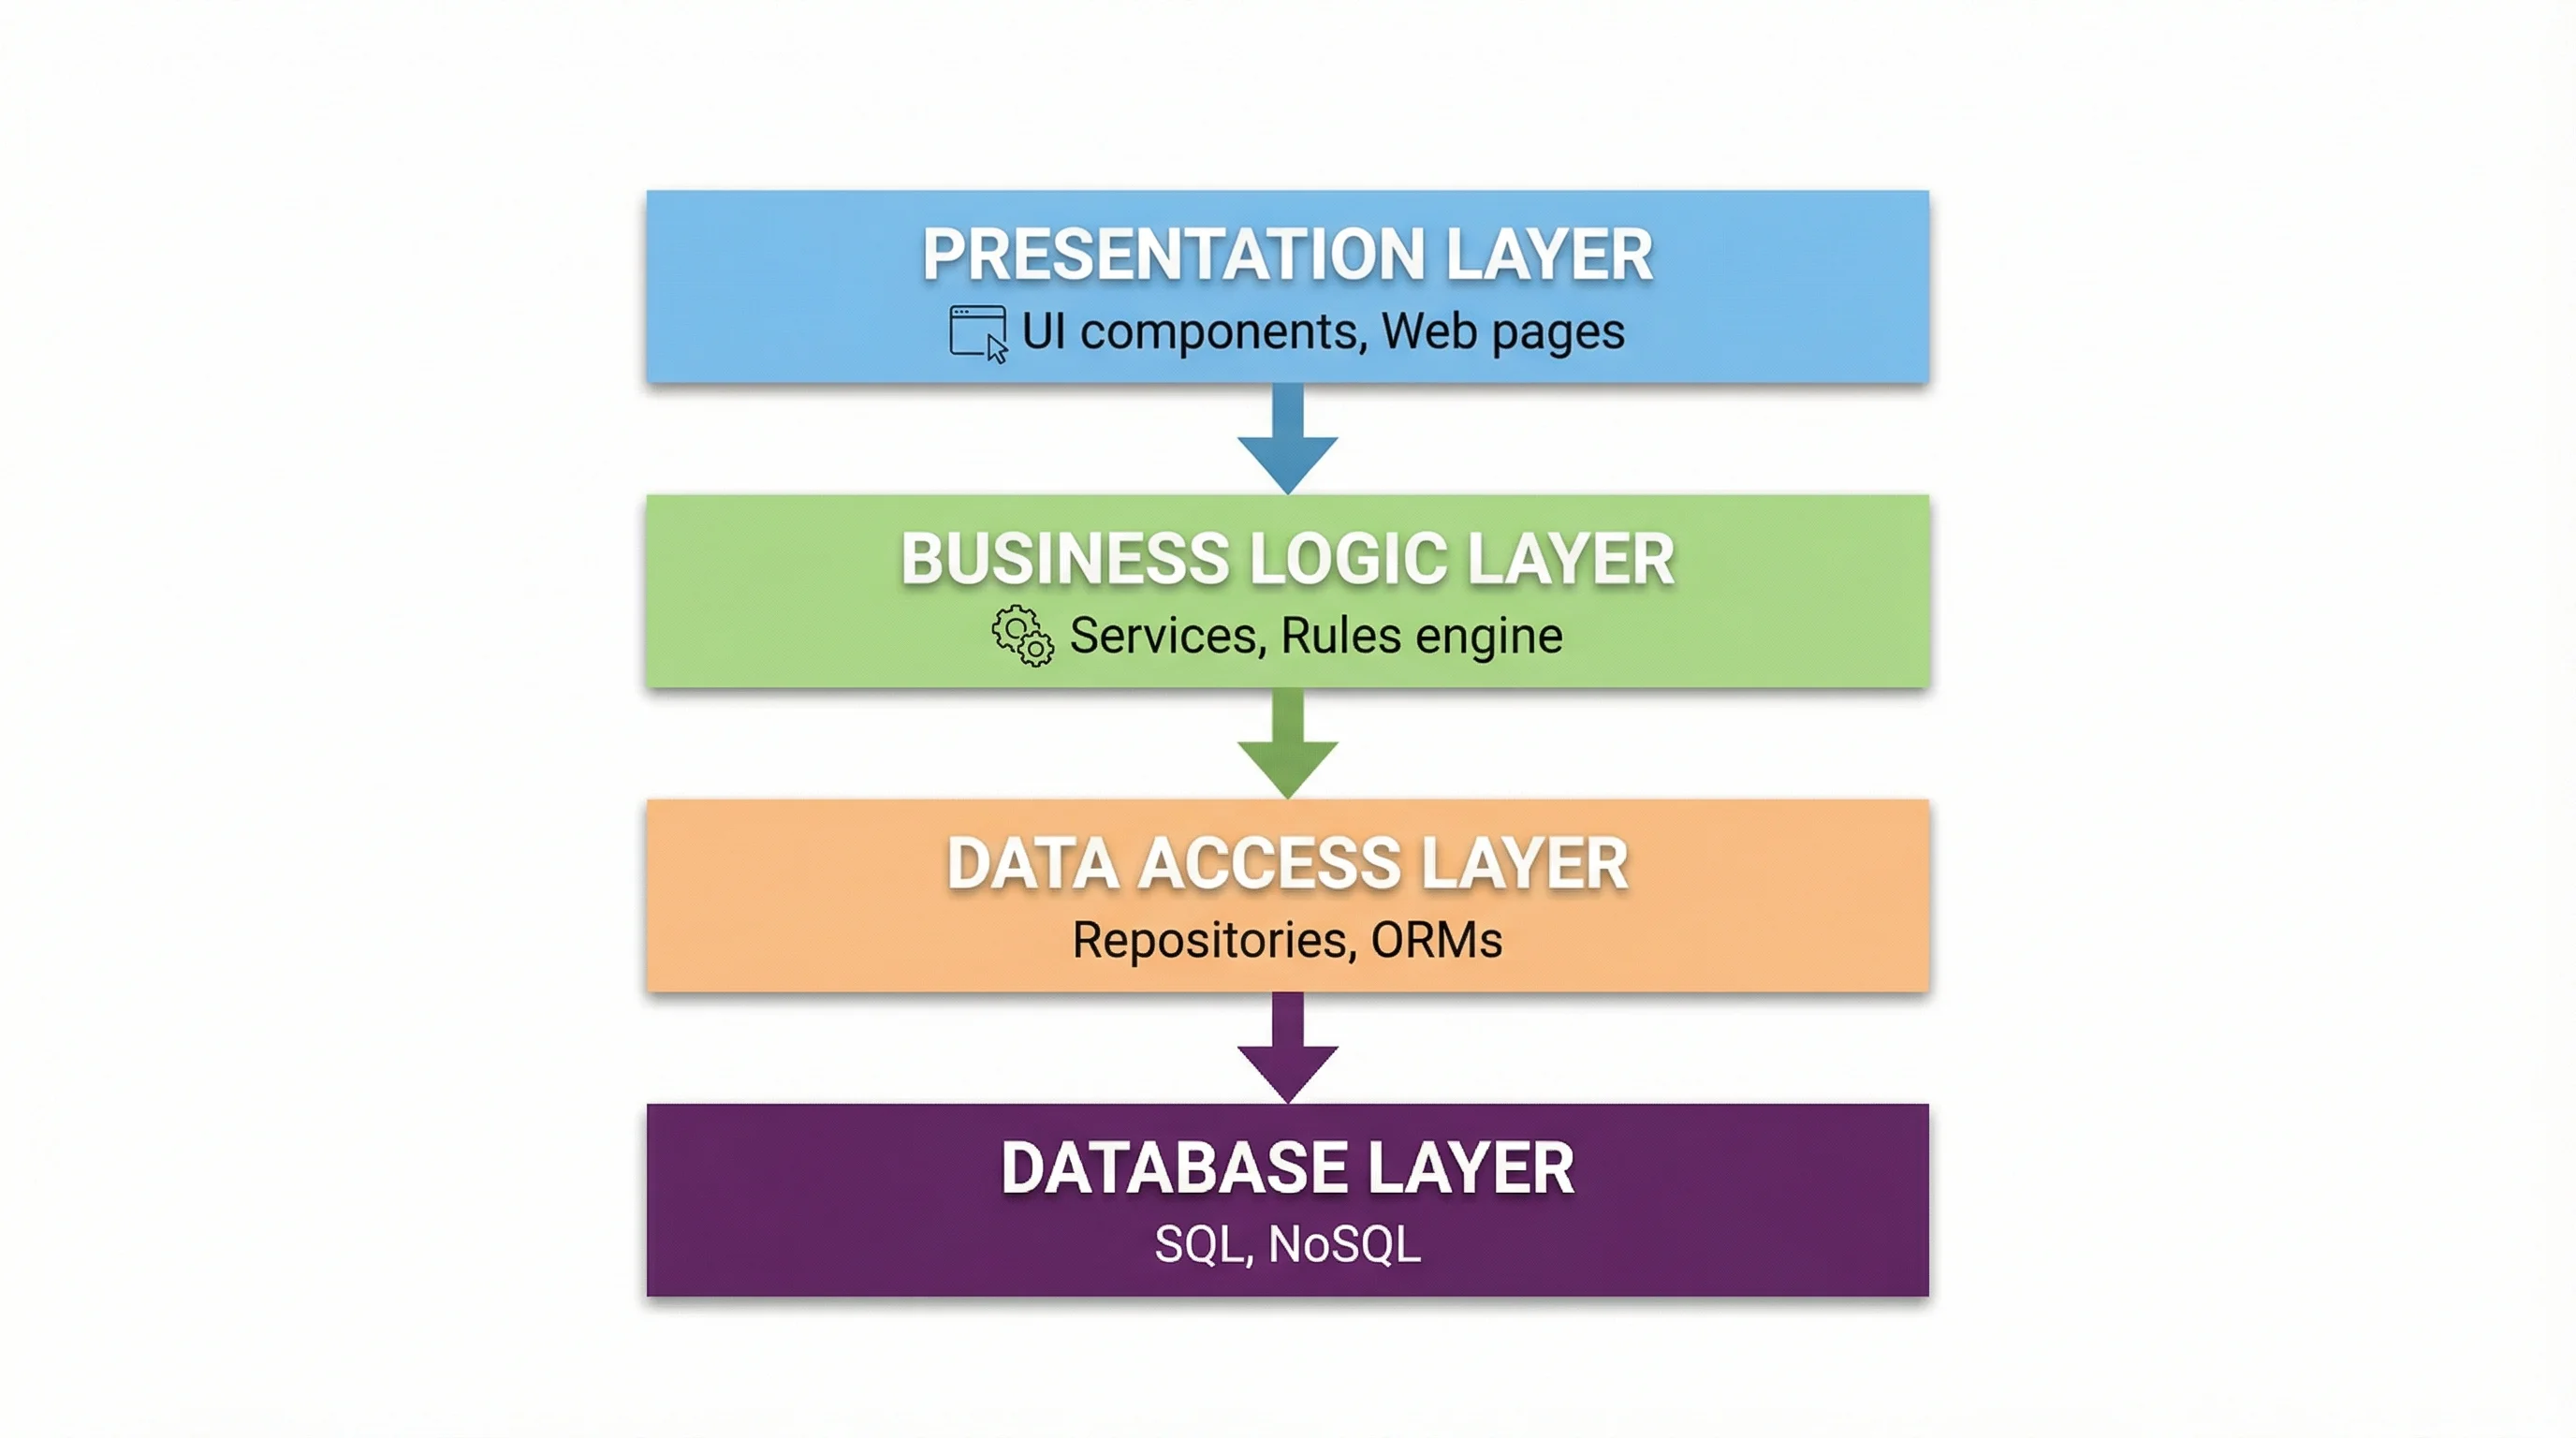
Software Architecture Diagram Generator
Lay out services, layers, and components to show how a system is structured.
 Engineering
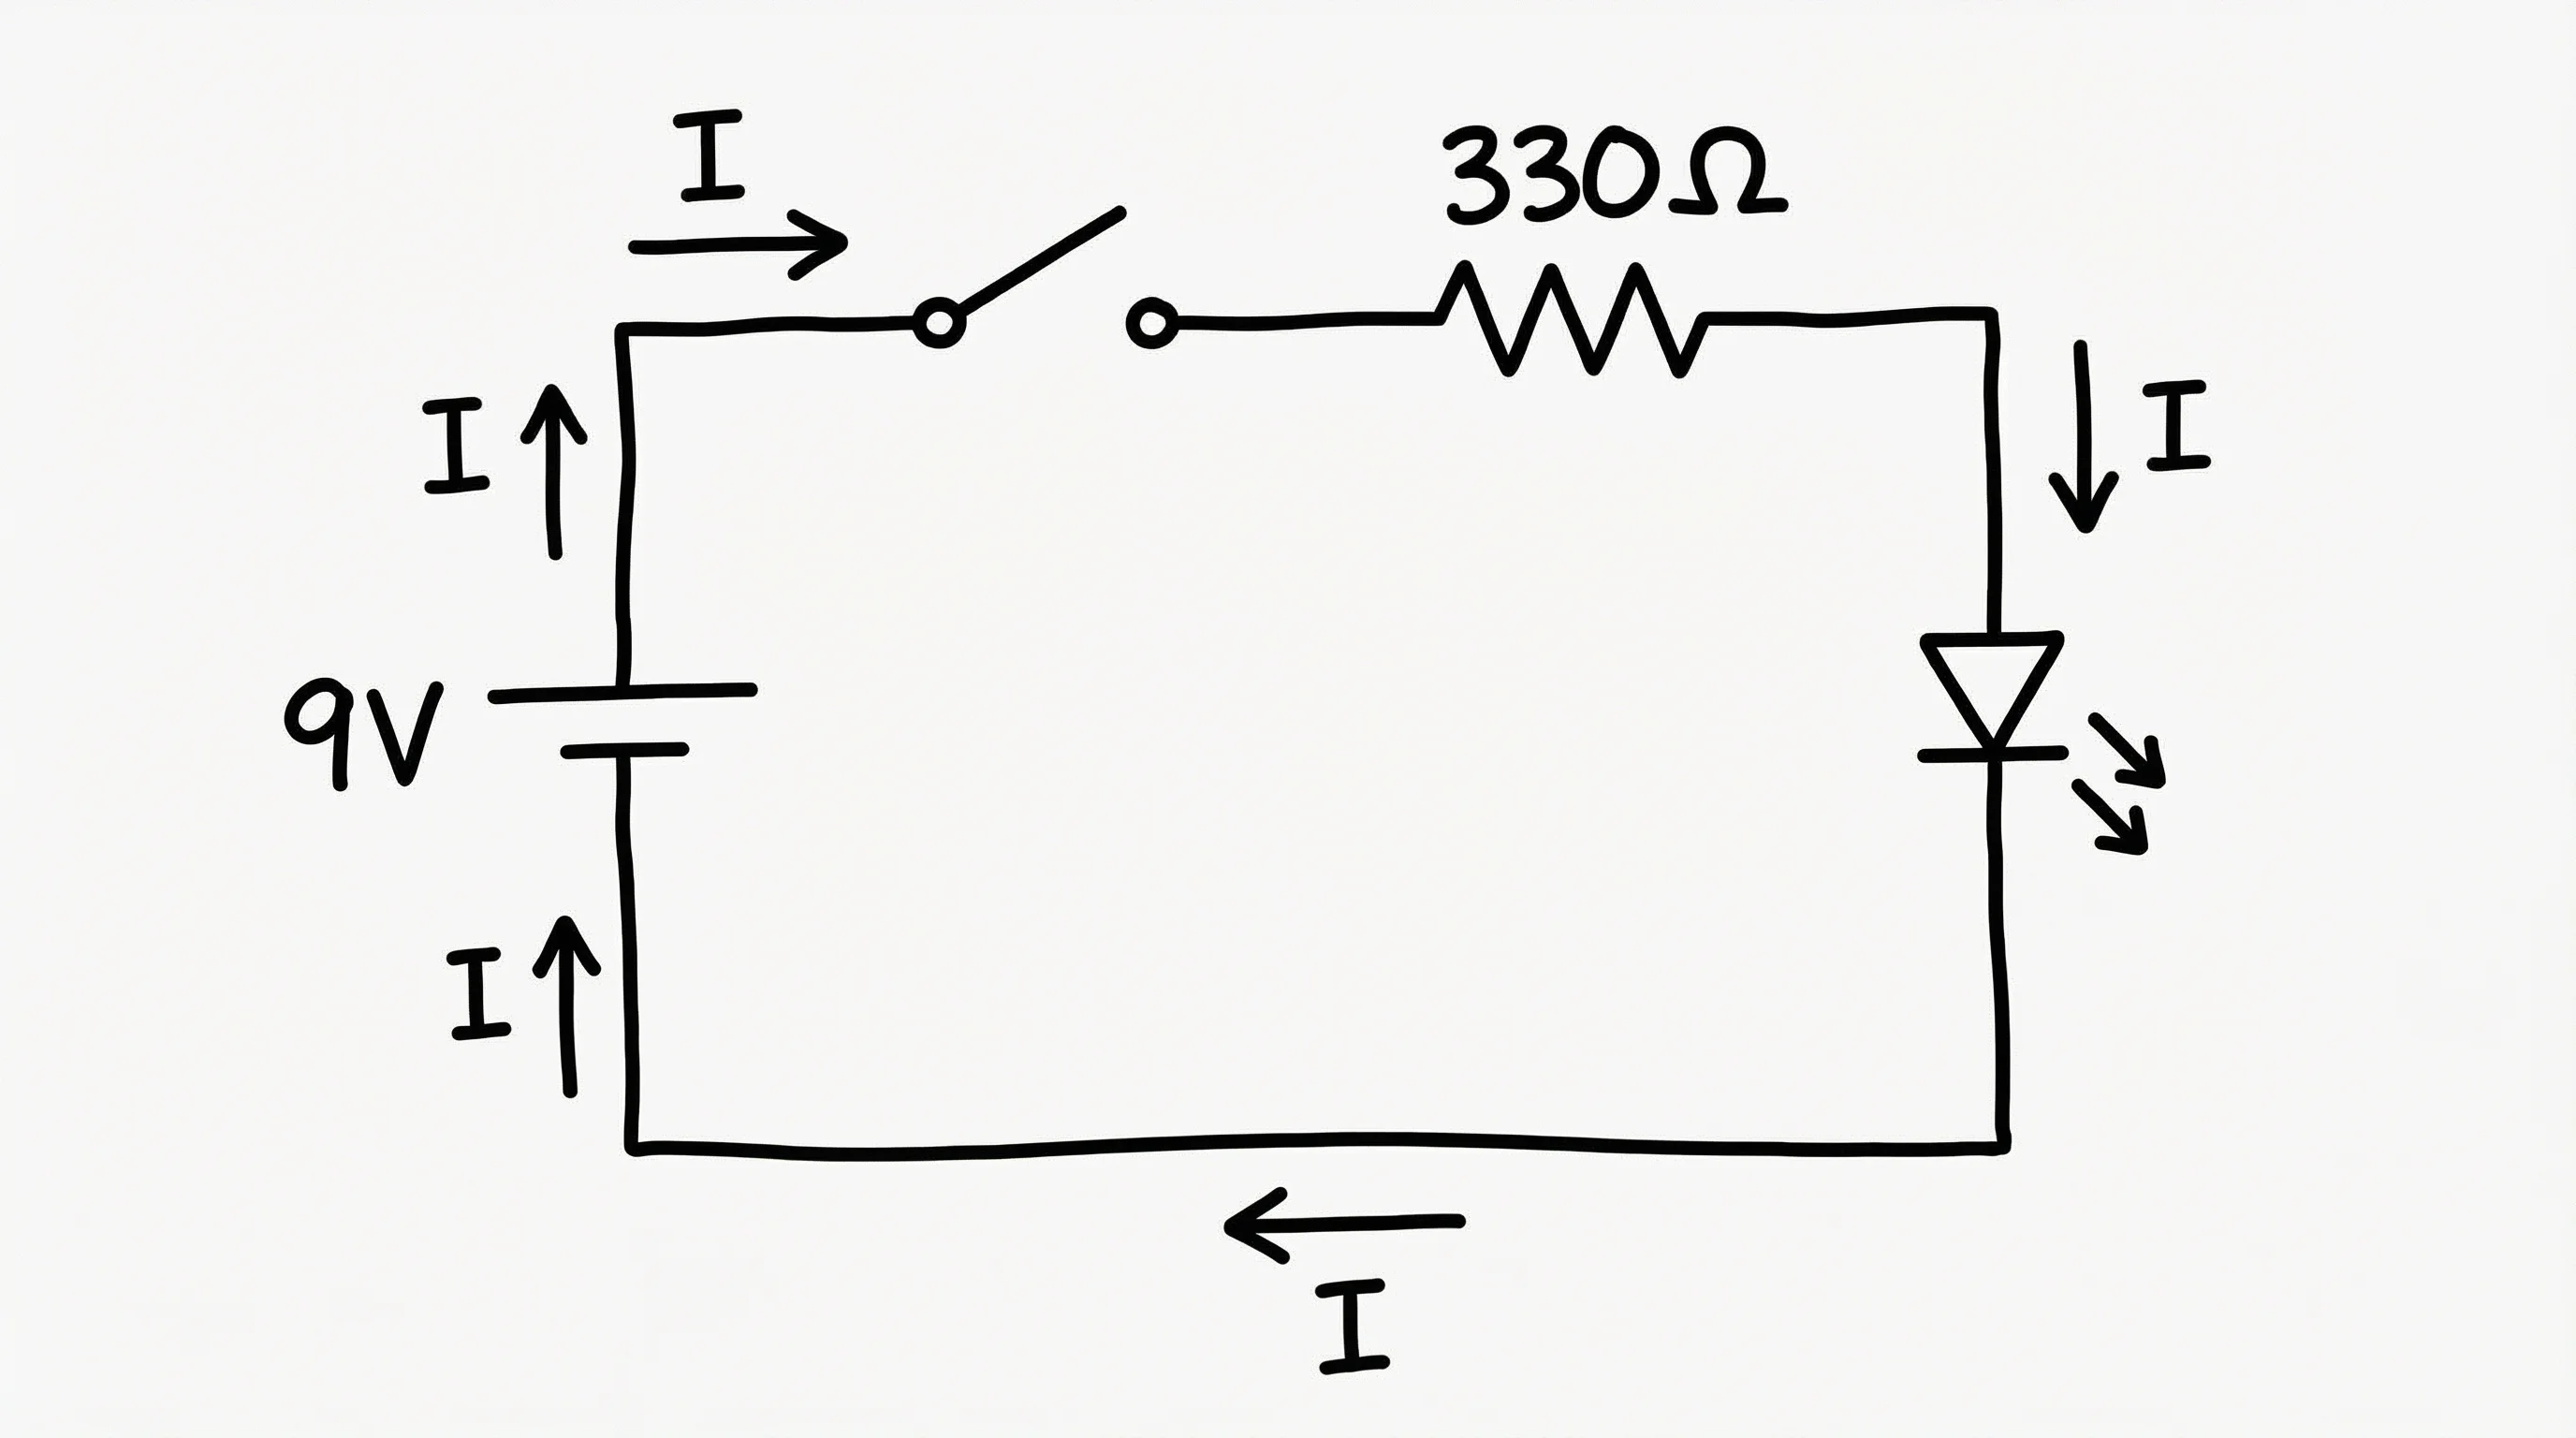
Circuit Diagram Maker
Draw detailed, component-level circuit schematics with standard symbols.