框图生成器 框图
描述你的系统或流程,AI将即时生成专业框图。完美适用于控制系统、信号处理和系统架构文档。
框图生成器
By using ConceptViz, you agree not to generate or edit adult, sexual, explicit, unsafe, or policy-violating content. See Content Policy.
免费试用 ·
框图将显示在这里
描述你的系统,点击生成
框图示例
浏览来自不同工程领域的示例,或在上方生成你自己的框图
控制系统反馈回路
带传递函数标注的经典闭环反馈控制系统,适合控制工程课程和研究使用。
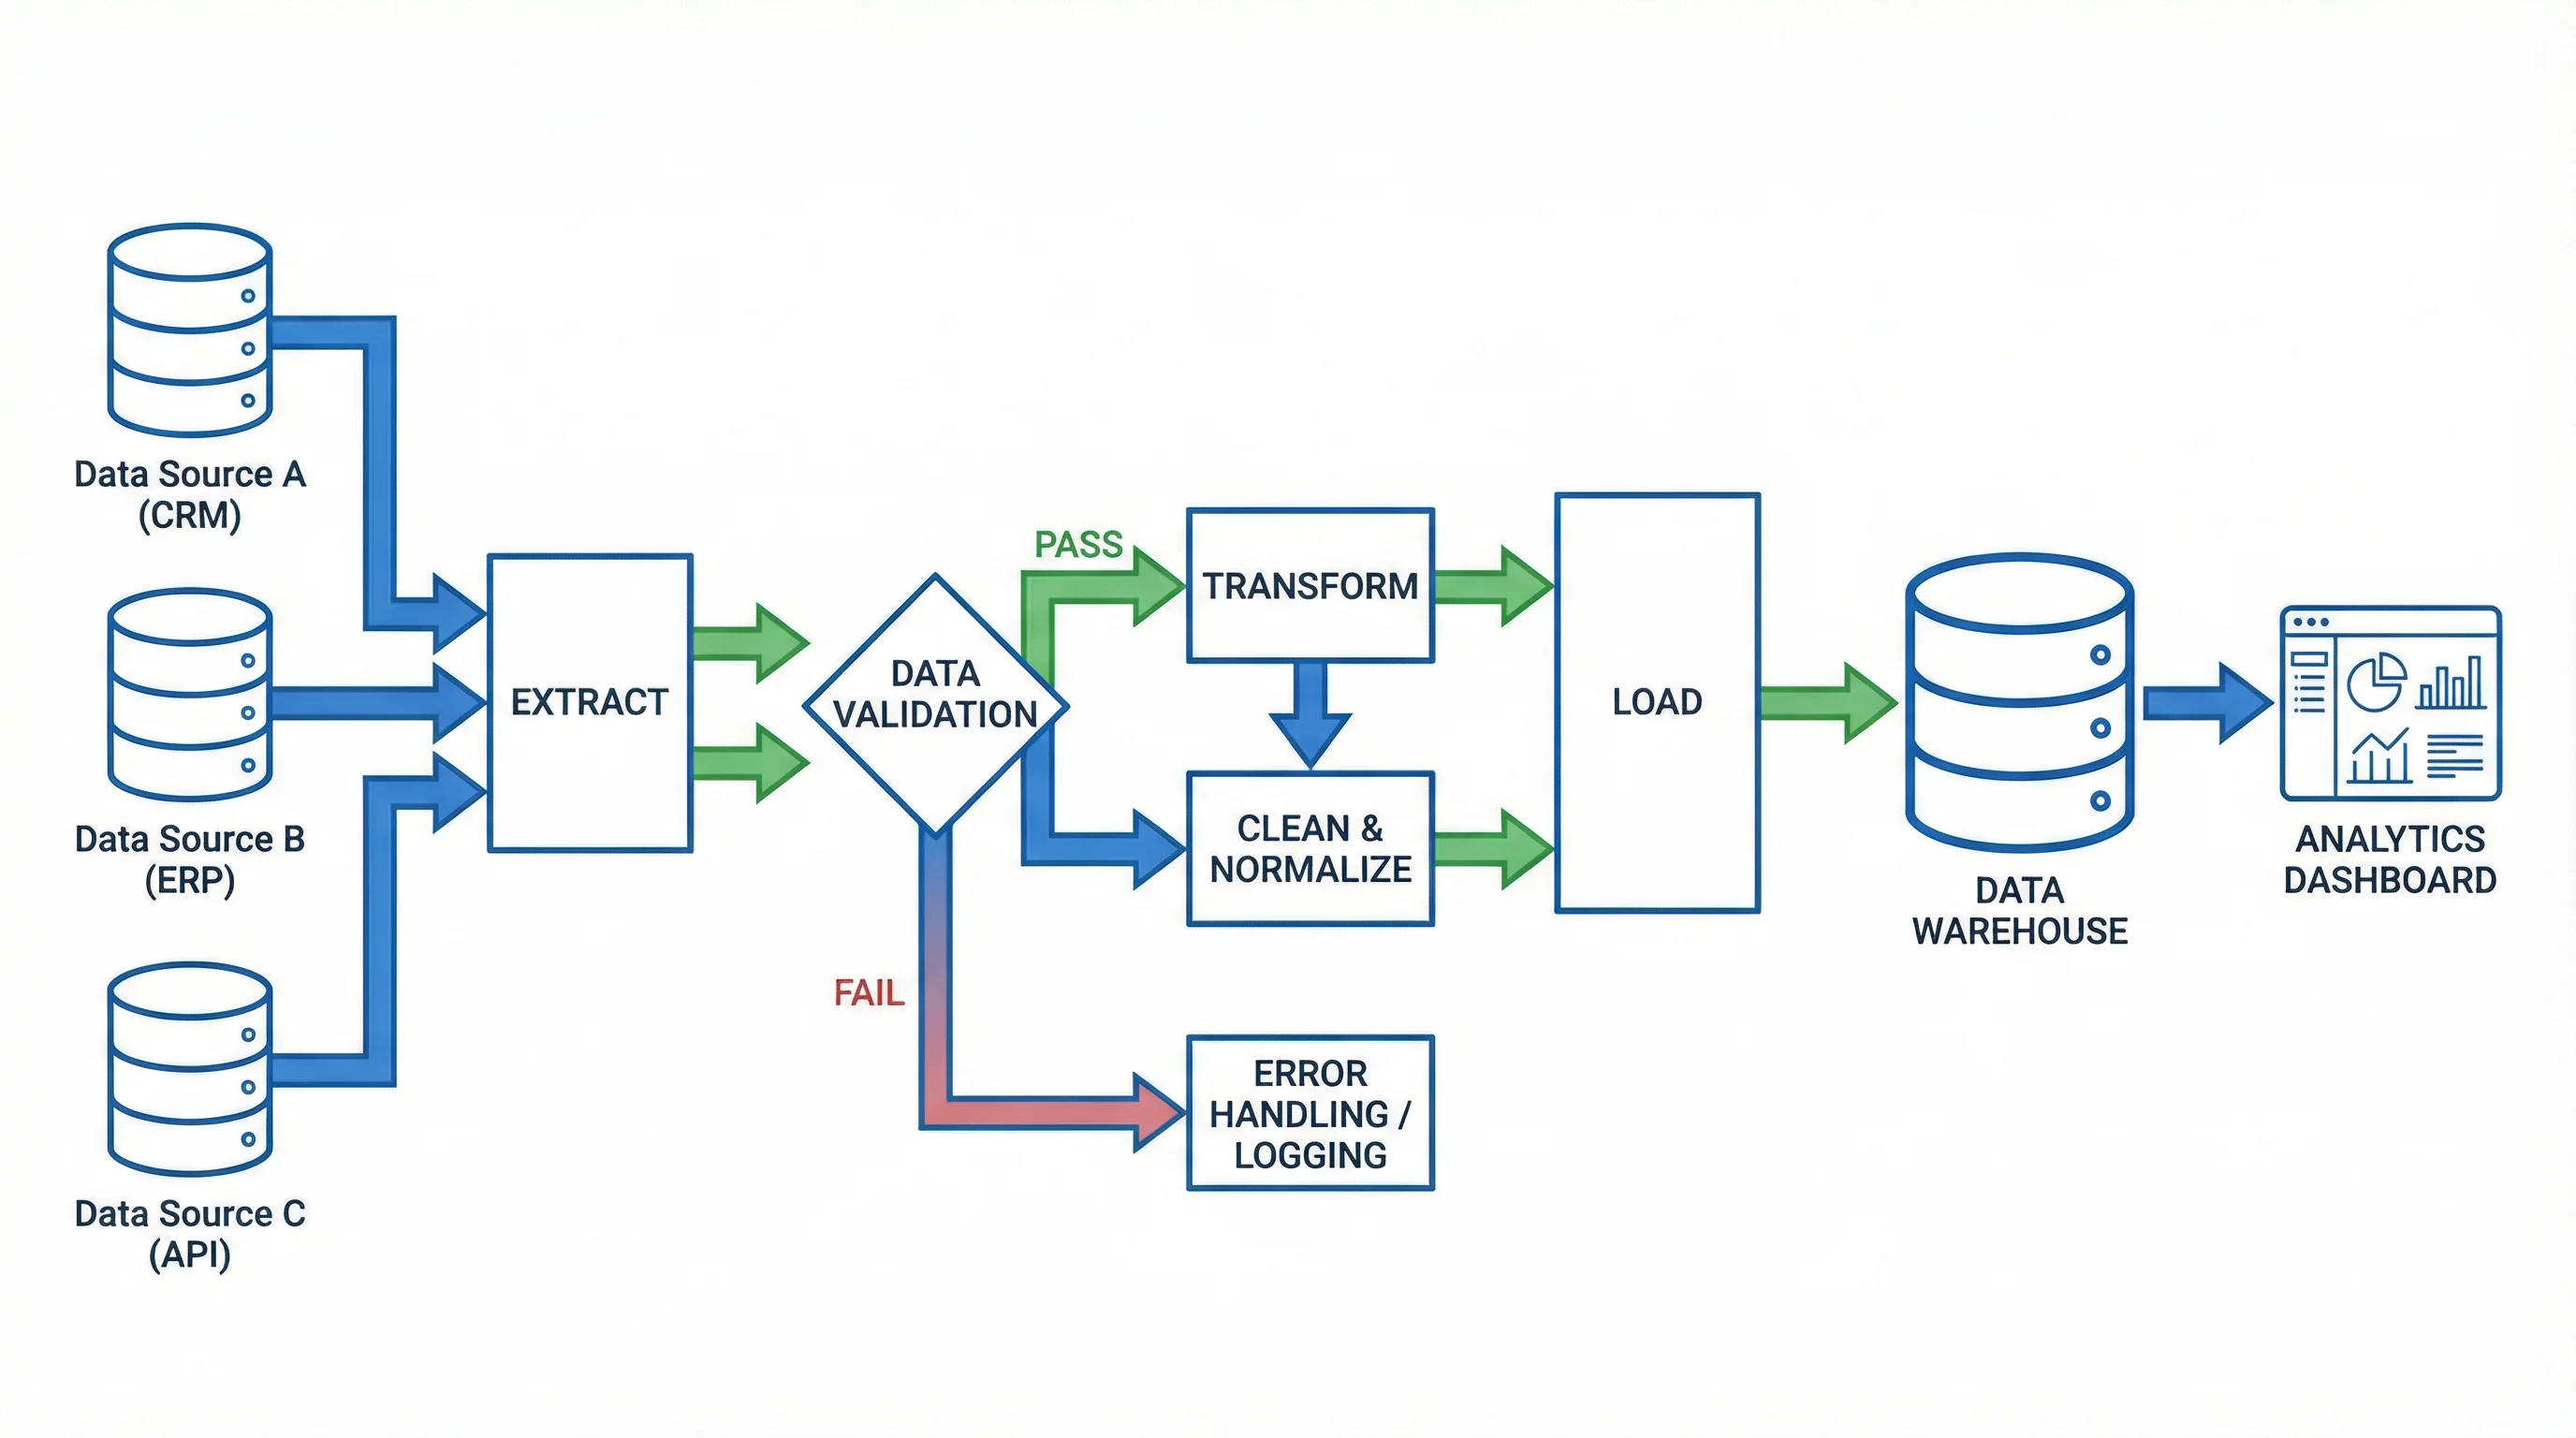
信号处理流水线
展示音频信号经各处理阶段流动的数字信号处理流水线框图。
通信系统
展示含发送端和接收端的完整数字通信系统的电信框图。
电源系统
电气工程稳压电源框图,展示各级信号变换过程。
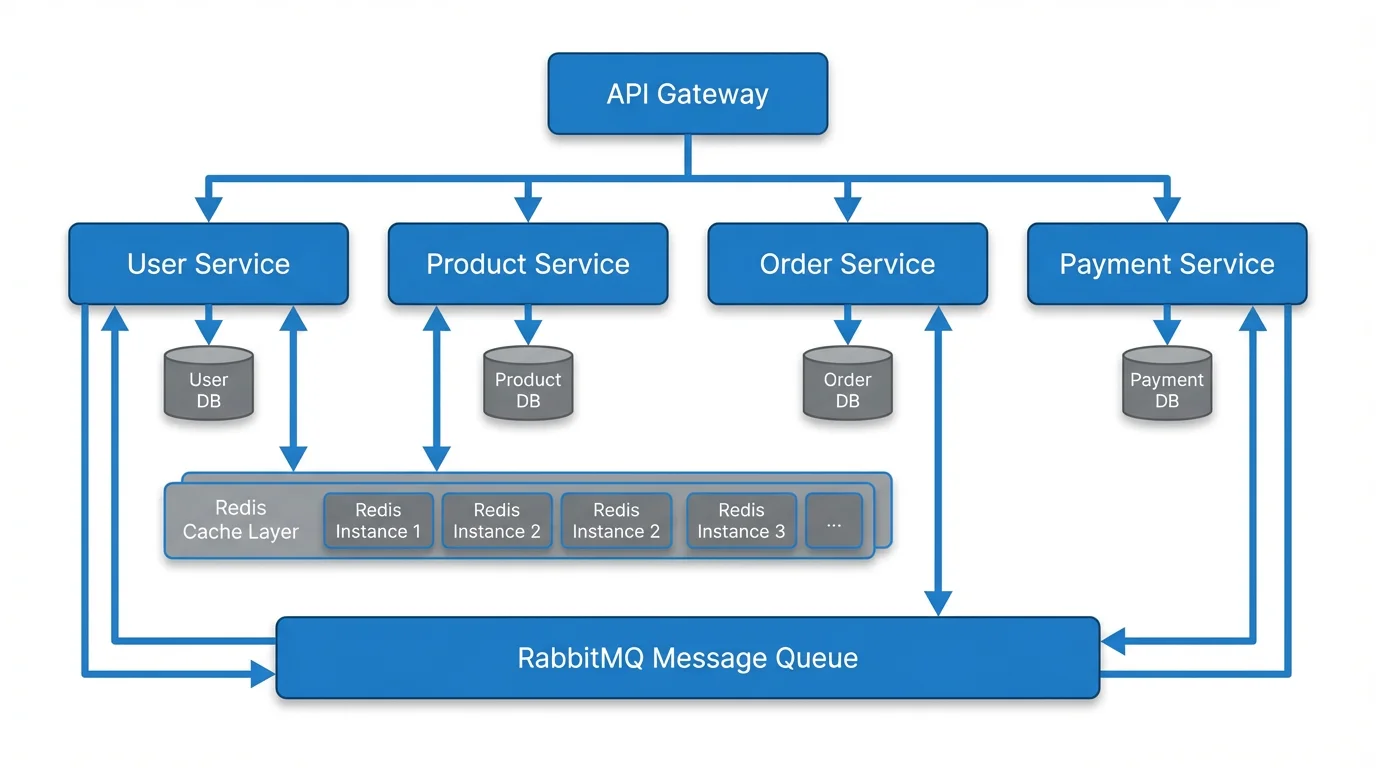
嵌入式系统架构
展示带外设和接口的嵌入式系统架构的计算机工程框图。
制造流程图
展示带反馈回路和质量控制的制造流程的工业工程框图。
什么是框图?
框图是用矩形方块通过连线或箭头相连,以展示组件之间关系的系统、流程或算法的简化图形表示。每个方块代表一个功能单元或操作,连线则展示信号、数据或物料在其间的流动。框图是工程、计算机科学和项目管理中的基础工具,能够在不涉及实现细节的情况下提供复杂系统的宏观视图。
框图的类型
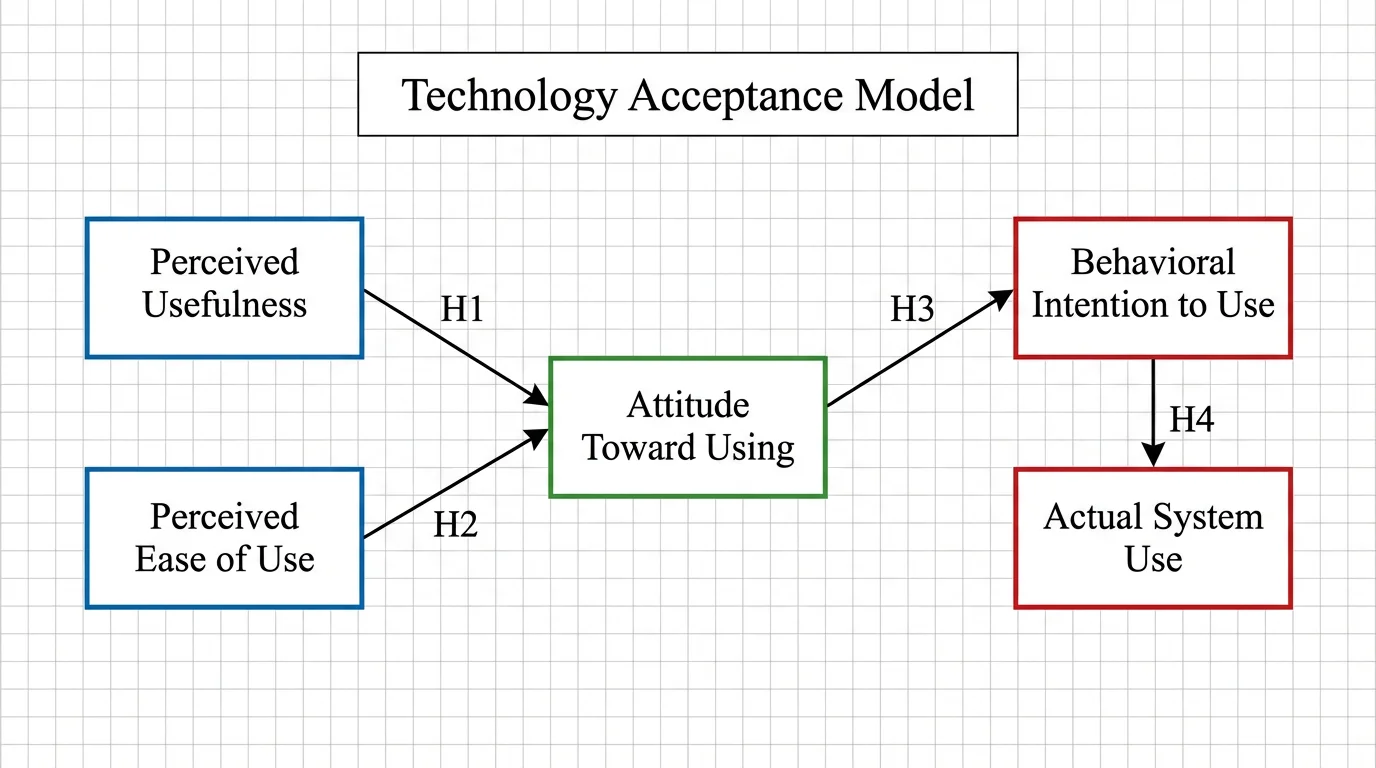
- 功能框图:展示系统组件的功能和相互关系
- 系统框图:表示硬件或软件系统的整体架构
- 流程框图:展示制造或化工流程中的顺序步骤
- 控制系统框图:使用传递函数对反馈和控制回路进行建模
- 信号流程框图:展示信号如何通过各处理阶段传播
- 硬件框图:描绘电子系统中的物理组件及其连接
框图代数与化简规则
在控制工程中,框图代数提供了系统化简复杂图形的规则。串联(级联)方块的传递函数相乘;并联方块的传递函数相加;反馈回路采用负反馈公式 G/(1+GH)。移动求和点或引出点需要用相应的传递函数进行补偿。这些化简规则使工程师能够从框图推导系统的总传递函数,对稳定性分析和控制器设计至关重要。
何时使用框图
- 系统设计:规划新硬件或软件系统的架构
- 控制工程:对反馈回路、PID控制器和对象动态特性进行建模
- 信号处理:可视化滤波器链、编解码流水线和DSP算法
- 教育教学:向学生讲解系统组件及其相互作用
- 故障排查:定位系统中的故障或瓶颈所在
- 技术文档:为复杂系统创建清晰的技术文档
在工程与科研中的应用
框图在各工程学科中被广泛使用。在电气工程中,用于表示电力系统、通信网络和电路架构;在机械工程中,用于建模机器人和自动化控制系统;在软件工程中,用于展示微服务架构、数据管道和系统集成;在化工中,用于描绘流程和反应器系统。我们的AI框图生成器可为所有这些应用创建专业图表,并遵循标准工程符号和规范。