活动图生成器 活动图
描述您的工作流程或业务过程,我们的AI将使用标准UML符号创建专业的活动图。非常适合建模业务流程、软件工作流和系统行为。
活动图生成器
免费试用 ·
您的活动图将显示在这里
描述您的工作流程并点击生成
活动图示例
浏览工作流和流程示例,或在上方生成您自己的活动图
用户登录流程
用户登录活动图,包含凭据验证判断节点、可选双因素认证分支、登录失败后的账户锁定以及成功后的会话创建。
订单处理工作流
电商订单处理活动图,包含用于并行支付验证和库存检查的分叉栏、用于同步的汇合栏,以及客户、系统和仓库角色的泳道。
CI/CD流水线
持续集成与部署活动图,展示代码提交触发、分叉/汇合的并行单元测试和集成测试、质量关卡判断、暂存环境部署、审批关卡和生产发布。
患者入院流程
医院患者入院活动图,包含前台、护理和医生角色的泳道,涵盖登记、分诊评估、保险核实和床位分配。
ATM取款流程
ATM现金取款活动图,展示插卡、带重试逻辑的PIN验证、金额输入、余额查询、现金发放和收据打印,每个验证步骤都有判断节点。
代码评审流程
软件代码评审活动图,包含开发者和审查者的泳道,涵盖拉取请求创建、自动检查、同行评审周期、审批工作流和合并到主分支。
什么是UML活动图?
UML活动图是一种行为图,用于建模系统或业务工作流中动作、决策和并行过程的动态流程。活动图最初是统一建模语言(UML)规范的一部分,现已成为最广泛使用的UML图类型之一,因为它能够直观地表示技术人员和非技术人员都能理解的逐步流程。活动图类似于流程图,但增加了强大的UML特有结构,如用于并发的分叉/汇合栏、用于角色分离的泳道以及用于进程间通信的信号事件,使其在建模现实世界流程时具有更强的表达能力。
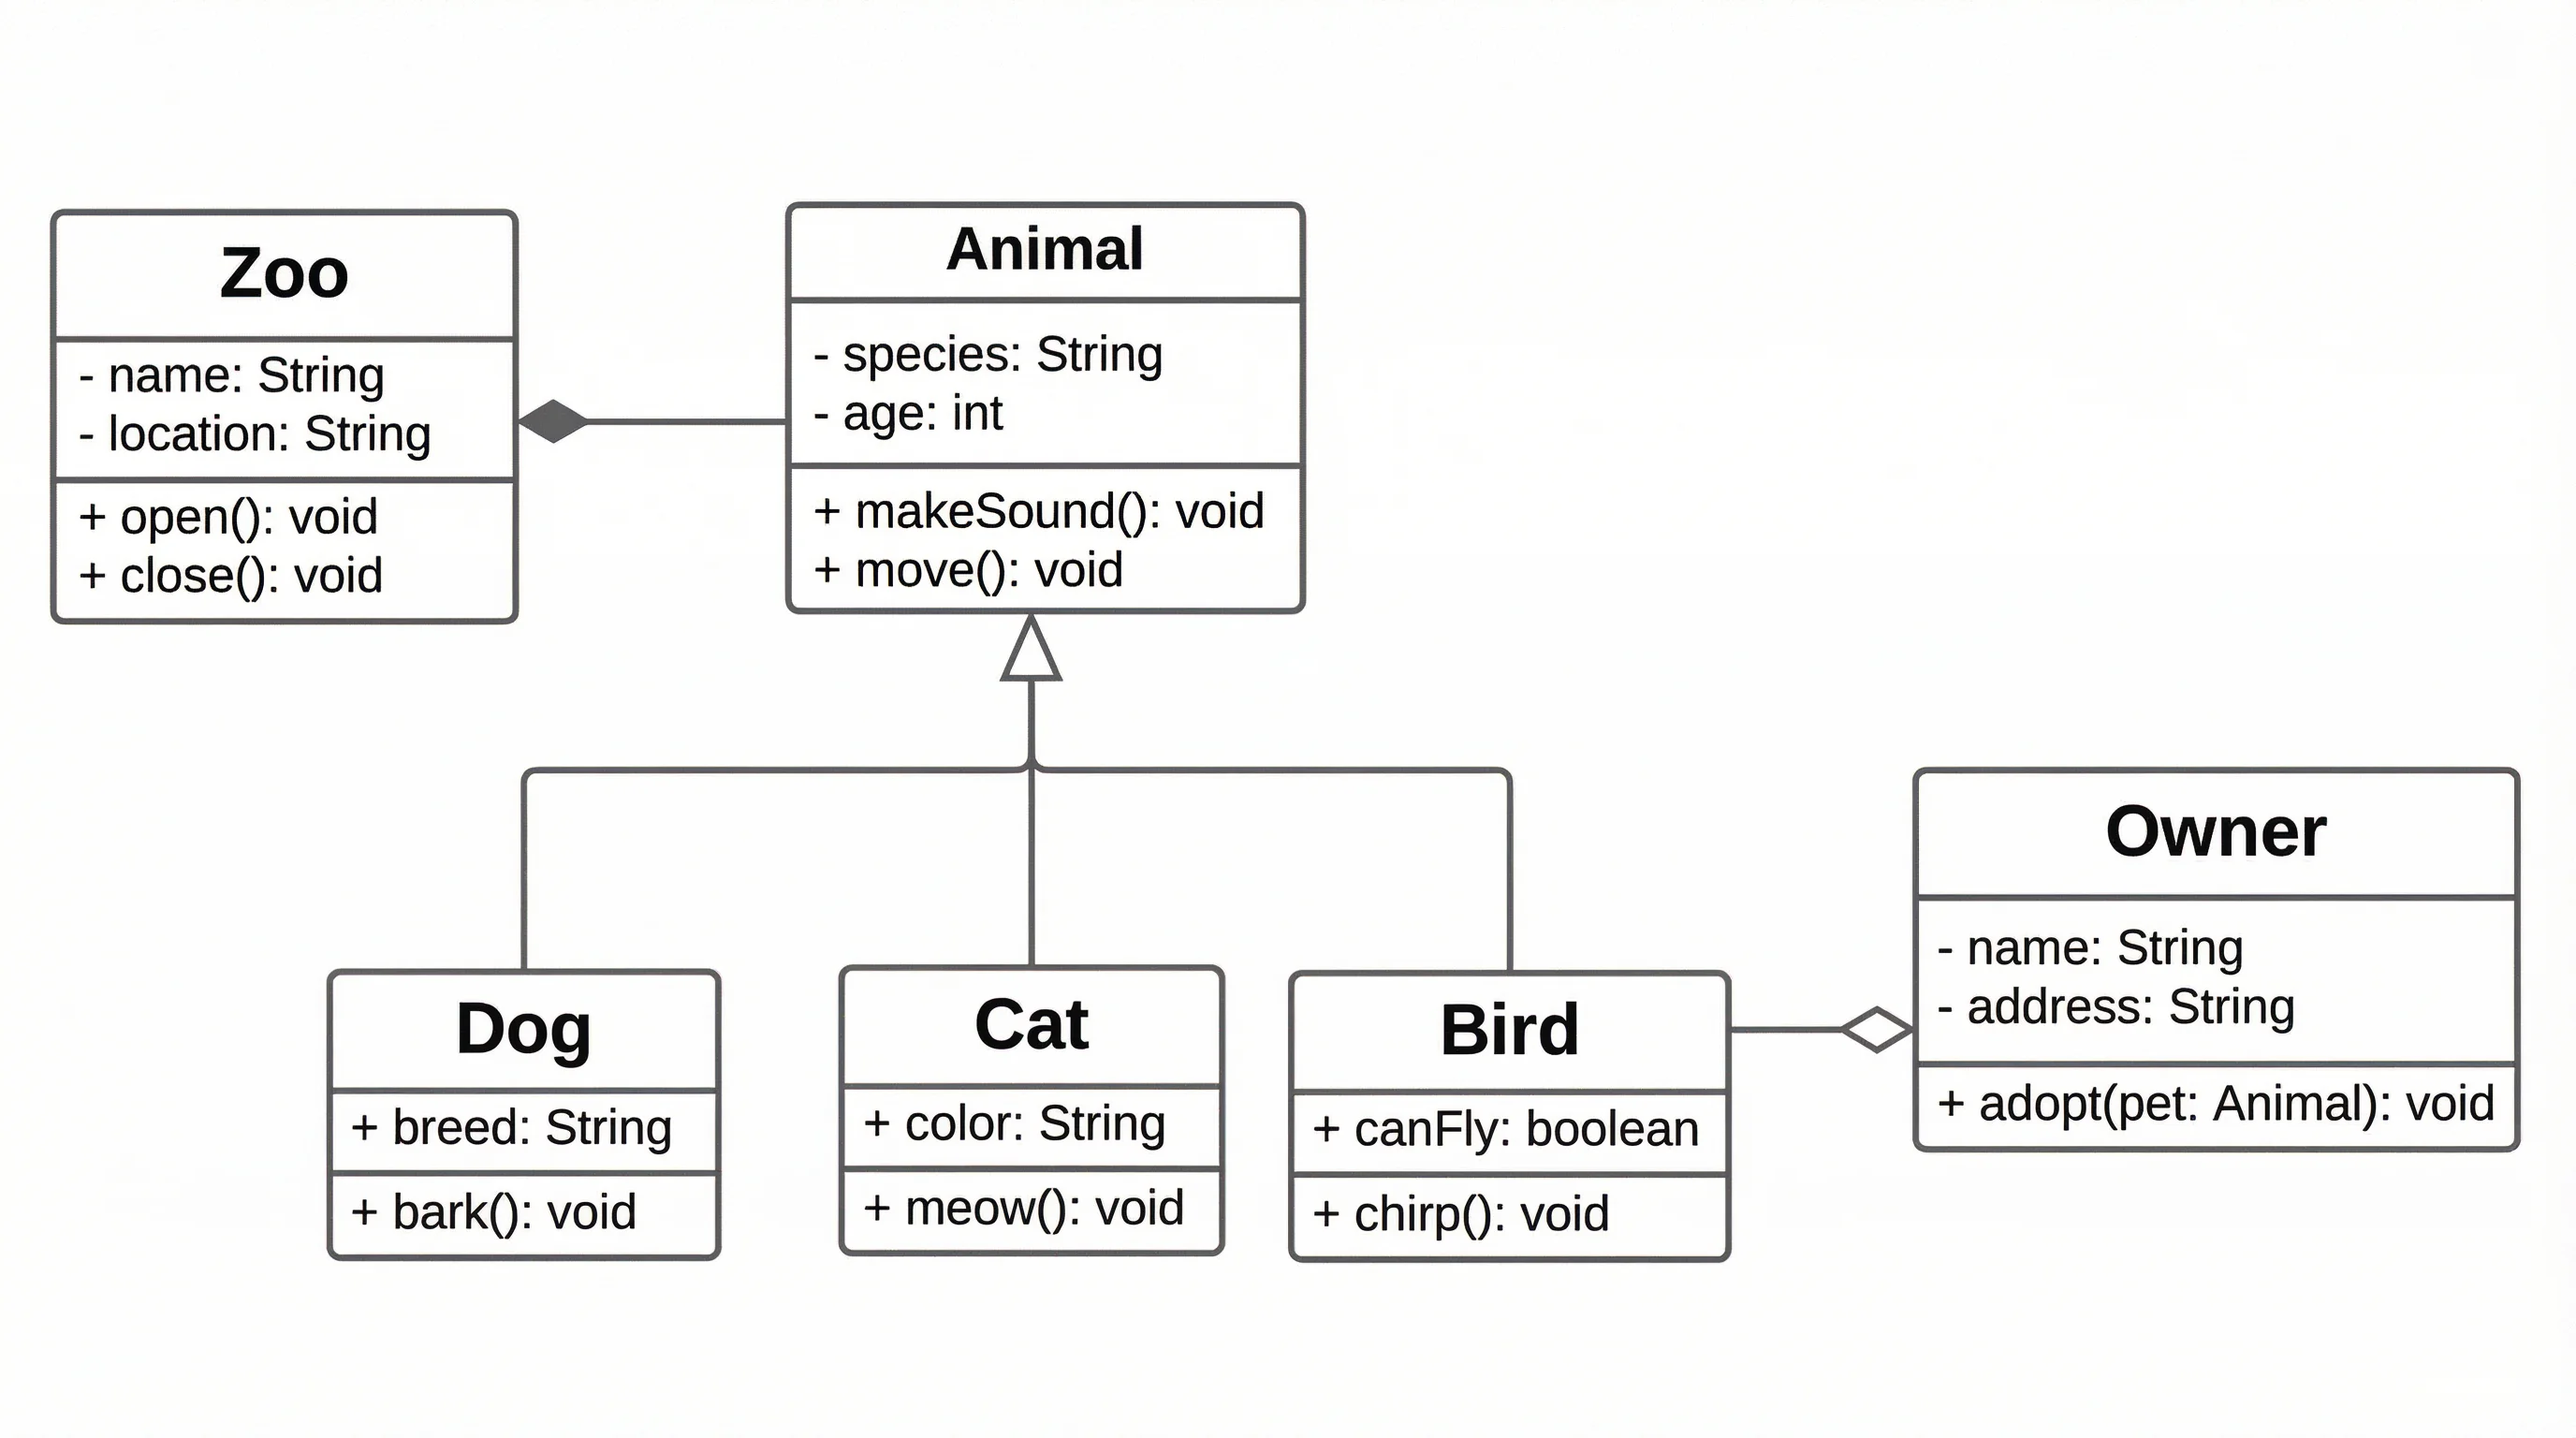
UML活动图符号与记法
活动图使用一组明确定义的UML符号记法。初始节点(实心圆)标记起始点,活动终止节点(内含实心圆的圆)标记结束。动作节点(圆角矩形)表示单个步骤或任务。判断节点(菱形)通过出边上的守卫条件引入条件分支。合并节点(同样是菱形)将替代流合并回来。对象节点(矩形)表示在动作之间传递的数据对象。连接边(箭头)显示节点之间的流向。理解这些核心符号对于阅读和创建任何软件专业人员都能解读的标准活动图至关重要。
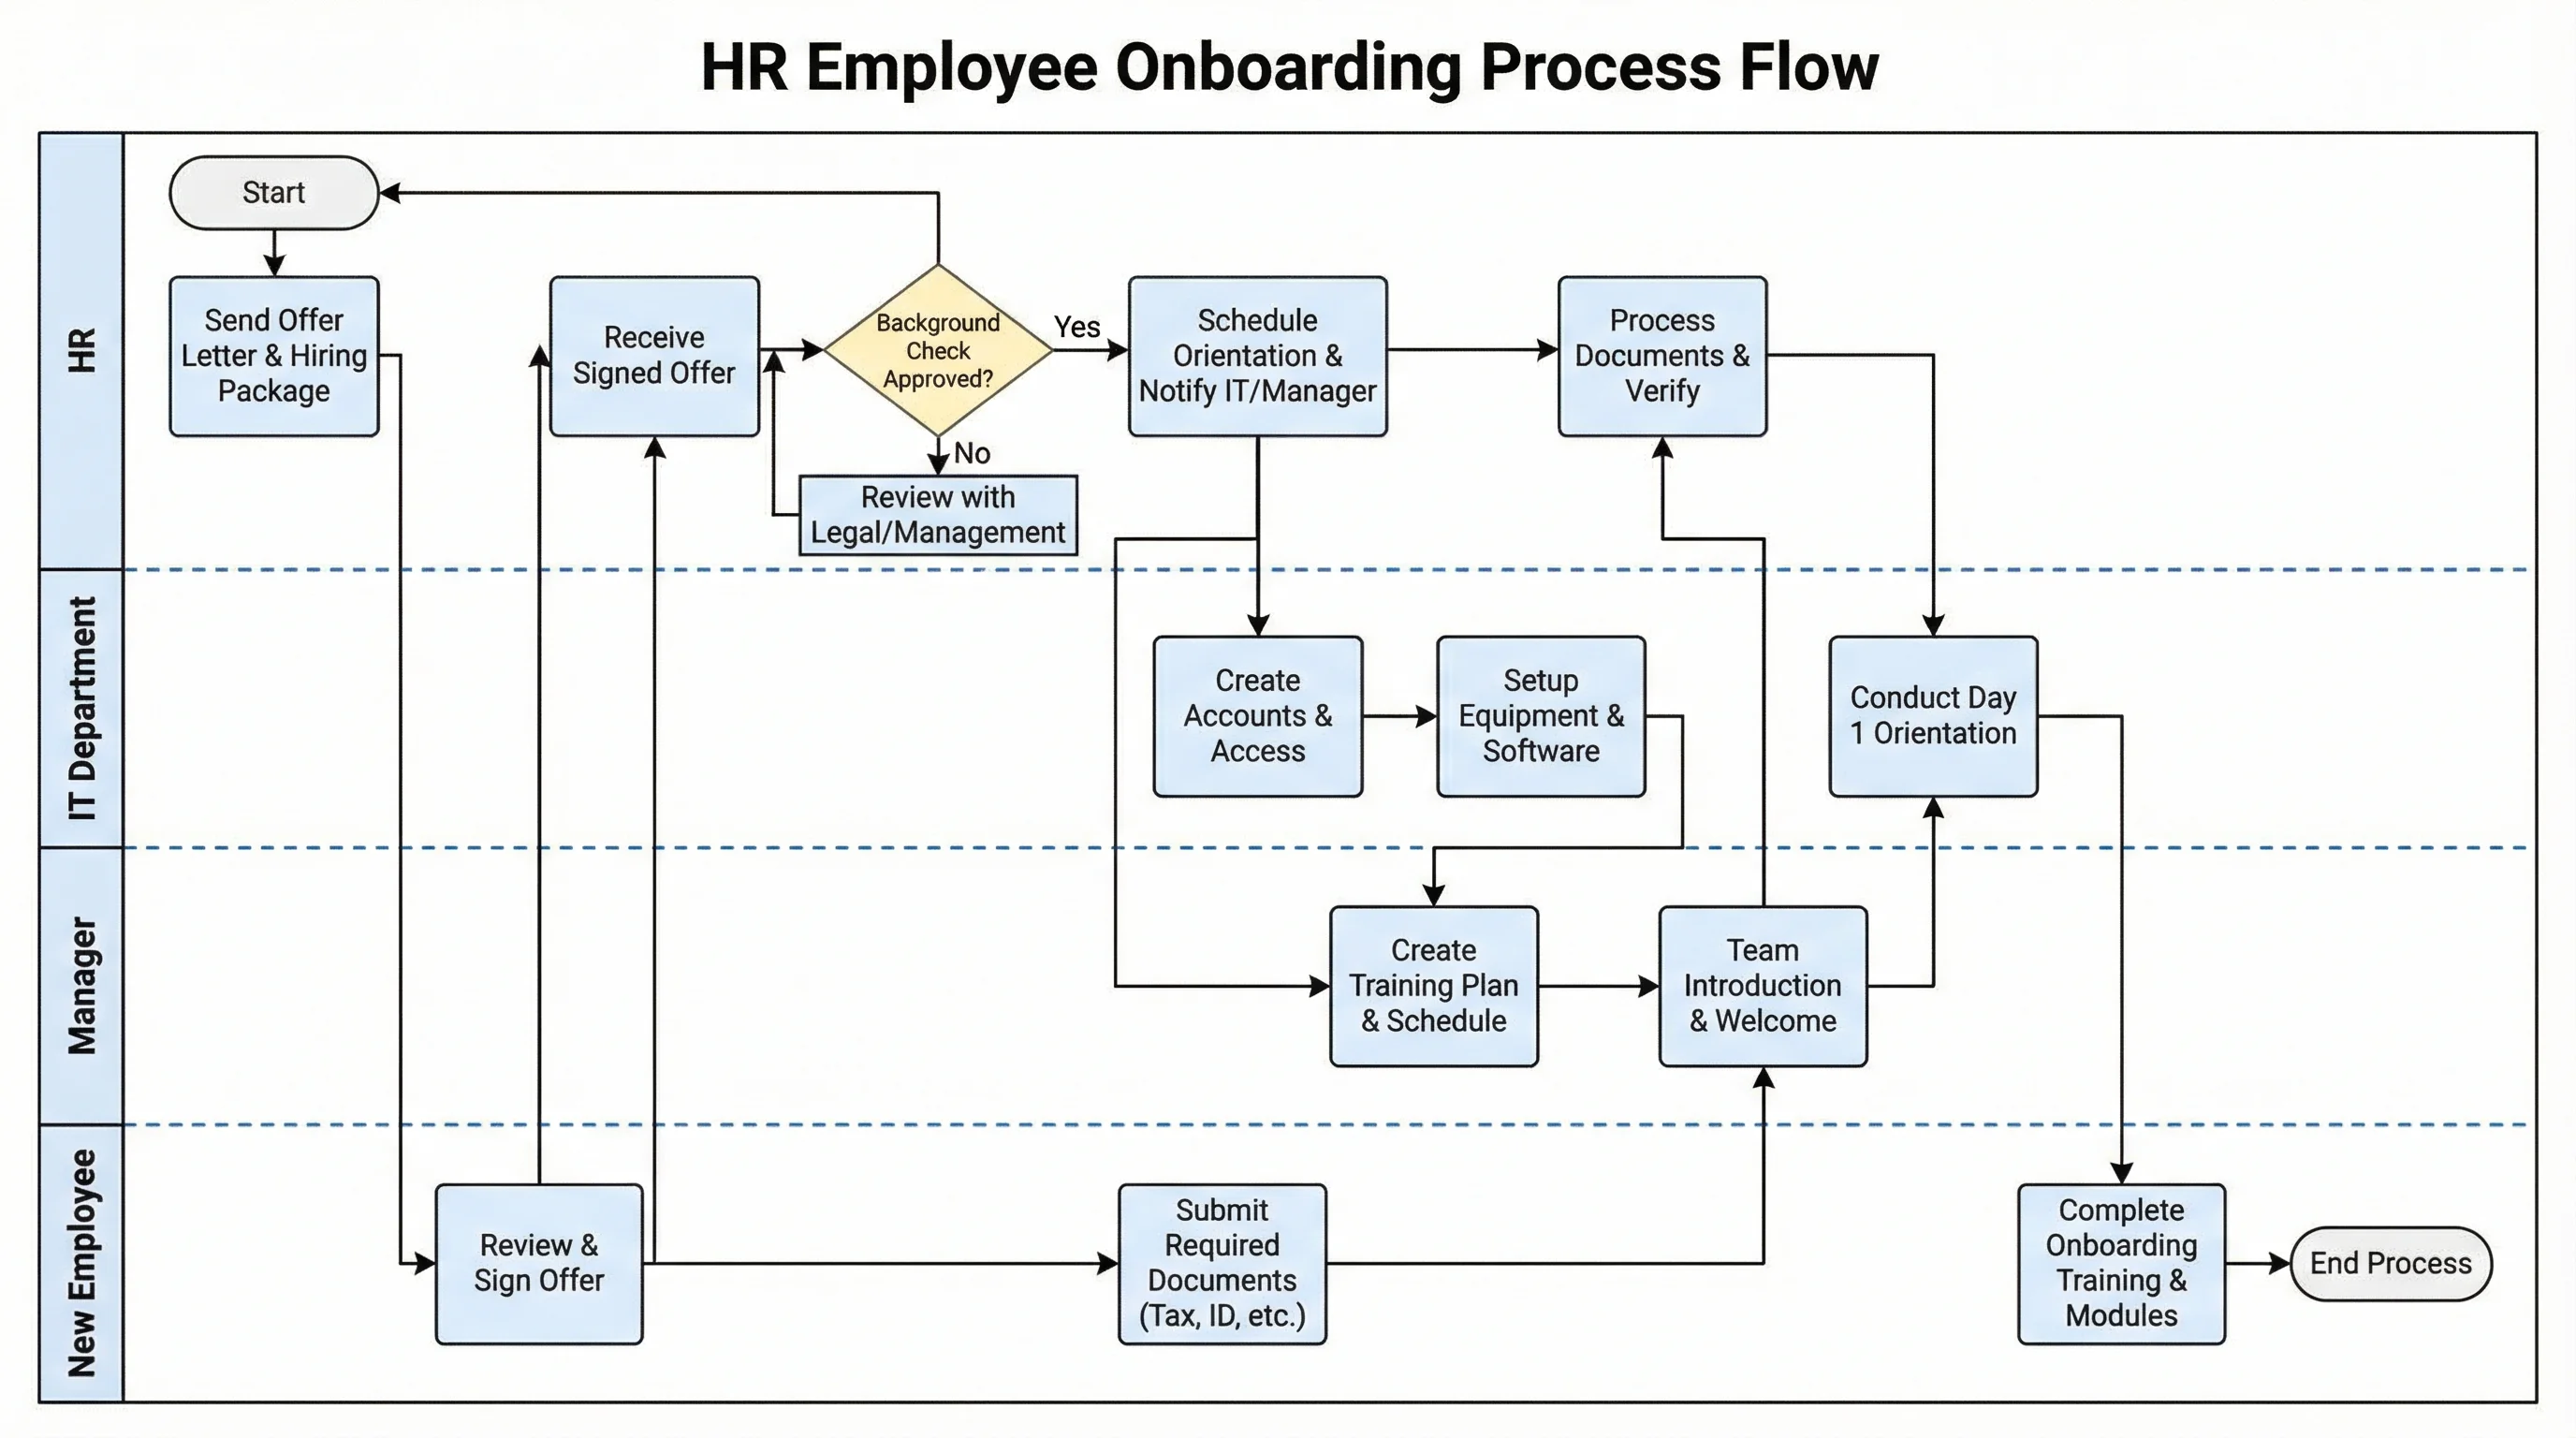
活动图中的泳道
泳道(也称为活动分区)将活动图分成垂直或水平的条带,每个条带代表一个负责的参与者、部门或系统组件。泳道能立即清楚地表明谁负责流程中的每个动作,这对于涉及多个团队或服务的跨职能工作流程而言非常宝贵。例如,订单处理图可以设置客户、订单系统、支付网关和仓库的泳道。动作被放置在负责方的泳道内,而跨越泳道边界的流向箭头表示参与者之间的交接。泳道将活动图从简单的流程图转变为强大的职责分配工具。
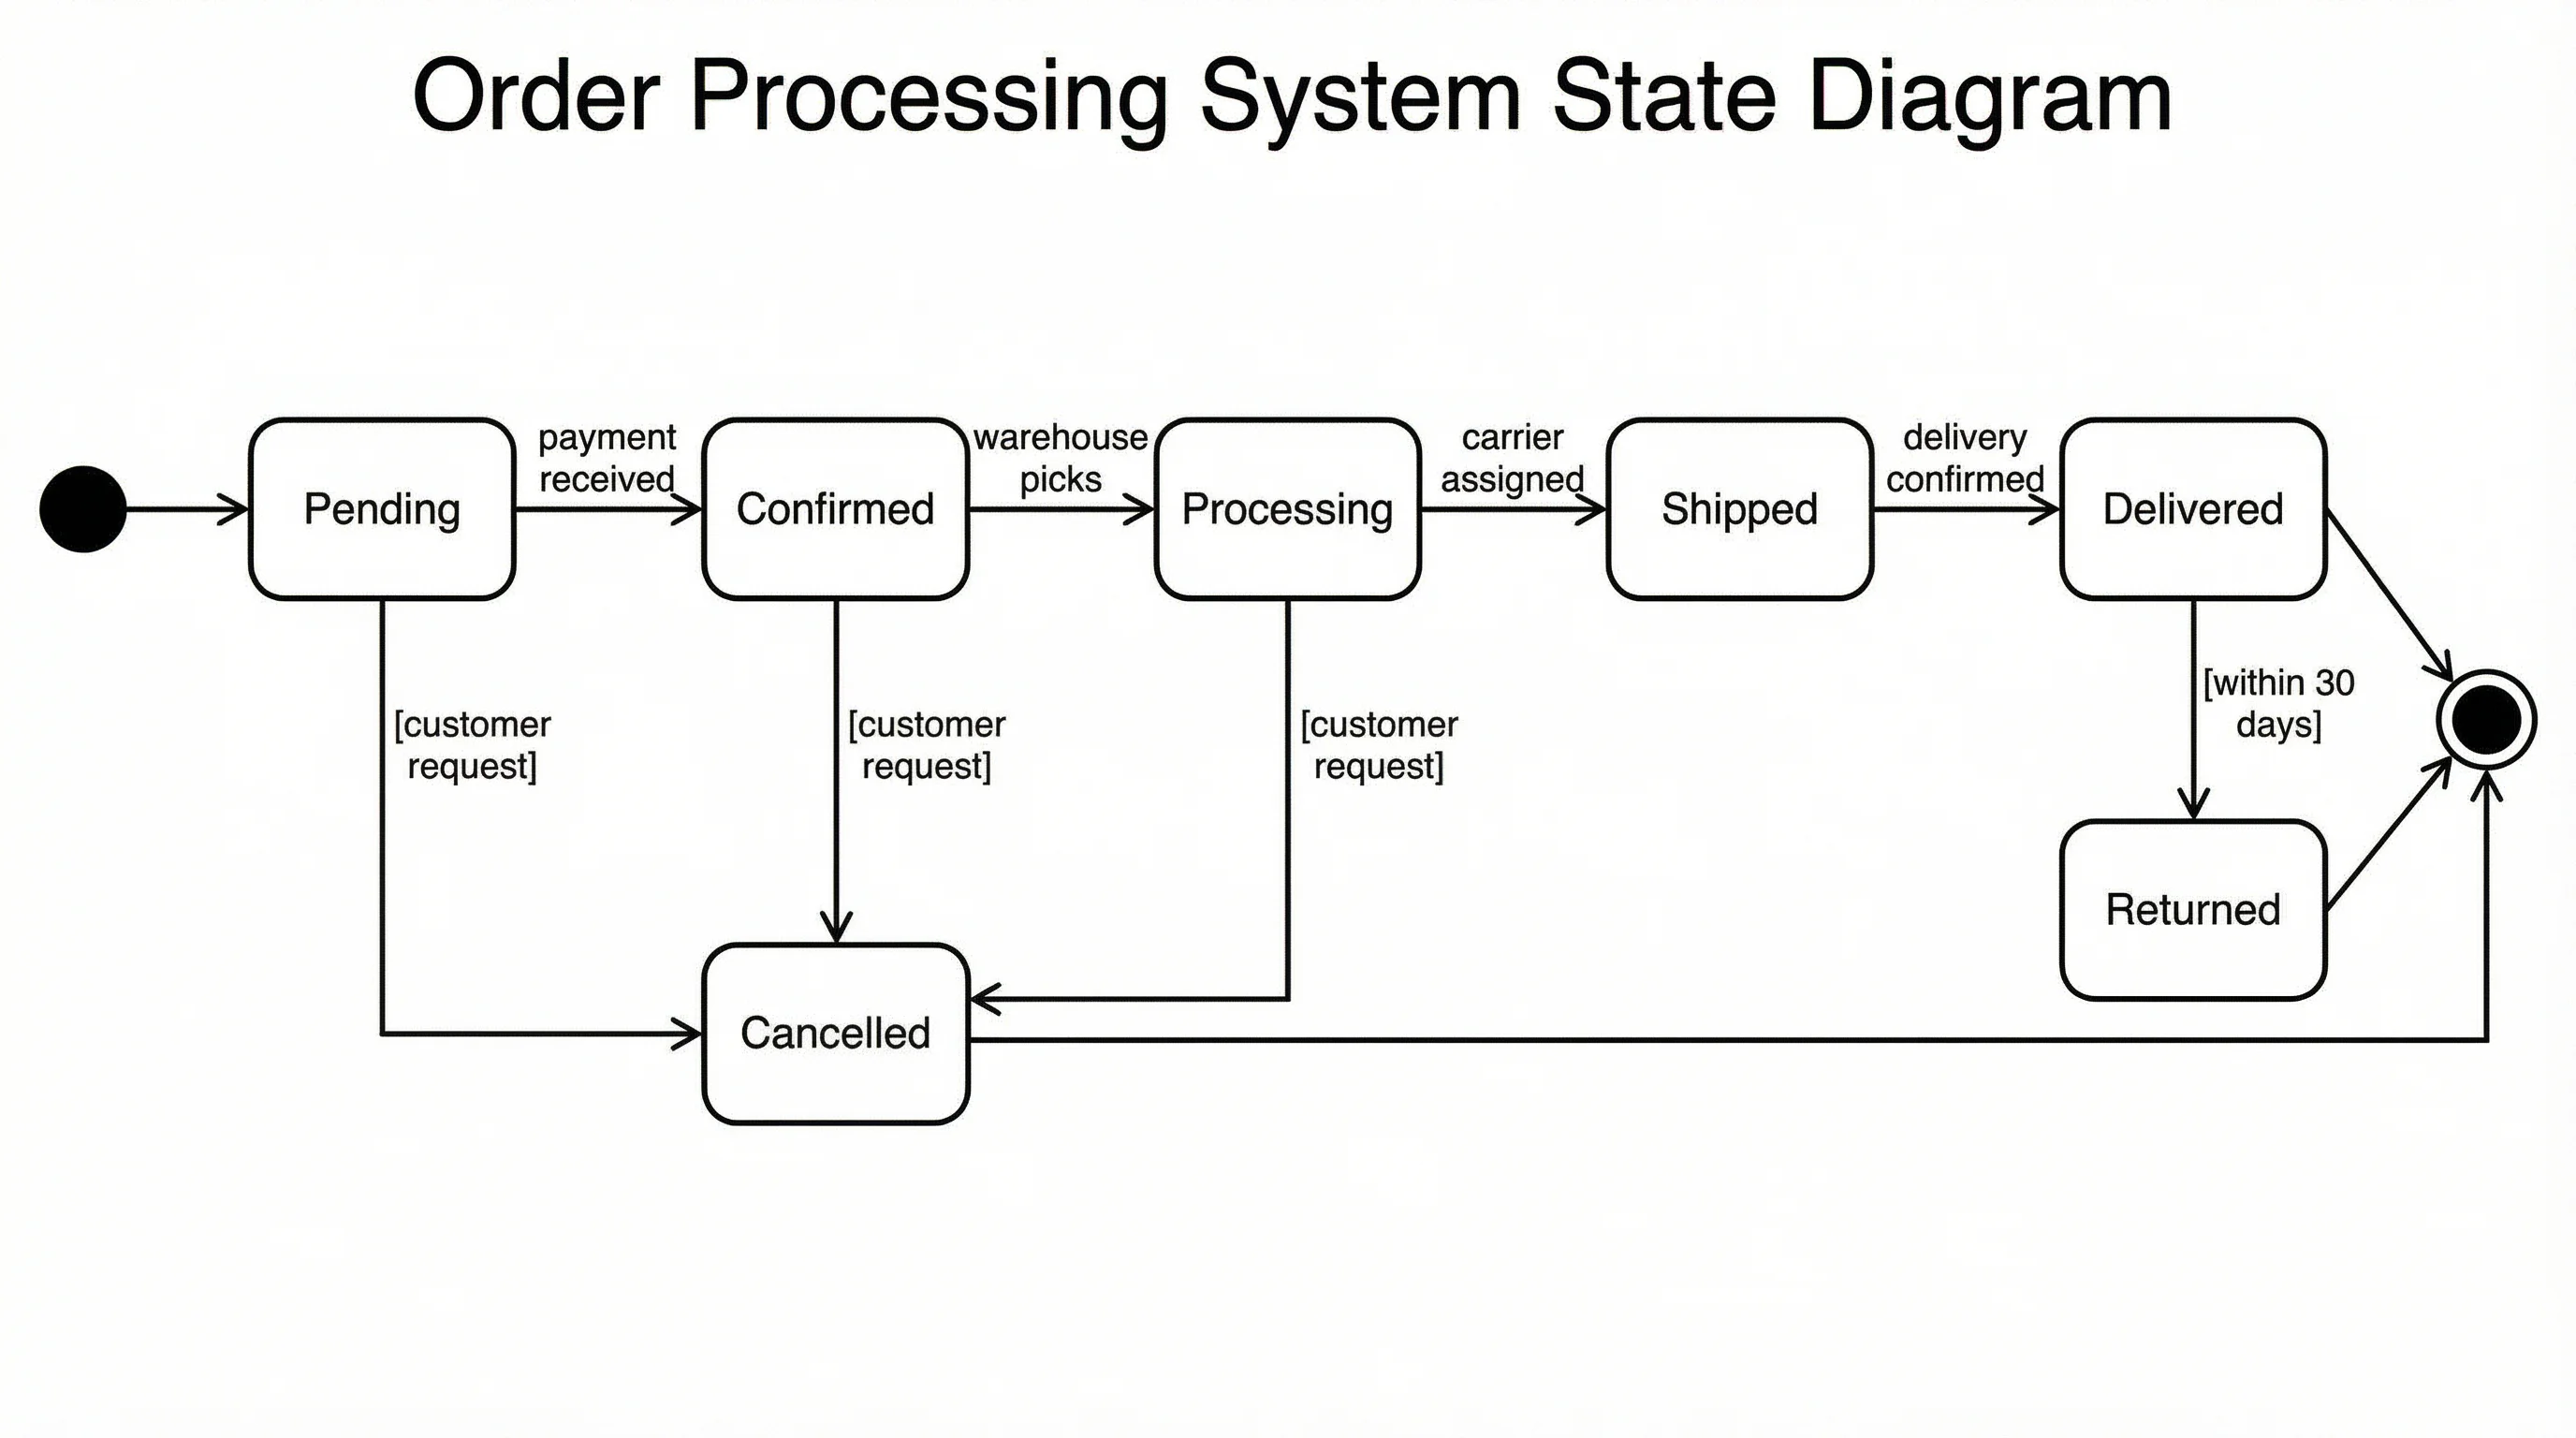
判断节点与守卫条件
判断节点是菱形元素,根据守卫条件将单个输入流分成两个或多个输出路径。守卫条件是放置在出边上的方括号内的布尔表达式(例如 [余额 >= 金额])。每个判断节点必须具有互斥且穷举的守卫条件,以确保恰好选择一条路径。合并节点将替代路径重新合并为单个流。复杂的工作流经常串联多个判断节点来建模嵌套的条件逻辑。我们的AI生成器会根据您的纯文本流程描述自动创建带有清晰标注守卫条件的判断-合并对。
分叉与汇合:并行活动
分叉和汇合栏(粗水平线或垂直线)在活动图中建模并发。分叉栏将一个输入流分成多个同时执行的并发输出流。汇合栏将多个并发流同步回单个流——只有当所有输入路径都完成后,执行才会继续通过汇合点。这种记法对于建模现实世界的并行处理至关重要,例如订单履行过程中同时进行的支付处理和库存检查,或CI/CD流水线中的并行测试阶段。正确使用分叉/汇合可以确保您的图准确地反映现代分布式系统和业务流程的并行特性。