Data Flow Diagram Generator for Context, Level 1 & Level 2 DFDs
Make a data flow diagram (DFD) online from a plain-English description. Generate context (Level 0), Level 1, and Level 2 diagrams with processes, external entities, data stores, and labeled data flows in standard DFD notation — free.
Data Flow Diagram Generator
Free to try ·
Your data flow diagram will appear here
Describe your system and click Generate
Data Flow Diagram Examples
Context, Level 1, and Level 2 DFDs across e-commerce, education, healthcare, and banking
Context Diagram (Level 0)
The whole system as one process, with every external entity and the data that flows in and out.
Level 1 E-commerce DFD
The context diagram exploded into numbered processes (1.0, 2.0…) with data stores for orders and products.
Library Management DFD
A classic systems-analysis example: catalog, lending, members, and fines as separate processes.
Student Registration DFD
Registration, course scheduling, grading, and transcripts, each reading and writing its own data store.
Healthcare Patient DFD
Patient management modeled end to end — registration, appointments, diagnosis, and billing.
Level 2 Banking DFD
A Level 2 decomposition: one process broken into numbered sub-processes (2.1, 2.2…) for more detail.
What is a data flow diagram (DFD)?
A data flow diagram (DFD) is a graphical model of how information moves through a system. Instead of showing control logic or timing like a flowchart, a DFD answers a different question: where does data come from, what transforms it, where is it stored, and where does it go? Each arrow is a named piece of data in motion, and each process is a step that changes that data. Because it focuses purely on data rather than implementation, a DFD works as a shared map that analysts, developers, and stakeholders can all read. This generator turns a plain-English description of your system into a clean DFD using standard notation, so you do not have to place and align boxes by hand.
The 4 elements of a data flow diagram
- External entities: the people, systems, or organizations that sit outside your system and send or receive data — drawn as squares or rectangles (e.g. Customer, Payment Gateway, Supplier).
- Processes: the steps that transform incoming data into outgoing data — drawn as circles or rounded rectangles and numbered (1.0, 2.0…) so they can be decomposed later.
- Data stores: where data rests between processes, such as a database, file, or table — drawn as open-ended rectangles labeled D1, D2, and so on.
- Data flows: the labeled arrows that connect everything, naming the exact data that moves (e.g. Order Details, Payment Authorization, Stock Level).
DFD notation: Yourdon/DeMarco vs Gane-Sarson
There are two common notations for data flow diagrams. The Yourdon and DeMarco notation draws processes as circles (sometimes called bubbles), external entities as squares, and data stores as a pair of parallel lines. The Gane-Sarson notation, popular in business and structured-analysis settings, draws processes as rounded rectangles with a header for the process number, and data stores as open-ended rectangles. Both use labeled arrows for data flows and follow the same leveling rules — the difference is purely in the shapes. This tool produces clean, standard DFD shapes so the diagram reads correctly whichever convention your course or team expects.
DFD levels: context (Level 0), Level 1, and Level 2
- Context diagram (Level 0): the entire system shown as a single process in the center, surrounded by external entities and the high-level data flows between them. It defines the system boundary and contains no data stores.
- Level 1 DFD: the single process from the context diagram is "exploded" into its main sub-processes (numbered 1.0, 2.0, 3.0…), now showing the data stores and the flows between processes.
- Level 2 DFD: a single Level 1 process is decomposed further into detailed sub-processes (numbered 2.1, 2.2, 2.3…) when it is too complex to explain in one step.
- The golden rule is balancing: the data flowing in and out of a process must match across levels, so a Level 1 diagram is a faithful zoom-in of the context diagram, and Level 2 a faithful zoom-in of Level 1.
How to make a data flow diagram from a description
- Describe your system in plain English — name the processes that transform data, the data stores involved, and the external entities that interact with it.
- Pick the level you need: a context (Level 0) diagram for the big picture, or a Level 1 / Level 2 diagram for more internal detail.
- Generate the diagram. The tool lays out the processes, entities, data stores, and labeled data flows using standard DFD notation.
- Refine the prompt if a flow or store is missing, regenerate, then download the diagram to drop into a report, slide, or design document.
Using DFDs in systems analysis and design
Data flow diagrams are a core deliverable in structured systems analysis. Early in a project they help capture requirements by forcing every input, output, and data store into the open, which surfaces gaps and assumptions before any code is written. They double as documentation that non-technical stakeholders can validate, and as a blueprint that maps cleanly onto modules, services, and database tables during design. Students meet DFDs in software engineering, information systems, and database courses precisely because they teach you to separate what a system does with data from how it is built. Whether you are documenting an existing process, scoping a new application, or studying for an exam, this generator gives you a presentation-ready DFD in seconds.
Frequently Asked Questions
Related Diagram Tools
 Diagrams
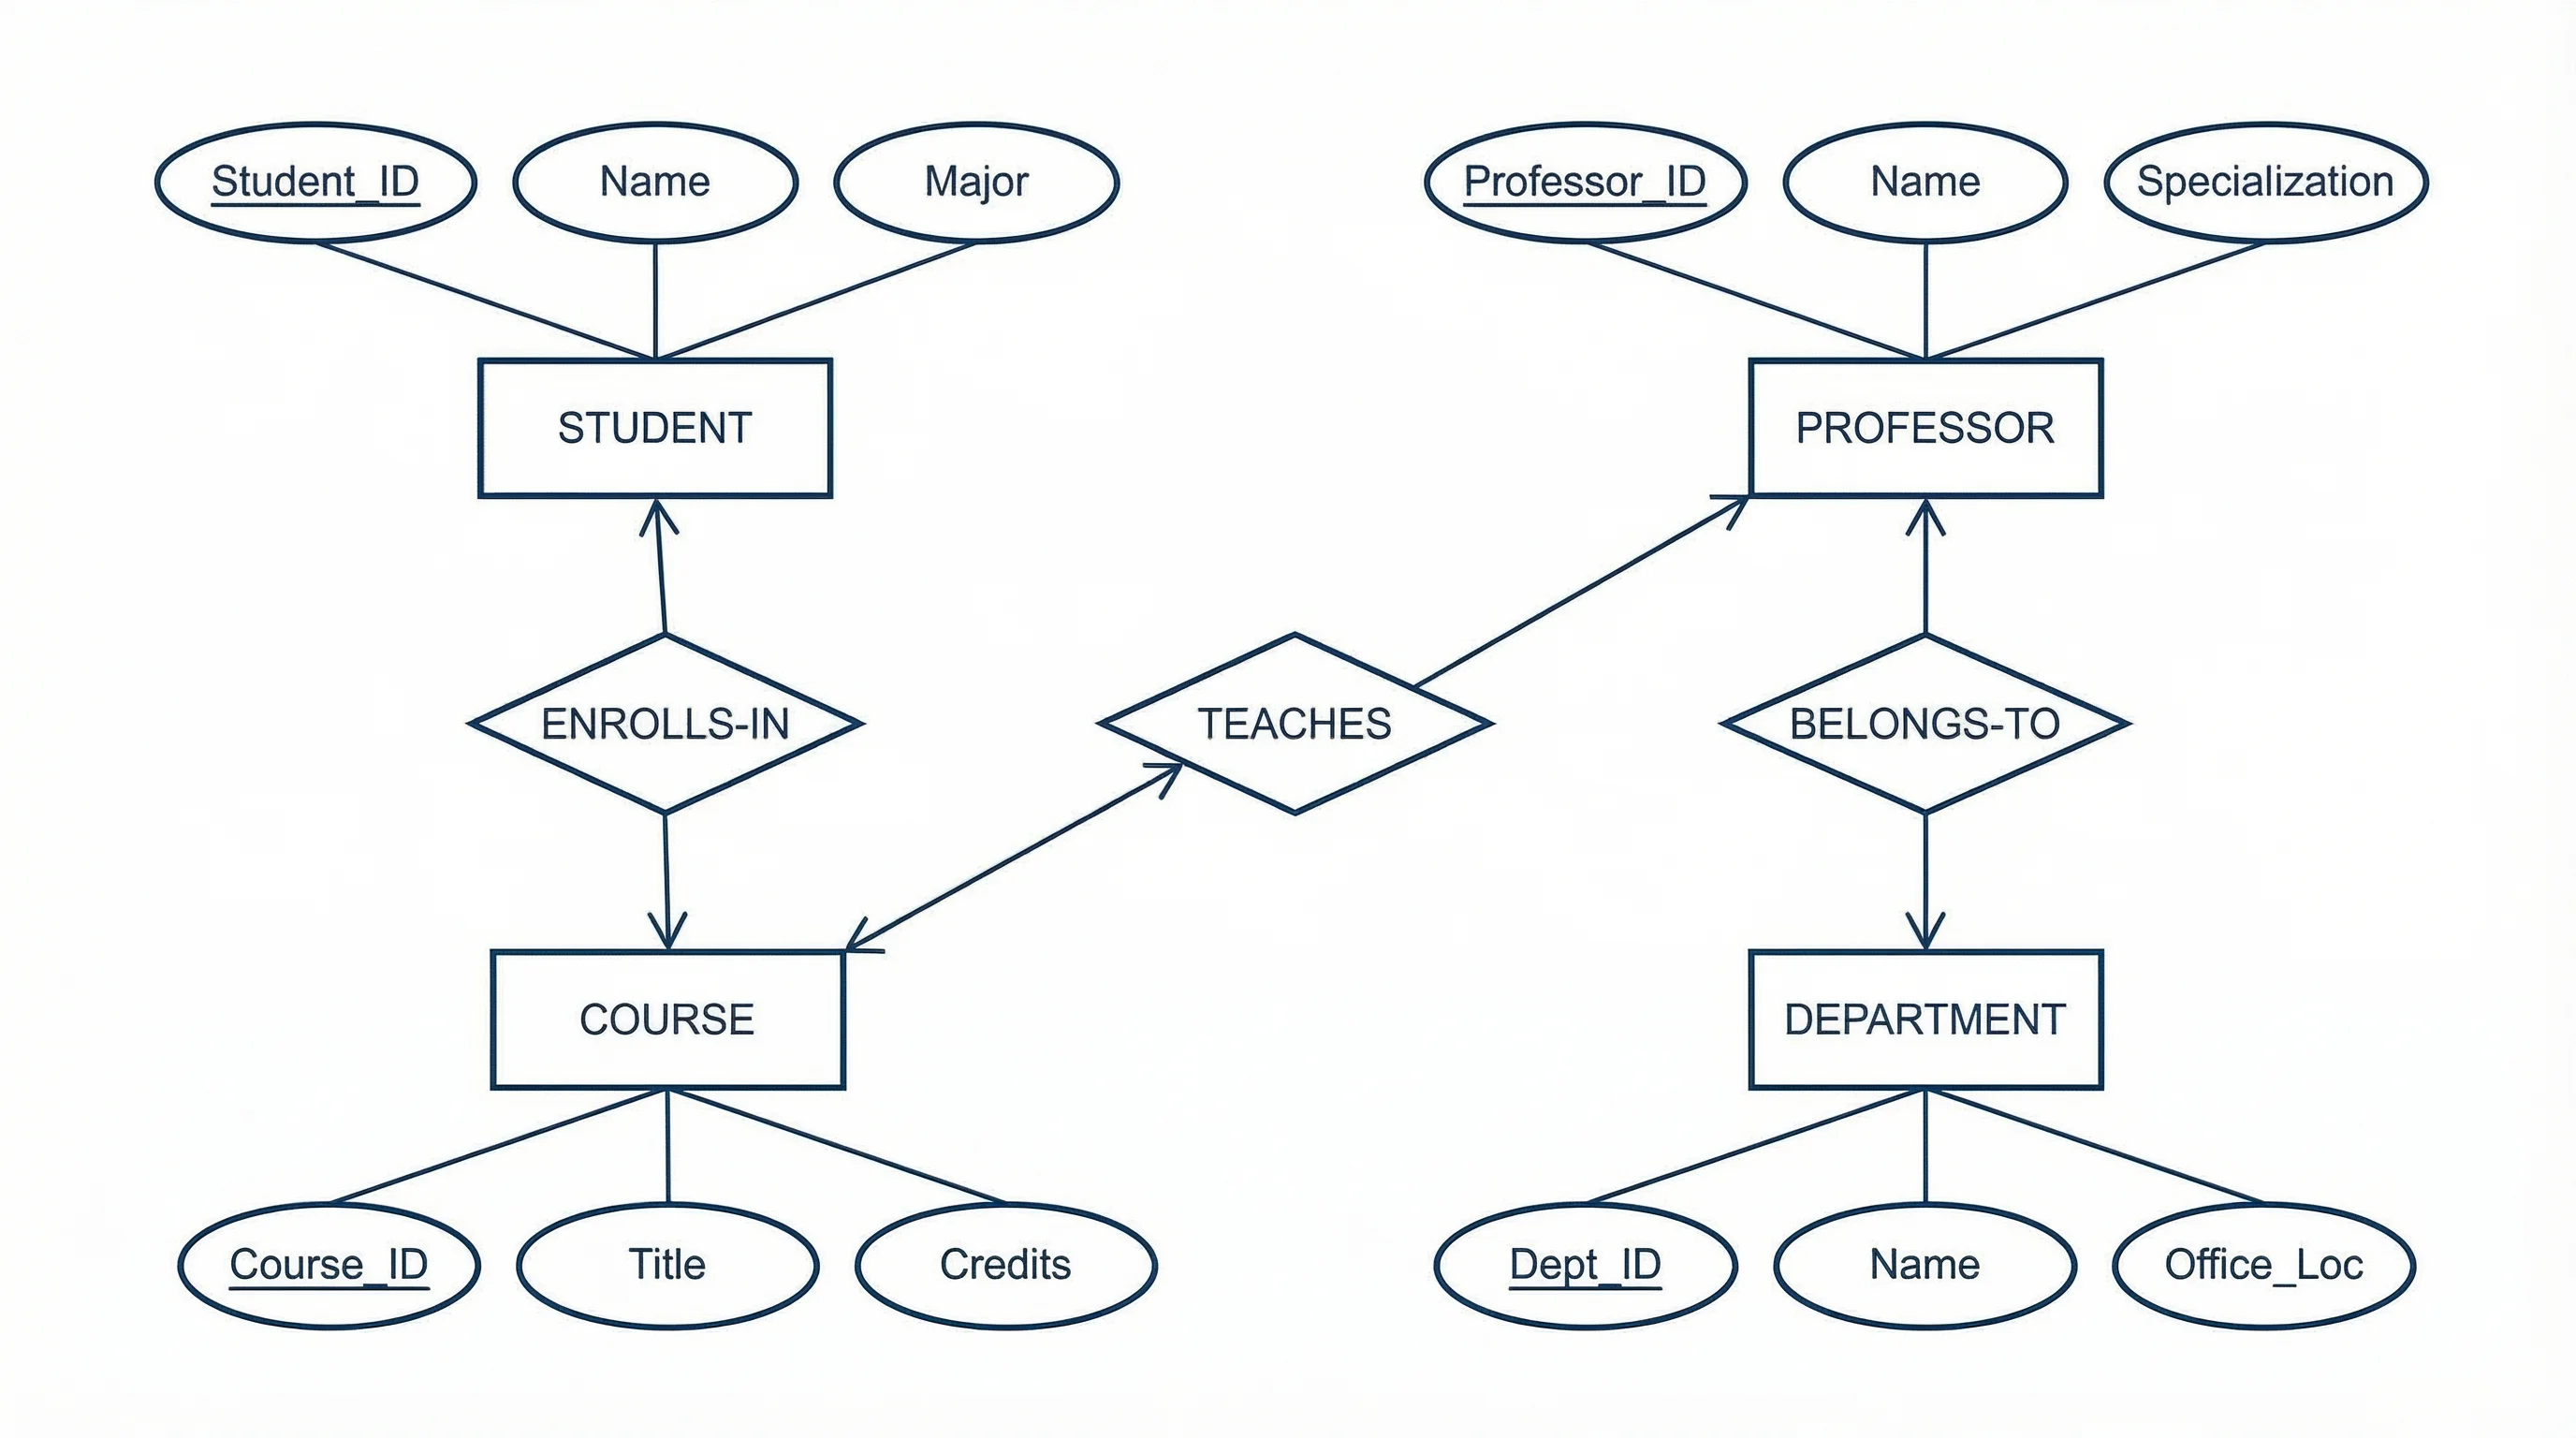
ER Diagram Generator
Model the data stores behind your DFD as entities, attributes, and relationships in an ER diagram.
 Diagrams
Block Diagram Generator
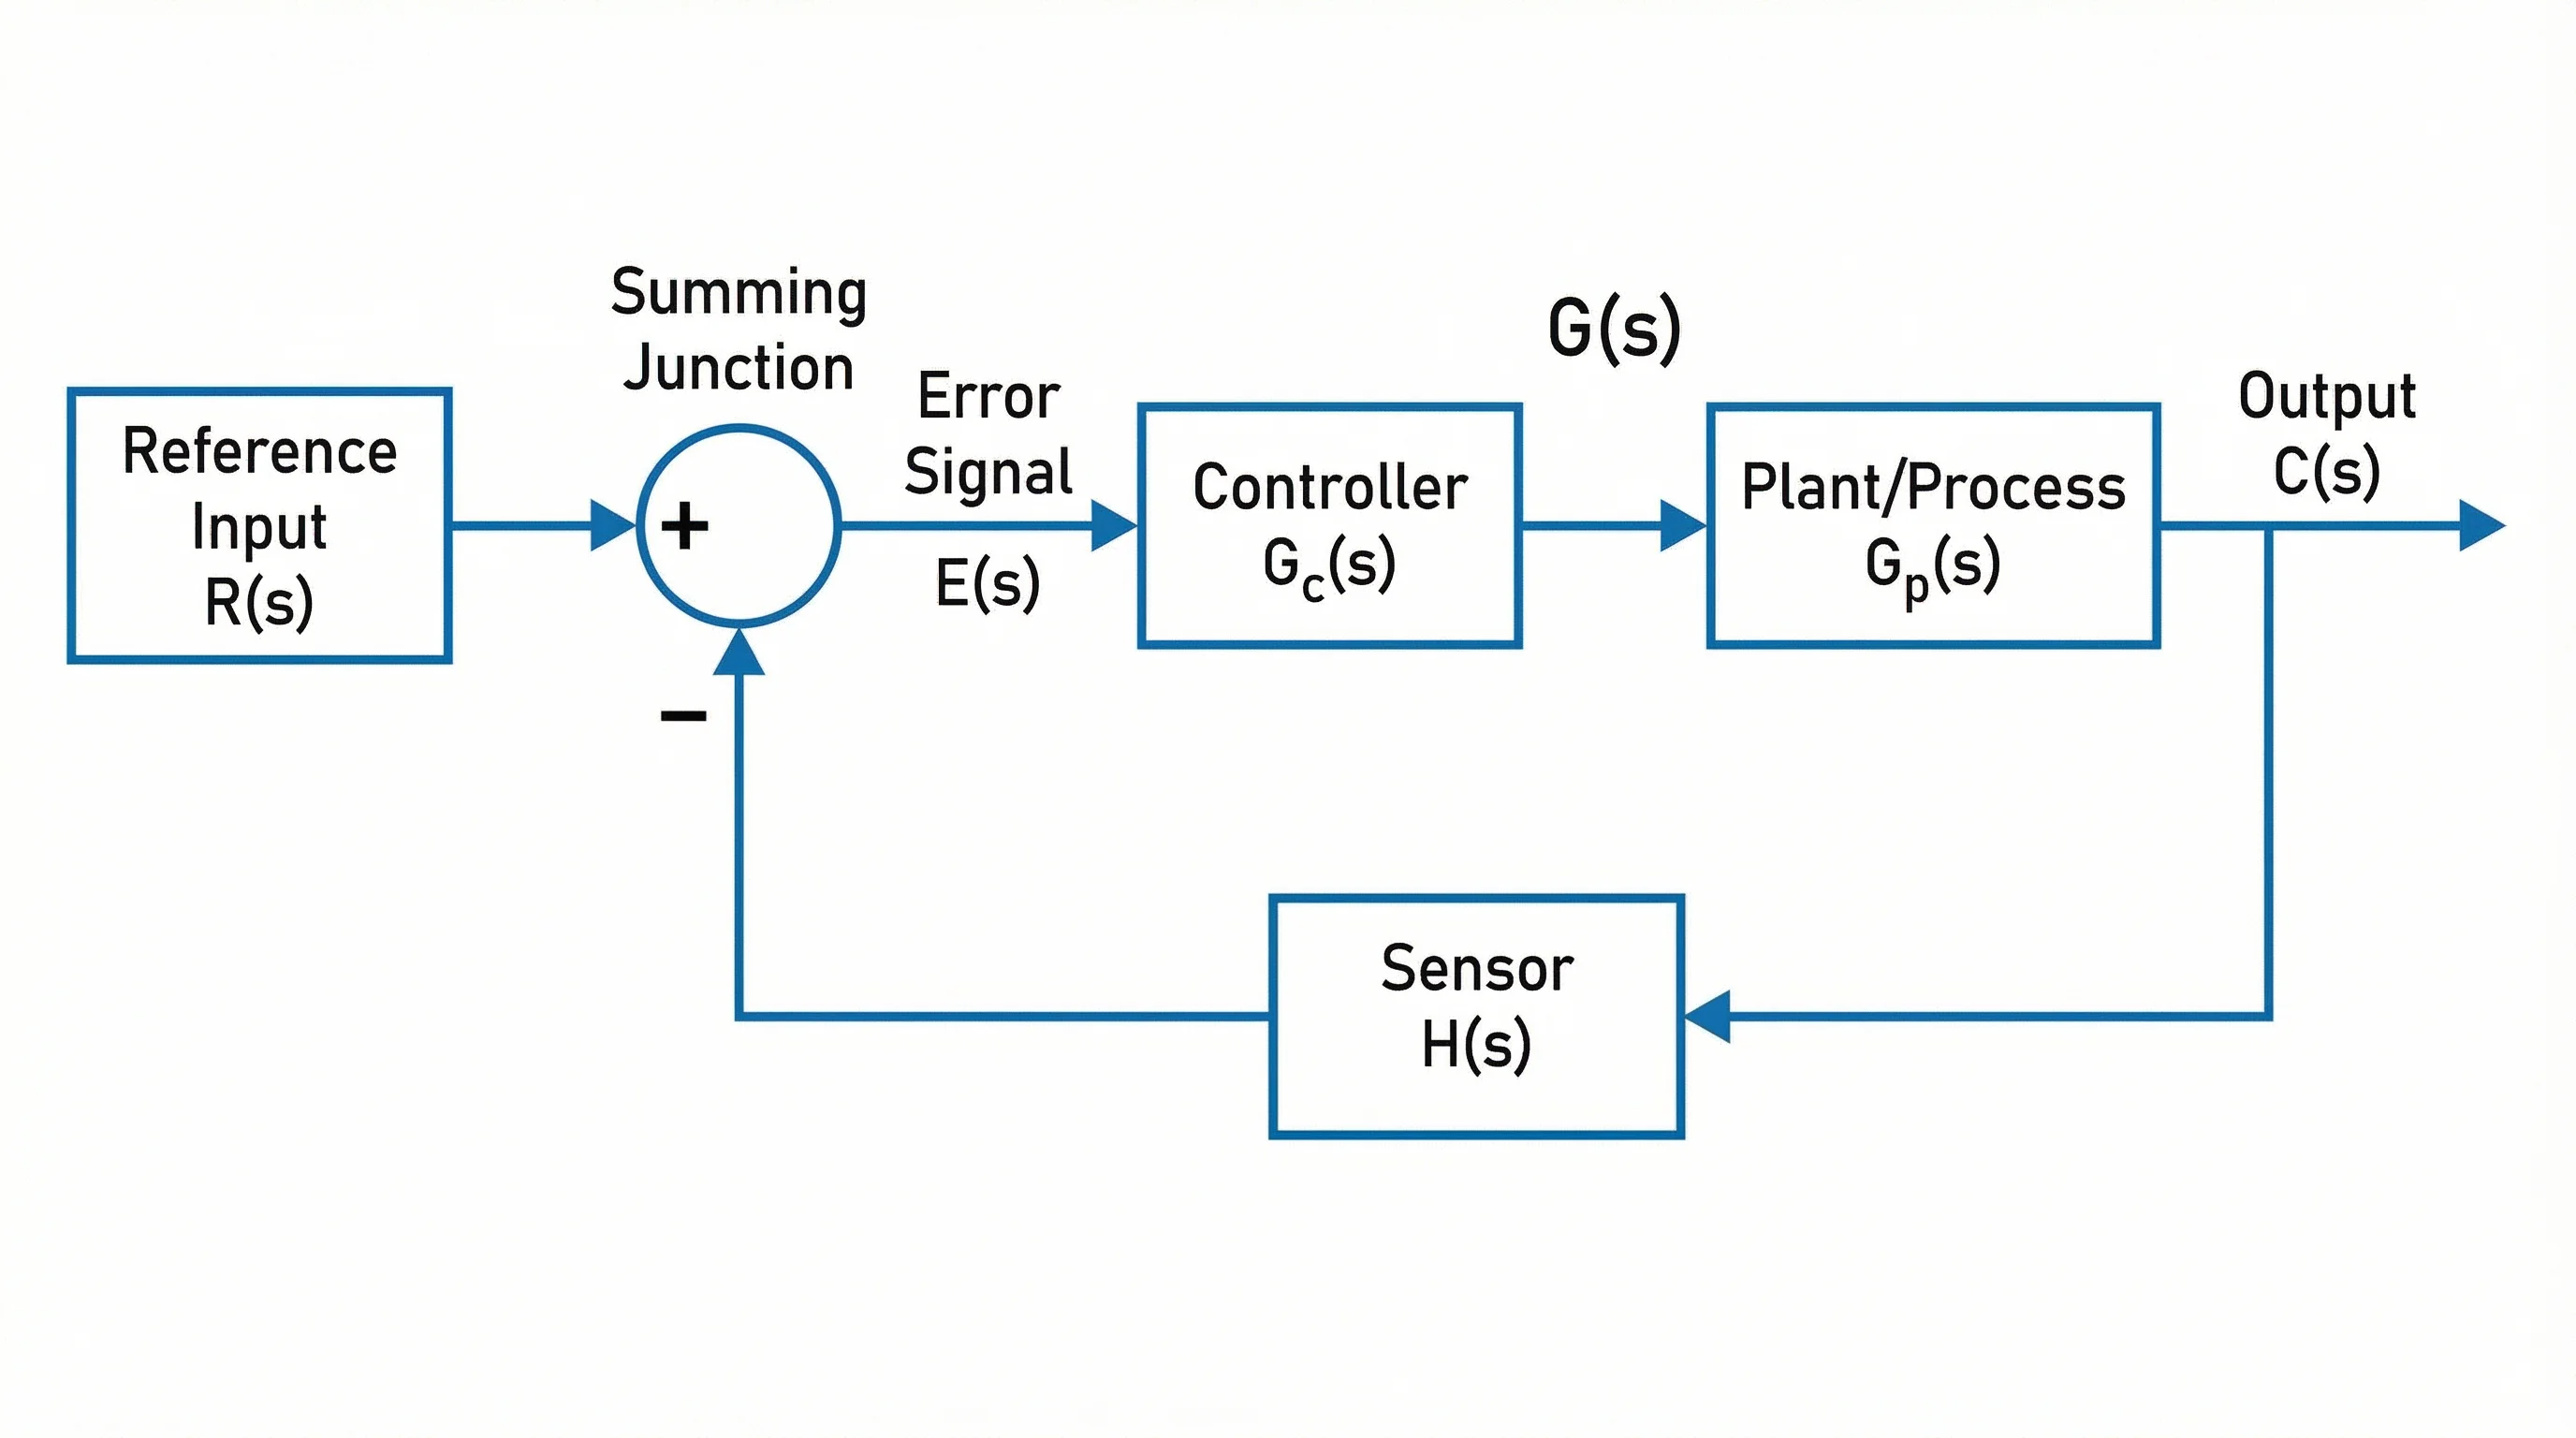
Create labeled block diagrams to show system components and how they connect at a high level.
 Diagrams
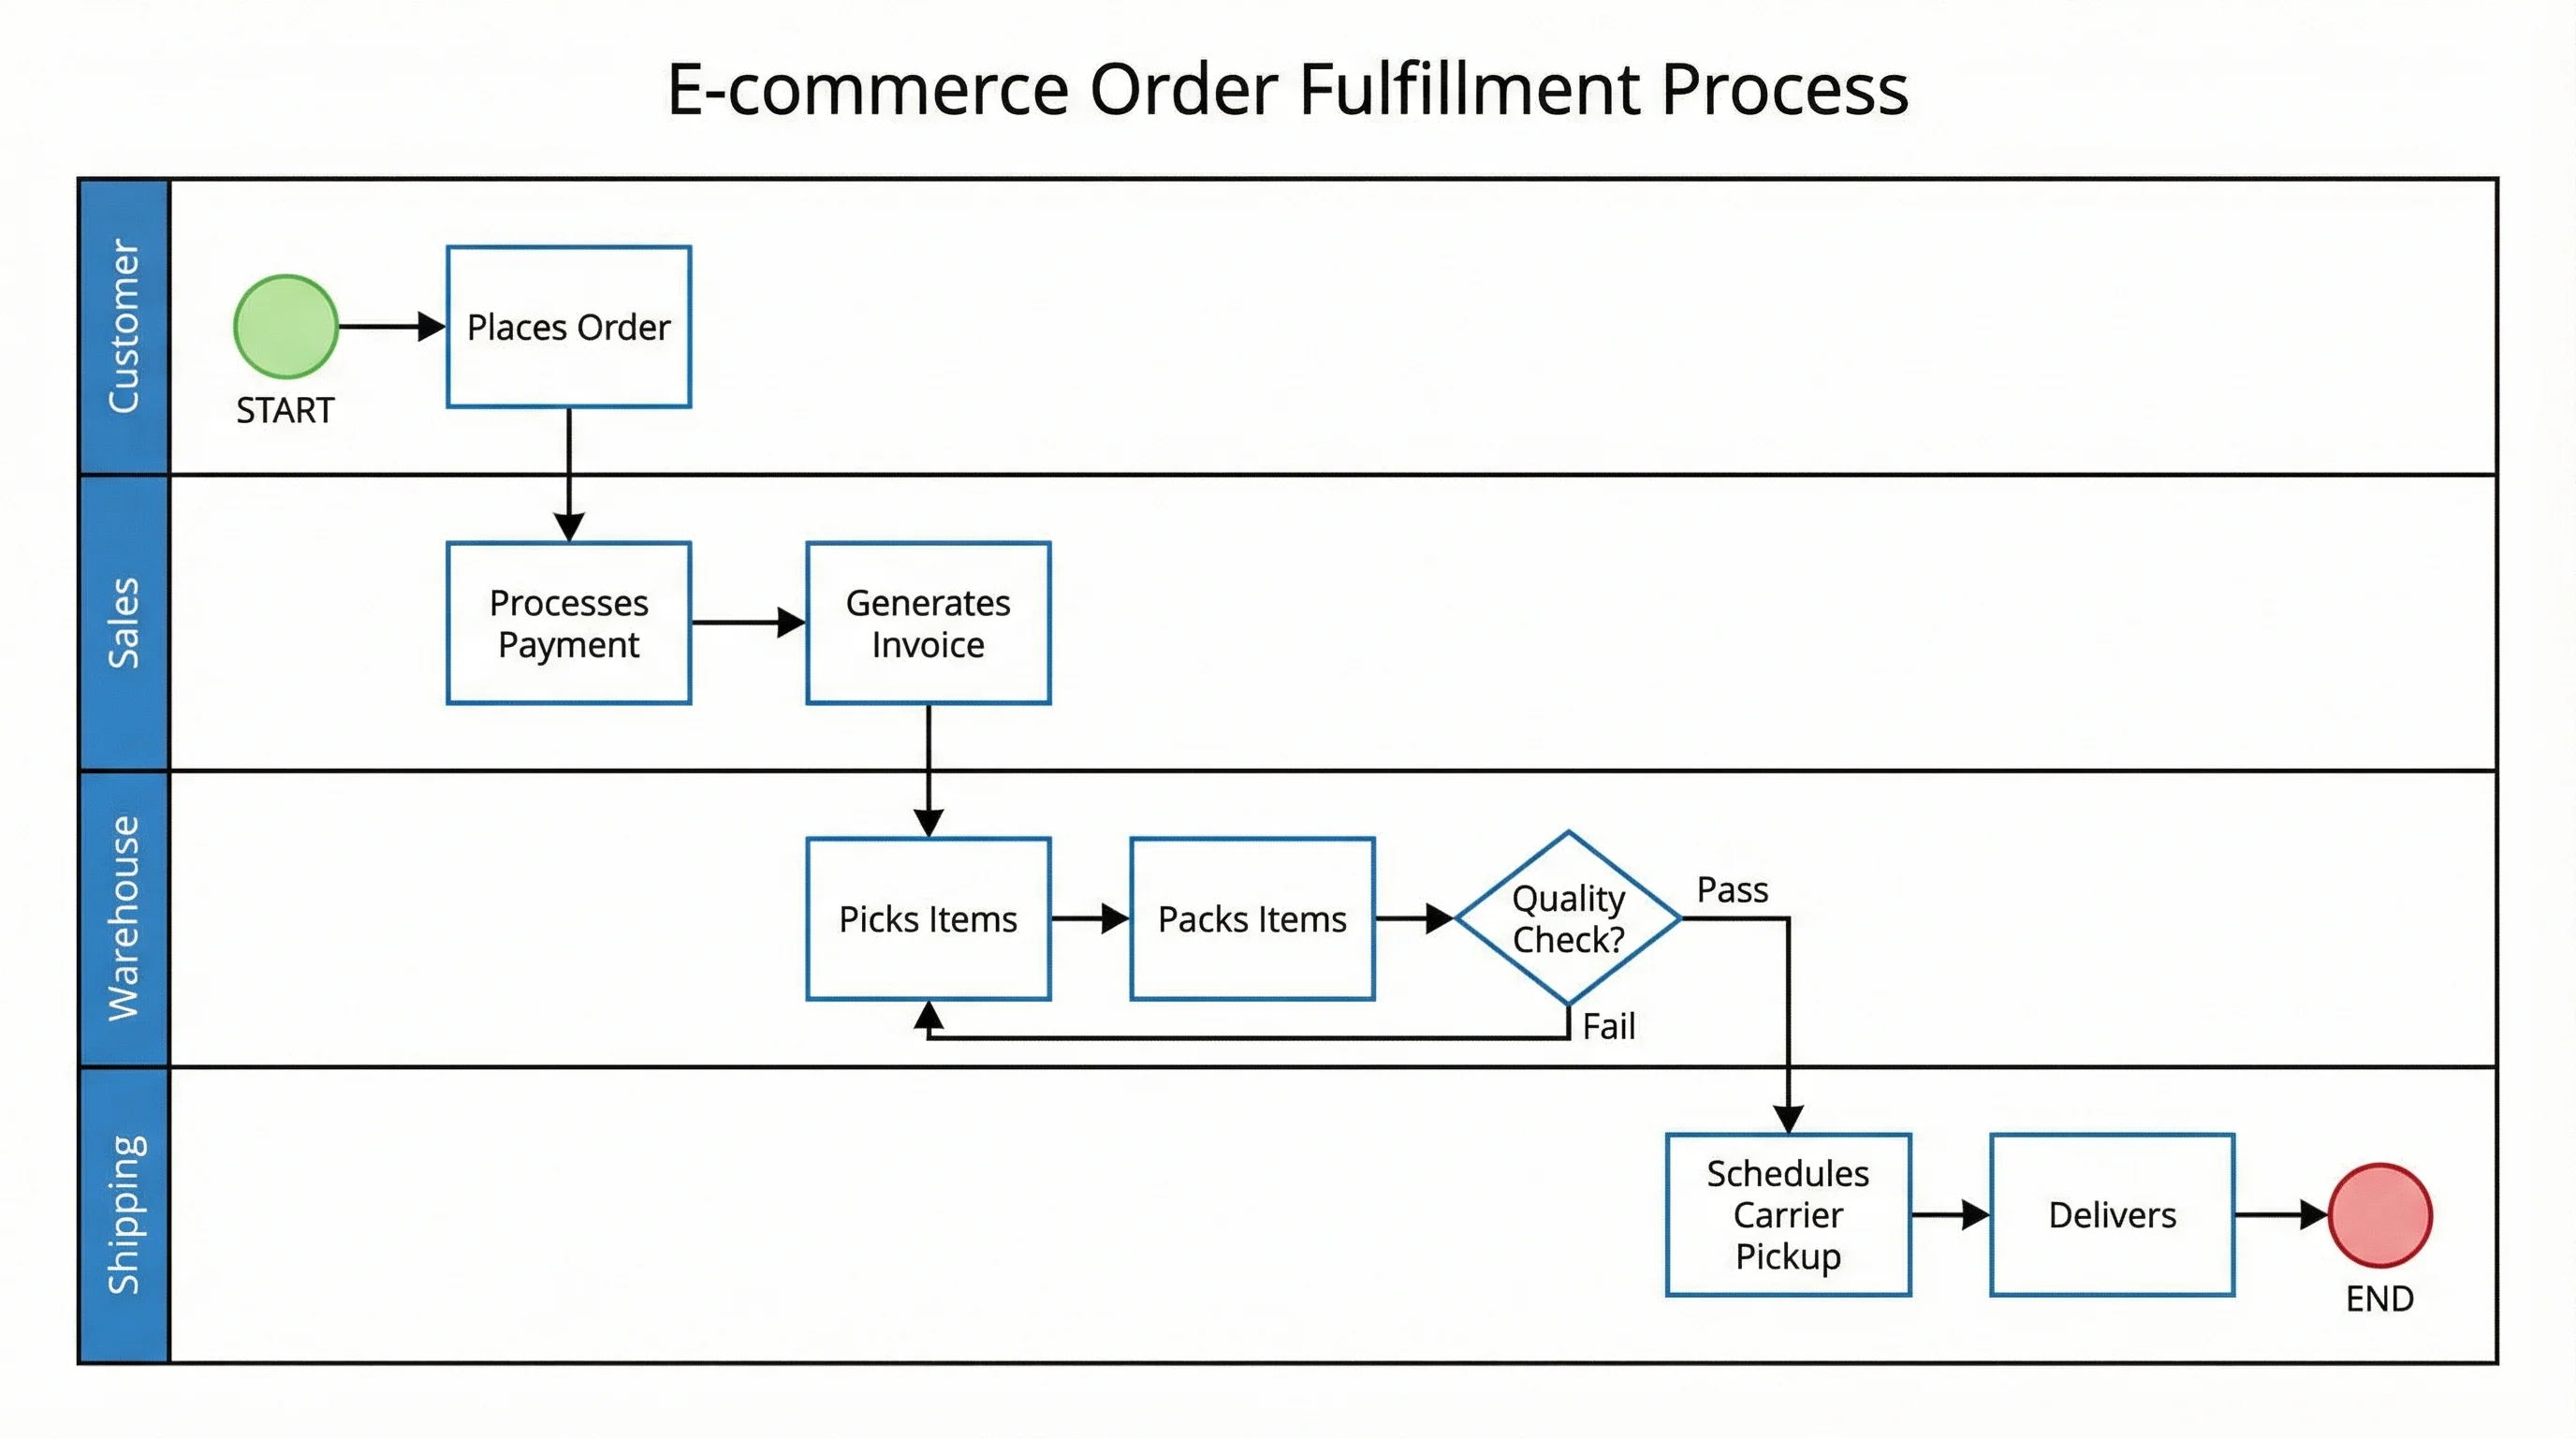
Swimlane Diagram Generator
Map processes across roles and departments with swimlanes when responsibility matters.