State Diagram Generator for UML State Machines
Turn a plain-English description into a UML state machine diagram with clearly labeled states, transitions, events, and initial and final states. Generate state transition diagrams for software, embedded systems, and workflows, then export them, free.
Generate State Diagram
Free to try ·
Your state diagram will appear here
Describe your states and transitions above
State Diagram Examples
UML state machine and transition diagrams for software, embedded systems, and workflows
Order Processing State Machine
A business workflow as a state machine — each order status is a state, and every status change is a labeled transition with guard conditions.
User Authentication States
A login flow modeled as states and transitions, including lockout after failed attempts and session timeout.
Traffic Light Controller
A classic embedded controller — cyclic timed transitions with a composite pedestrian-crossing state and an emergency override.
Elevator System States
A safety-critical system with entry actions, guard conditions, and an emergency stop reachable from any state.
TCP Connection States
A network protocol as a finite state machine — every transition is labeled with the event and the action it triggers.
Vending Machine States
A finite-state machine with a self-loop, guard conditions on the total, and internal actions that update a running variable.
What is a state diagram?
A state diagram — also called a UML state machine diagram — shows how a system moves between a finite set of states in response to events. Each rounded rectangle is a state the system can be in, and each arrow is a transition triggered by an event. It is the clearest way to model anything with distinct modes and rules for moving between them: an order that is Pending or Shipped, a connection that is Open or Closed, a device that is Idle or Running. This generator draws that behavior for you, with every state and transition placed and labeled.
States, transitions, events, and initial and final states
- States: the distinct conditions a system can be in, drawn as rounded rectangles (for example, Idle, Processing, Shipped).
- Transitions: the arrows between states, showing a valid change from one state to another.
- Events: the trigger that fires a transition, written on the arrow (such as "payment received" or "timer expires").
- Guards and actions: a guard is a condition in brackets that must be true for the transition to fire; an action is work done during the transition.
- Initial state: a filled black circle marking where the machine starts.
- Final state: a circled dot marking where the machine ends, when the behavior has a clear completion.
State diagram vs. state transition diagram vs. flowchart
A state diagram and a state transition diagram are the same thing — both show states connected by event-driven transitions, and people use the names interchangeably. The key difference from a flowchart is the focus: a flowchart traces the steps of a process from start to finish, while a state machine diagram captures the modes a system rests in and the events that move it between them. Use a state transition diagram whenever the question is "what state is it in now, and what can happen next?" rather than "what is the next step?"
When to use a state machine diagram
- Software design: model object lifecycles, UI screens, session and authentication flows, or any feature with clear modes and rules.
- Embedded and hardware systems: capture controllers such as traffic lights, elevators, vending machines, and motors, where behavior depends on the current state.
- Network protocols: document handshake and teardown sequences like TCP connection states, where each transition is an event-and-action pair.
- Business workflows: show an order, ticket, or approval moving through its statuses, including the conditions for each change.
- Specification and testing: a state diagram doubles as a checklist — every state and transition is a behavior to build and a path to test.
How to generate a state diagram from a description
- Describe your system in plain English: name the states it can be in and what causes it to move between them.
- Add the details that matter — events on each transition, guard conditions, and any entry or exit actions.
- Generate the diagram and the tool lays out the states, draws the transition arrows, and adds the initial and final states for you.
- Refine the wording or add states by editing your description, then export the finished state transition diagram to drop into docs, slides, or a spec.
Tips for a clear state transition diagram
Keep states to the genuinely distinct modes of the system — if two "states" always behave the same way, they are one state. Label every transition with the event that triggers it so the diagram reads as cause and effect, and put any condition in a guard rather than inventing extra states. Use a single initial state, and add a final state only when the behavior truly ends. When a machine gets large, group related states into a composite (nested) state to keep the top level readable. Following these conventions keeps the diagram a true UML state machine that other engineers can pick up at a glance.
Frequently Asked Questions
Related Diagram Tools
 Diagrams
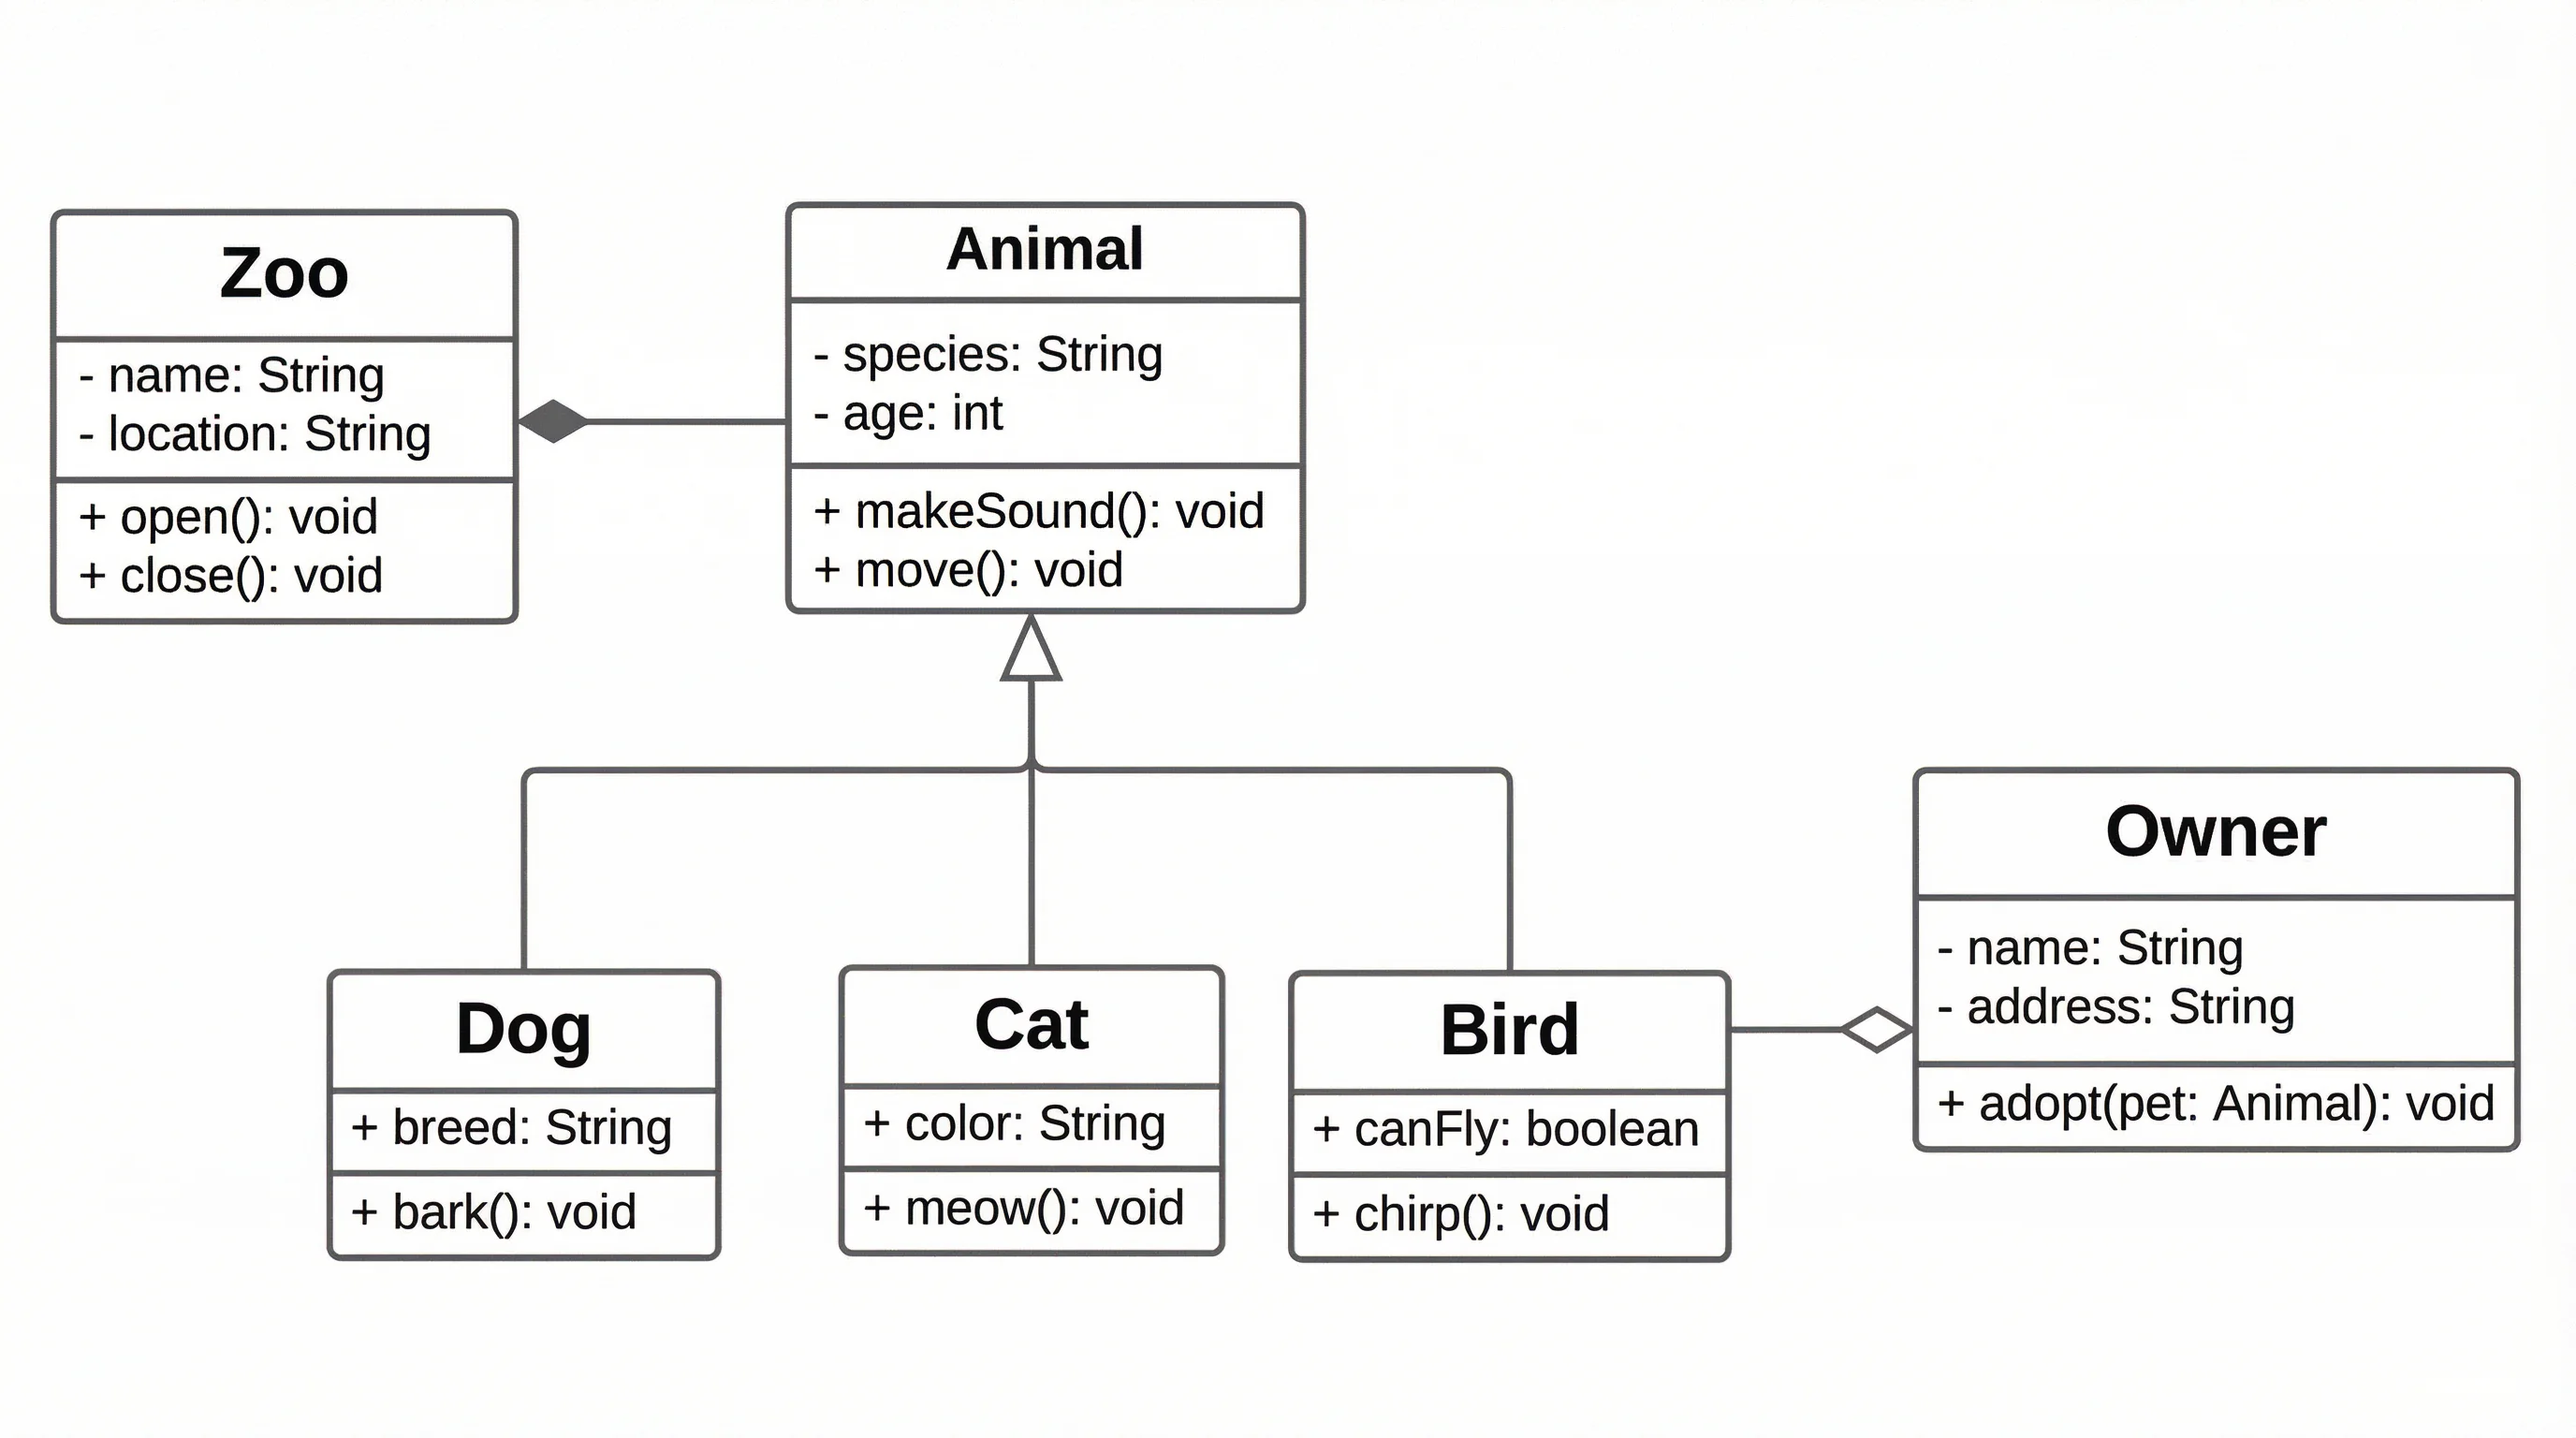
UML Diagram Generator
Create UML class, sequence, activity, and component diagrams from a description.
 Diagrams
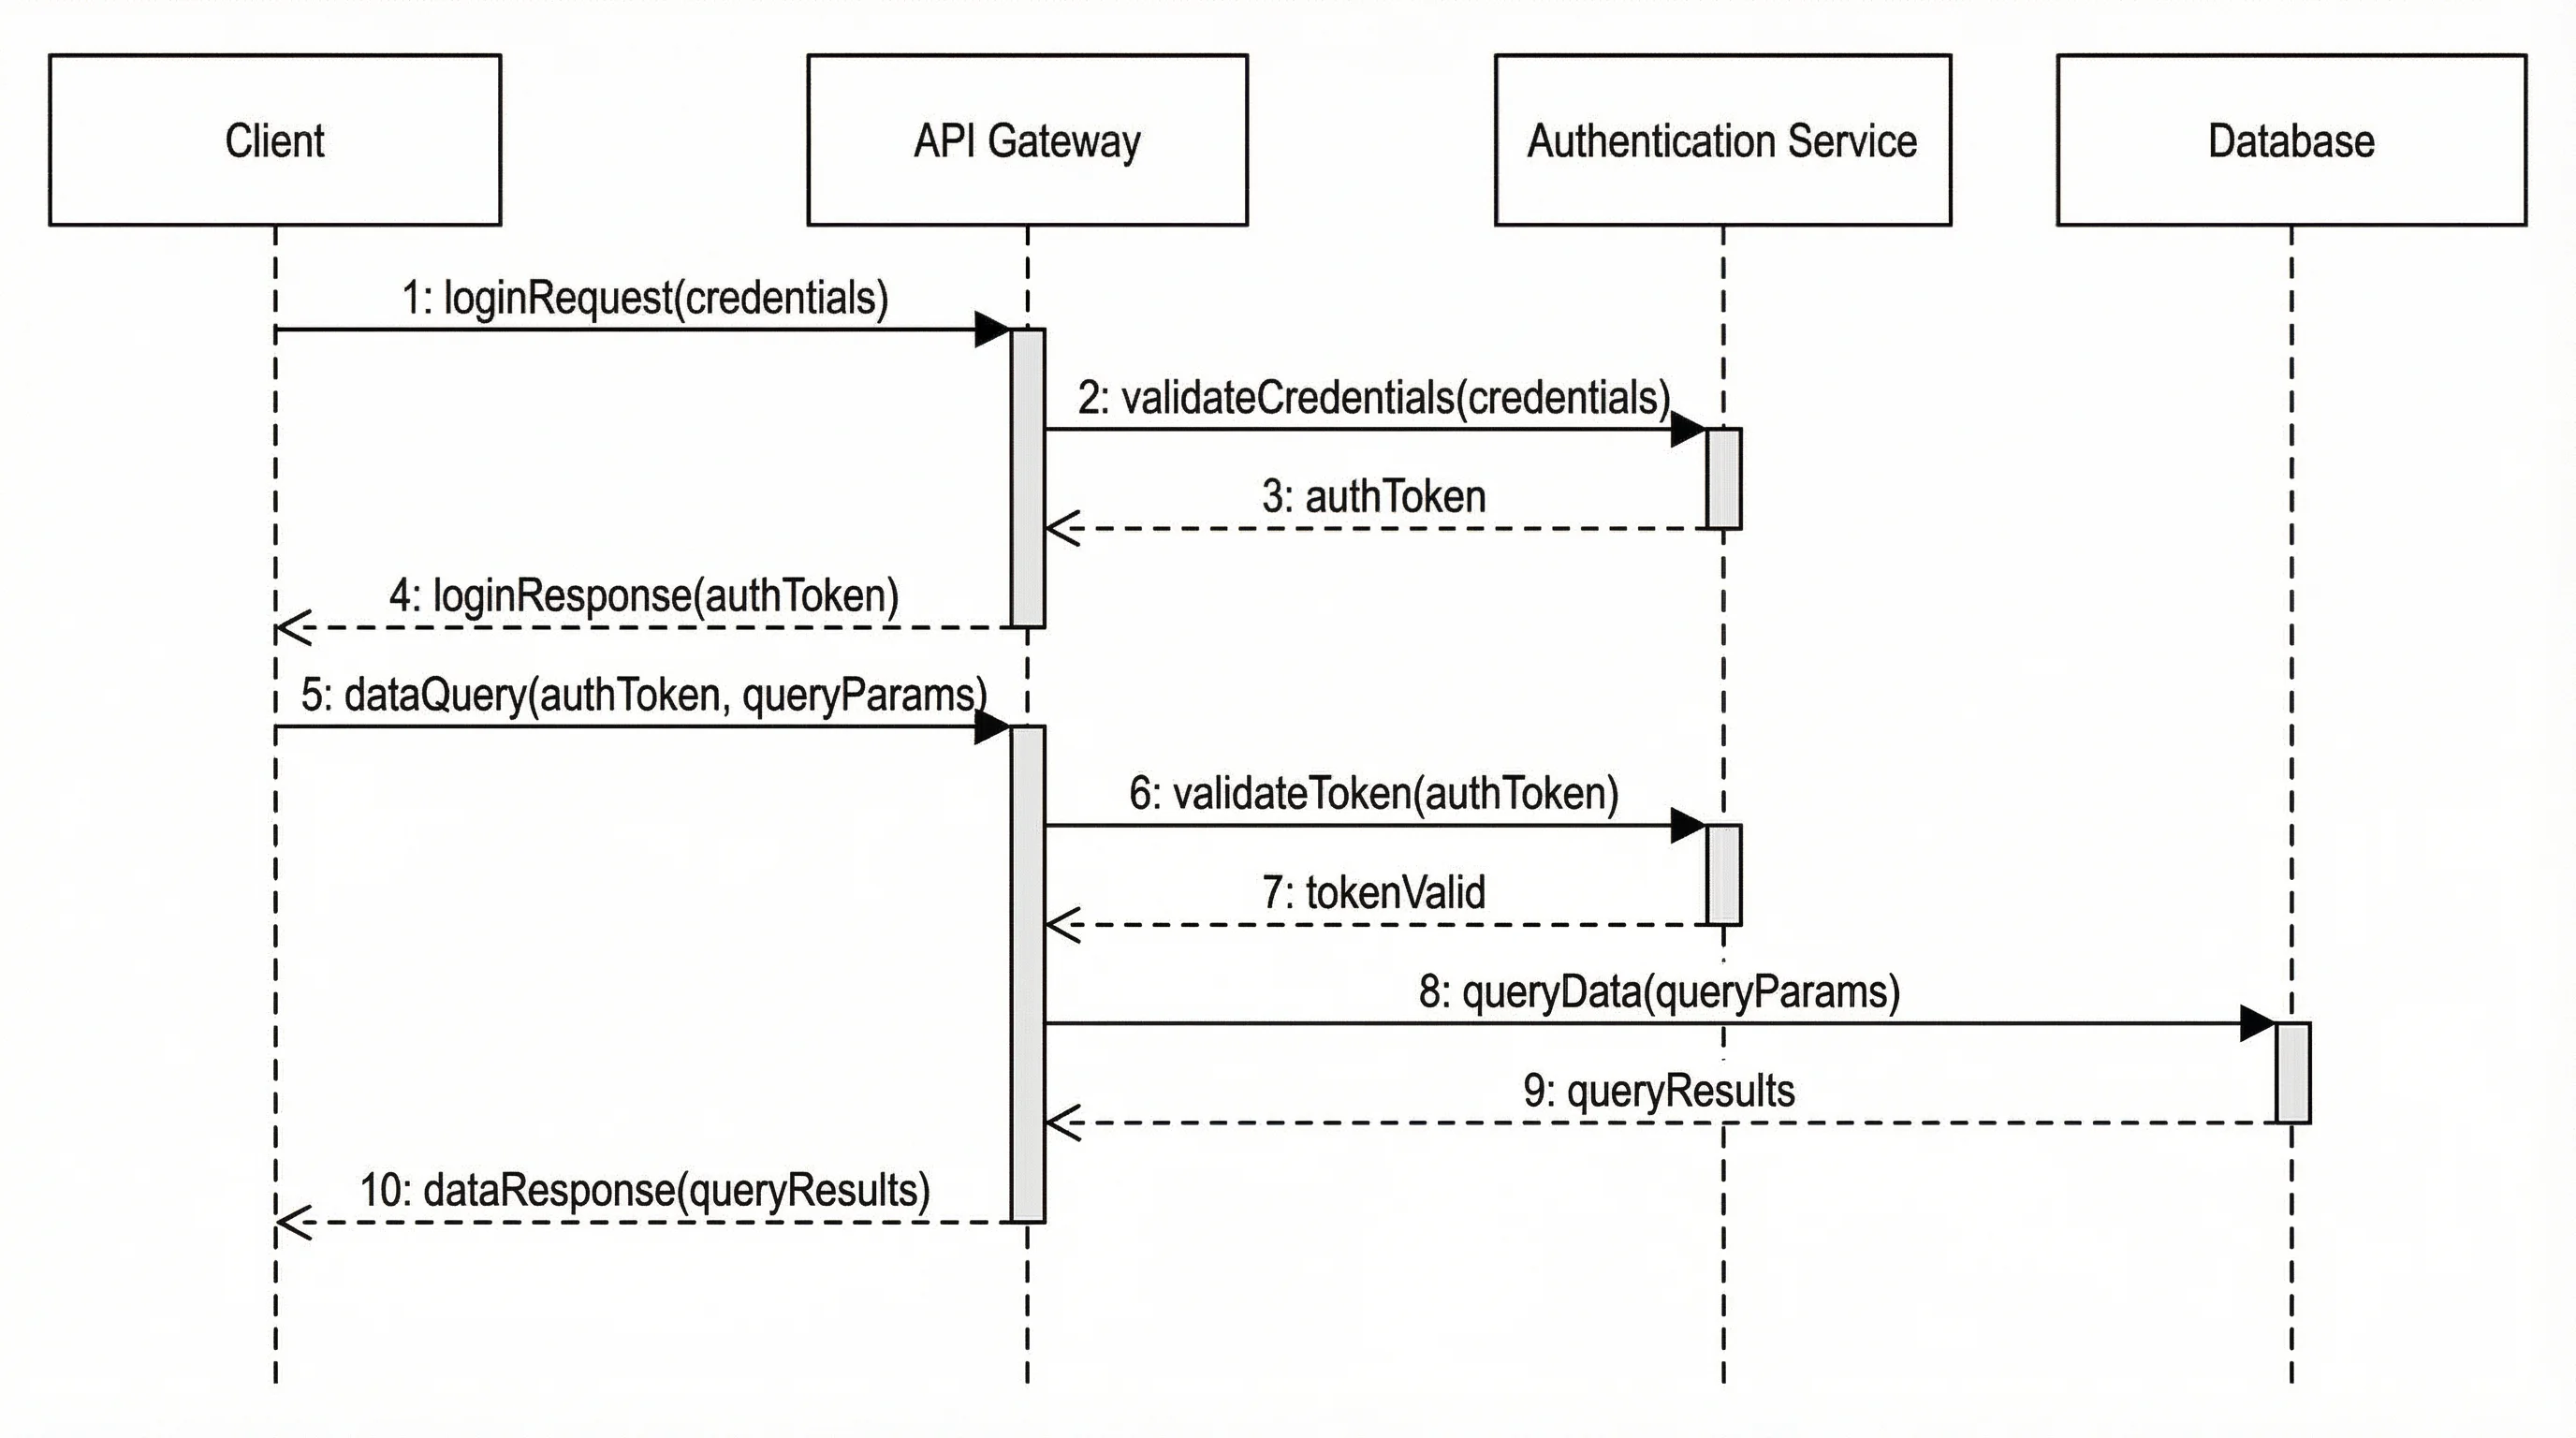
Sequence Diagram Generator
Draw sequence diagrams showing how objects and services exchange messages over time.
 Diagrams
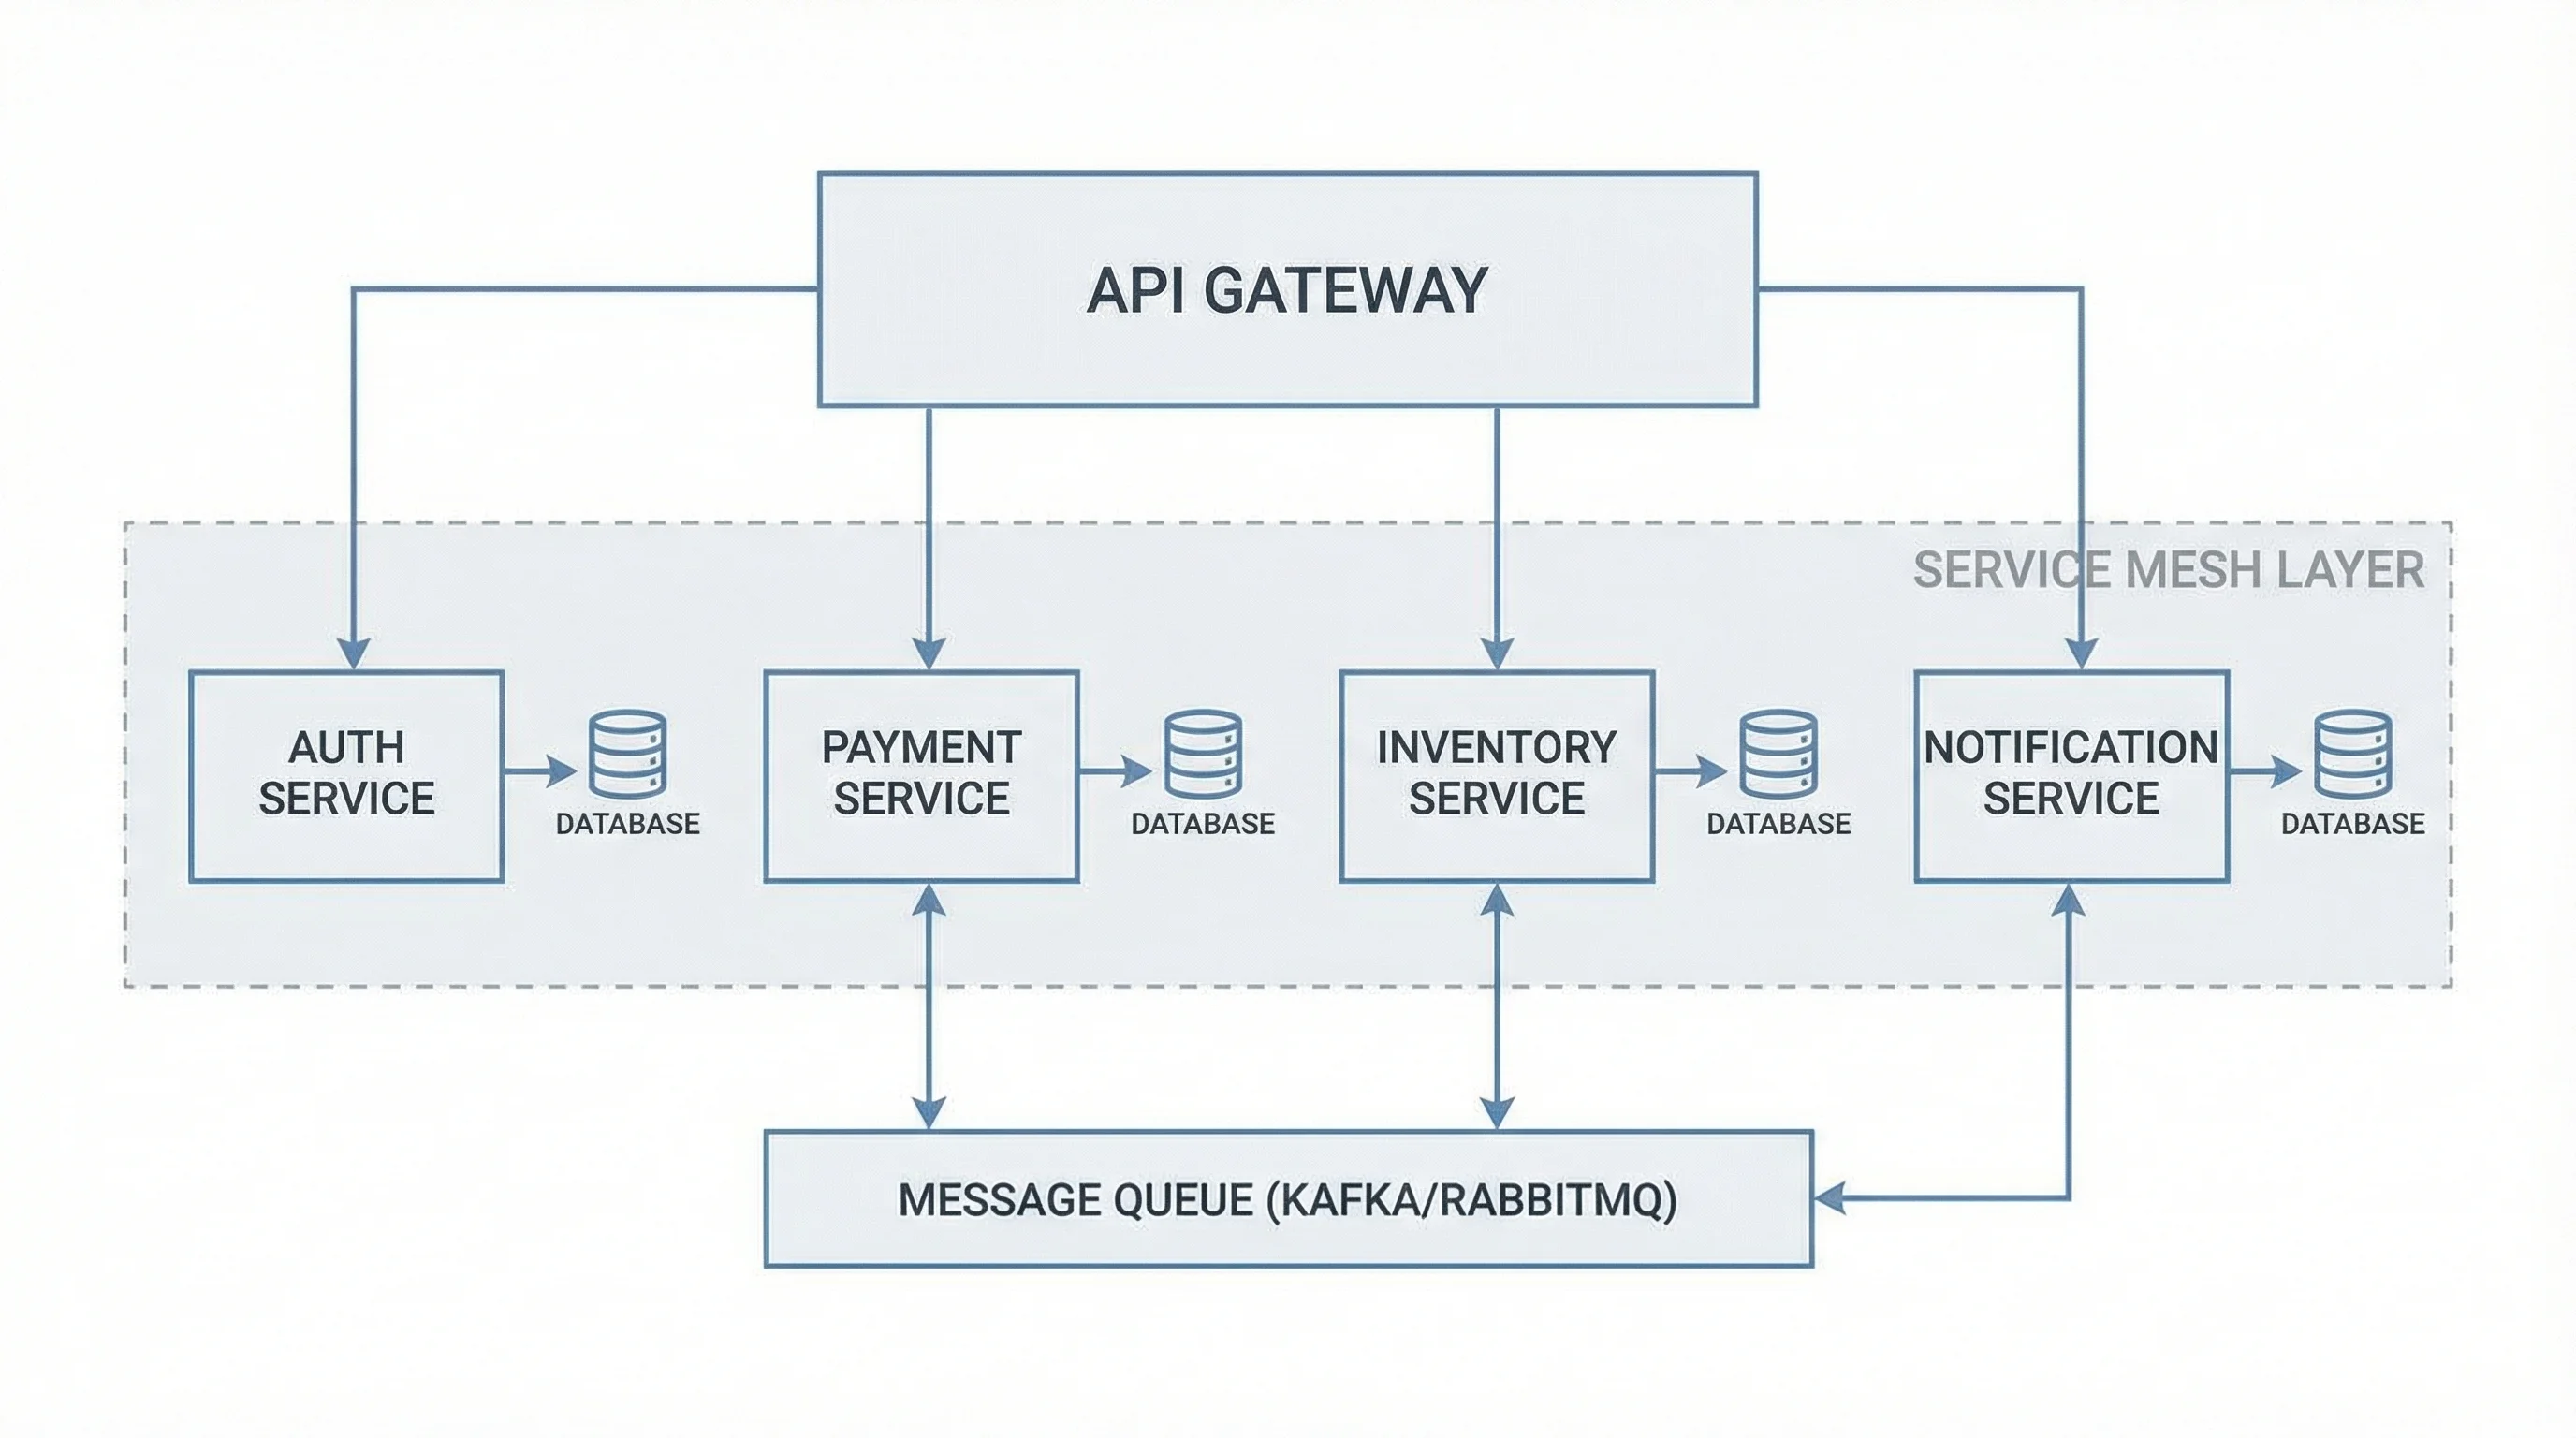
Software Architecture Diagram Generator
Map services, components, and data flow into a clear software architecture diagram.