Okabe-Ito Palette Hex Codes for Python, R & CSS
Copy all 8 Okabe-Ito palette hex codes with RGB values and ready-to-use Python, R, MATLAB and CSS snippets for colorblind-safe scientific figures.
Okabe-Ito Palette Hex Codes: Complete Reference
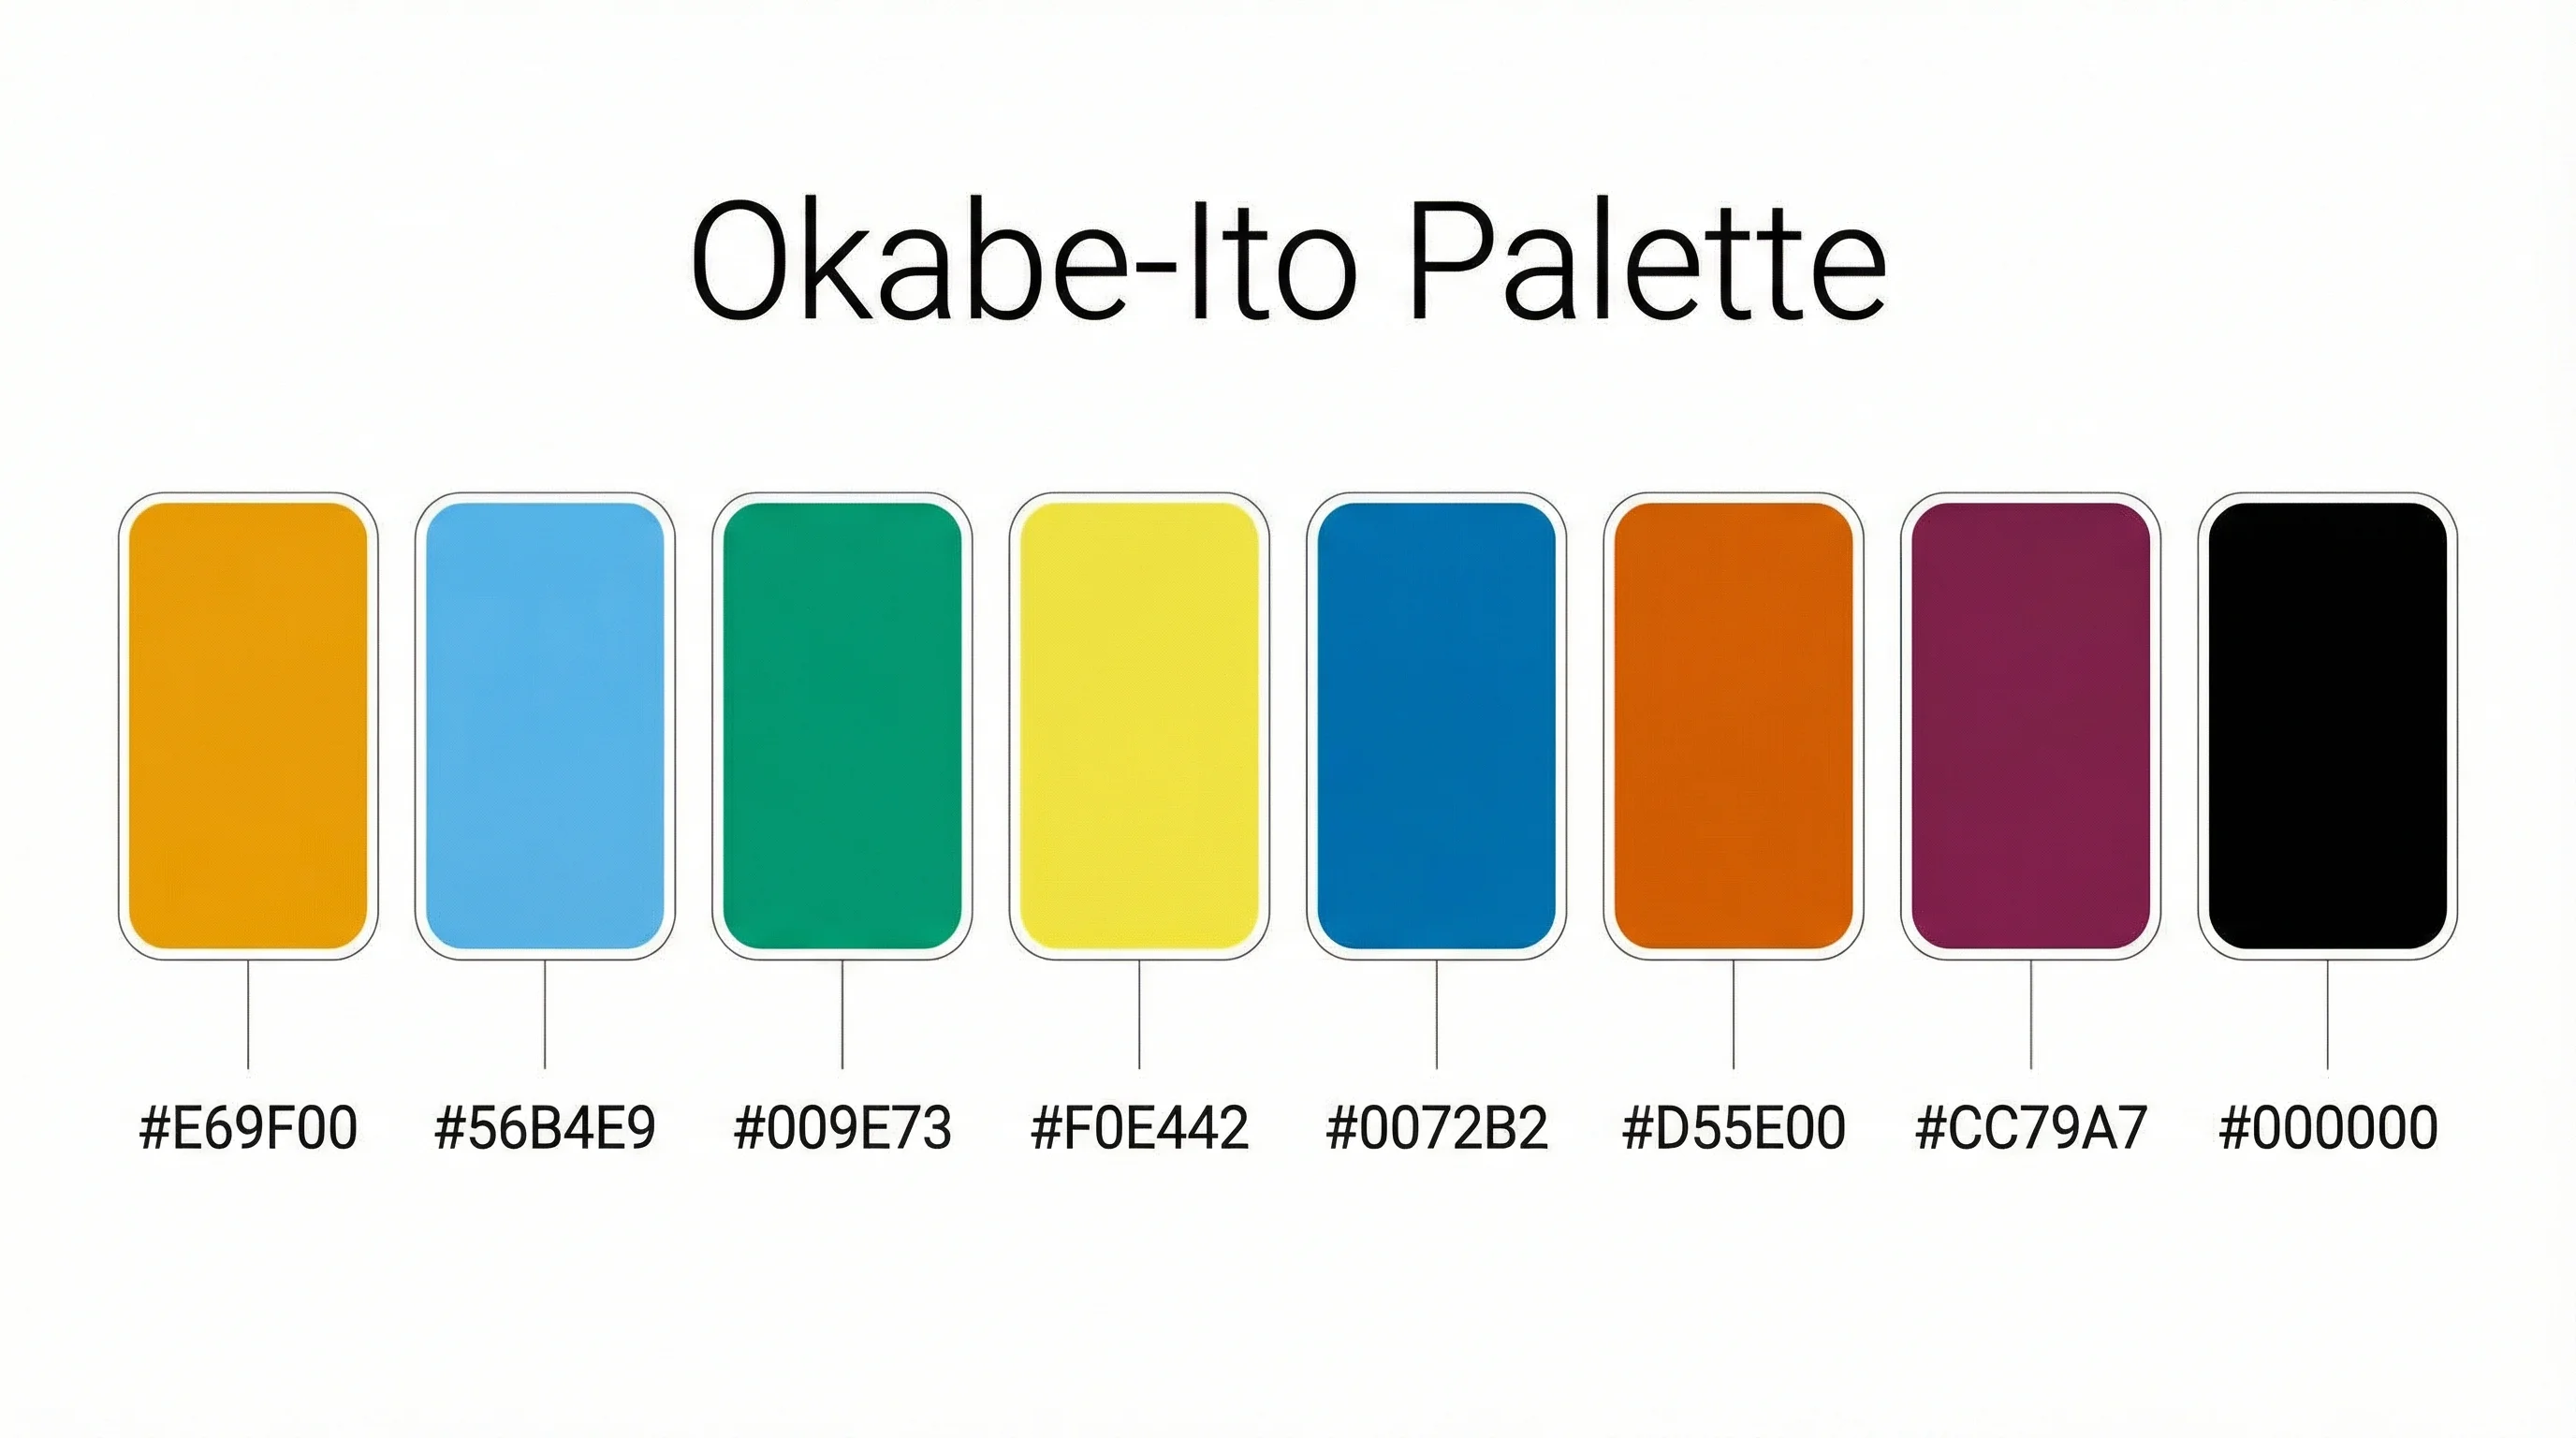
Need the Okabe-Ito palette hex codes? Copy this sequence:
#E69F00, #56B4E9, #009E73, #F0E442, #0072B2, #D55E00, #CC79A7, #000000The Okabe-Ito palette is the most widely recommended colorblind-safe color palette for scientific figures. Created by Masataka Okabe and Kei Ito at the Color Universal Design organization, it provides 8 colors that remain distinguishable for people with all common types of color vision deficiency (CVD).
This palette is explicitly recommended by Nature Methods (where it is sometimes called the Wong palette after Bang Wong's 2011 article) and is the default categorical palette in Claus Wilke's Fundamentals of Data Visualization.
Scientific Color Palette Generator
Generate colorblind-safe palettes for your research figures. Export hex codes, RGB values, and more.
Try it free →All 8 Okabe-Ito Hex Codes
Here are the complete Okabe-Ito palette hex codes, ready to copy and paste:
| Color Name | Hex Code | RGB | Sample |
|---|---|---|---|
| Orange | #E69F00 | rgb(230, 159, 0) | 🟠 |
| Sky Blue | #56B4E9 | rgb(86, 180, 233) | 🔵 |
| Bluish Green | #009E73 | rgb(0, 158, 115) | 🟢 |
| Yellow | #F0E442 | rgb(240, 228, 66) | 🟡 |
| Blue | #0072B2 | rgb(0, 114, 178) | 🔵 |
| Vermillion (Red) | #D55E00 | rgb(213, 94, 0) | 🔴 |
| Reddish Purple | #CC79A7 | rgb(204, 121, 167) | 🟣 |
| Black | #000000 | rgb(0, 0, 0) | ⚫ |
Quick copy (all 8 hex codes):
#E69F00, #56B4E9, #009E73, #F0E442, #0072B2, #D55E00, #CC79A7, #000000Why the Okabe-Ito Palette Is the Gold Standard
Approximately 8% of men and 0.5% of women have some form of color vision deficiency. The Okabe-Ito palette addresses this by providing colors that:
- Remain distinguishable for protanopia (red-blind), deuteranopia (green-blind), and tritanopia (blue-blind)
- Have distinct luminance values, so the palette works even in grayscale printouts
- Were designed for CVD from the start -- not retrofitted or "tested" after creation
- Cover 8 distinct categories, which is sufficient for most scientific figures
This is why journals like Nature, Science, and Cell explicitly recommend colorblind-safe palettes in their author guidelines.
Code Snippets: Use Okabe-Ito in Your Plots
Python (matplotlib / seaborn)
# Define the Okabe-Ito palette
okabe_ito = ['#E69F00', '#56B4E9', '#009E73', '#F0E442',
             '#0072B2', '#D55E00', '#CC79A7', '#000000']

# Use with matplotlib
import matplotlib.pyplot as plt
plt.rcParams['axes.prop_cycle'] = plt.cycler(color=okabe_ito)

# Use with seaborn
import seaborn as sns
sns.set_palette(okabe_ito)
R (ggplot2)
# Define the palette
okabe_ito <- c("#E69F00", "#56B4E9", "#009E73", "#F0E442",
               "#0072B2", "#D55E00", "#CC79A7", "#000000")

# Use with ggplot2
library(ggplot2)
ggplot(data, aes(x, y, color = group)) +
  geom_point() +
  scale_color_manual(values = okabe_ito)

# Or use the built-in scale (ggplot2 ≥ 3.4.0)
ggplot(data, aes(x, y, color = group)) +
  geom_point() +
  scale_color_okabeito()
MATLAB
% Define the Okabe-Ito palette as RGB (0-1 range)
okabe_ito = [
    230/255, 159/255, 0;       % Orange
    86/255,  180/255, 233/255;  % Sky Blue
    0,       158/255, 115/255;  % Bluish Green
    240/255, 228/255, 66/255;   % Yellow
    0,       114/255, 178/255;  % Blue
    213/255, 94/255,  0;        % Vermillion
    204/255, 121/255, 167/255;  % Reddish Purple
    0,       0,       0         % Black
];

% Set as default color order
set(groot, 'defaultAxesColorOrder', okabe_ito);
CSS Custom Properties
:root {
  --oi-orange: #E69F00;
  --oi-sky-blue: #56B4E9;
  --oi-green: #009E73;
  --oi-yellow: #F0E442;
  --oi-blue: #0072B2;
  --oi-vermillion: #D55E00;
  --oi-purple: #CC79A7;
  --oi-black: #000000;
}
Okabe-Ito vs. Other Colorblind-Safe Palettes
| Feature | Okabe-Ito | Viridis | Paul Tol | ColorBrewer |
|---|---|---|---|---|
| Type | Categorical | Sequential | Both | Both |
| Colors | 8 discrete | Continuous | Up to 12 | 3-12 |
| Best for | Distinct categories | Heatmaps, gradients | Complex figures | Maps, charts |
| CVD safe | All types | All types | All types | Selected palettes |
| Recommended by | Nature Methods | matplotlib default | Academic standard | CartoDB, QGIS |
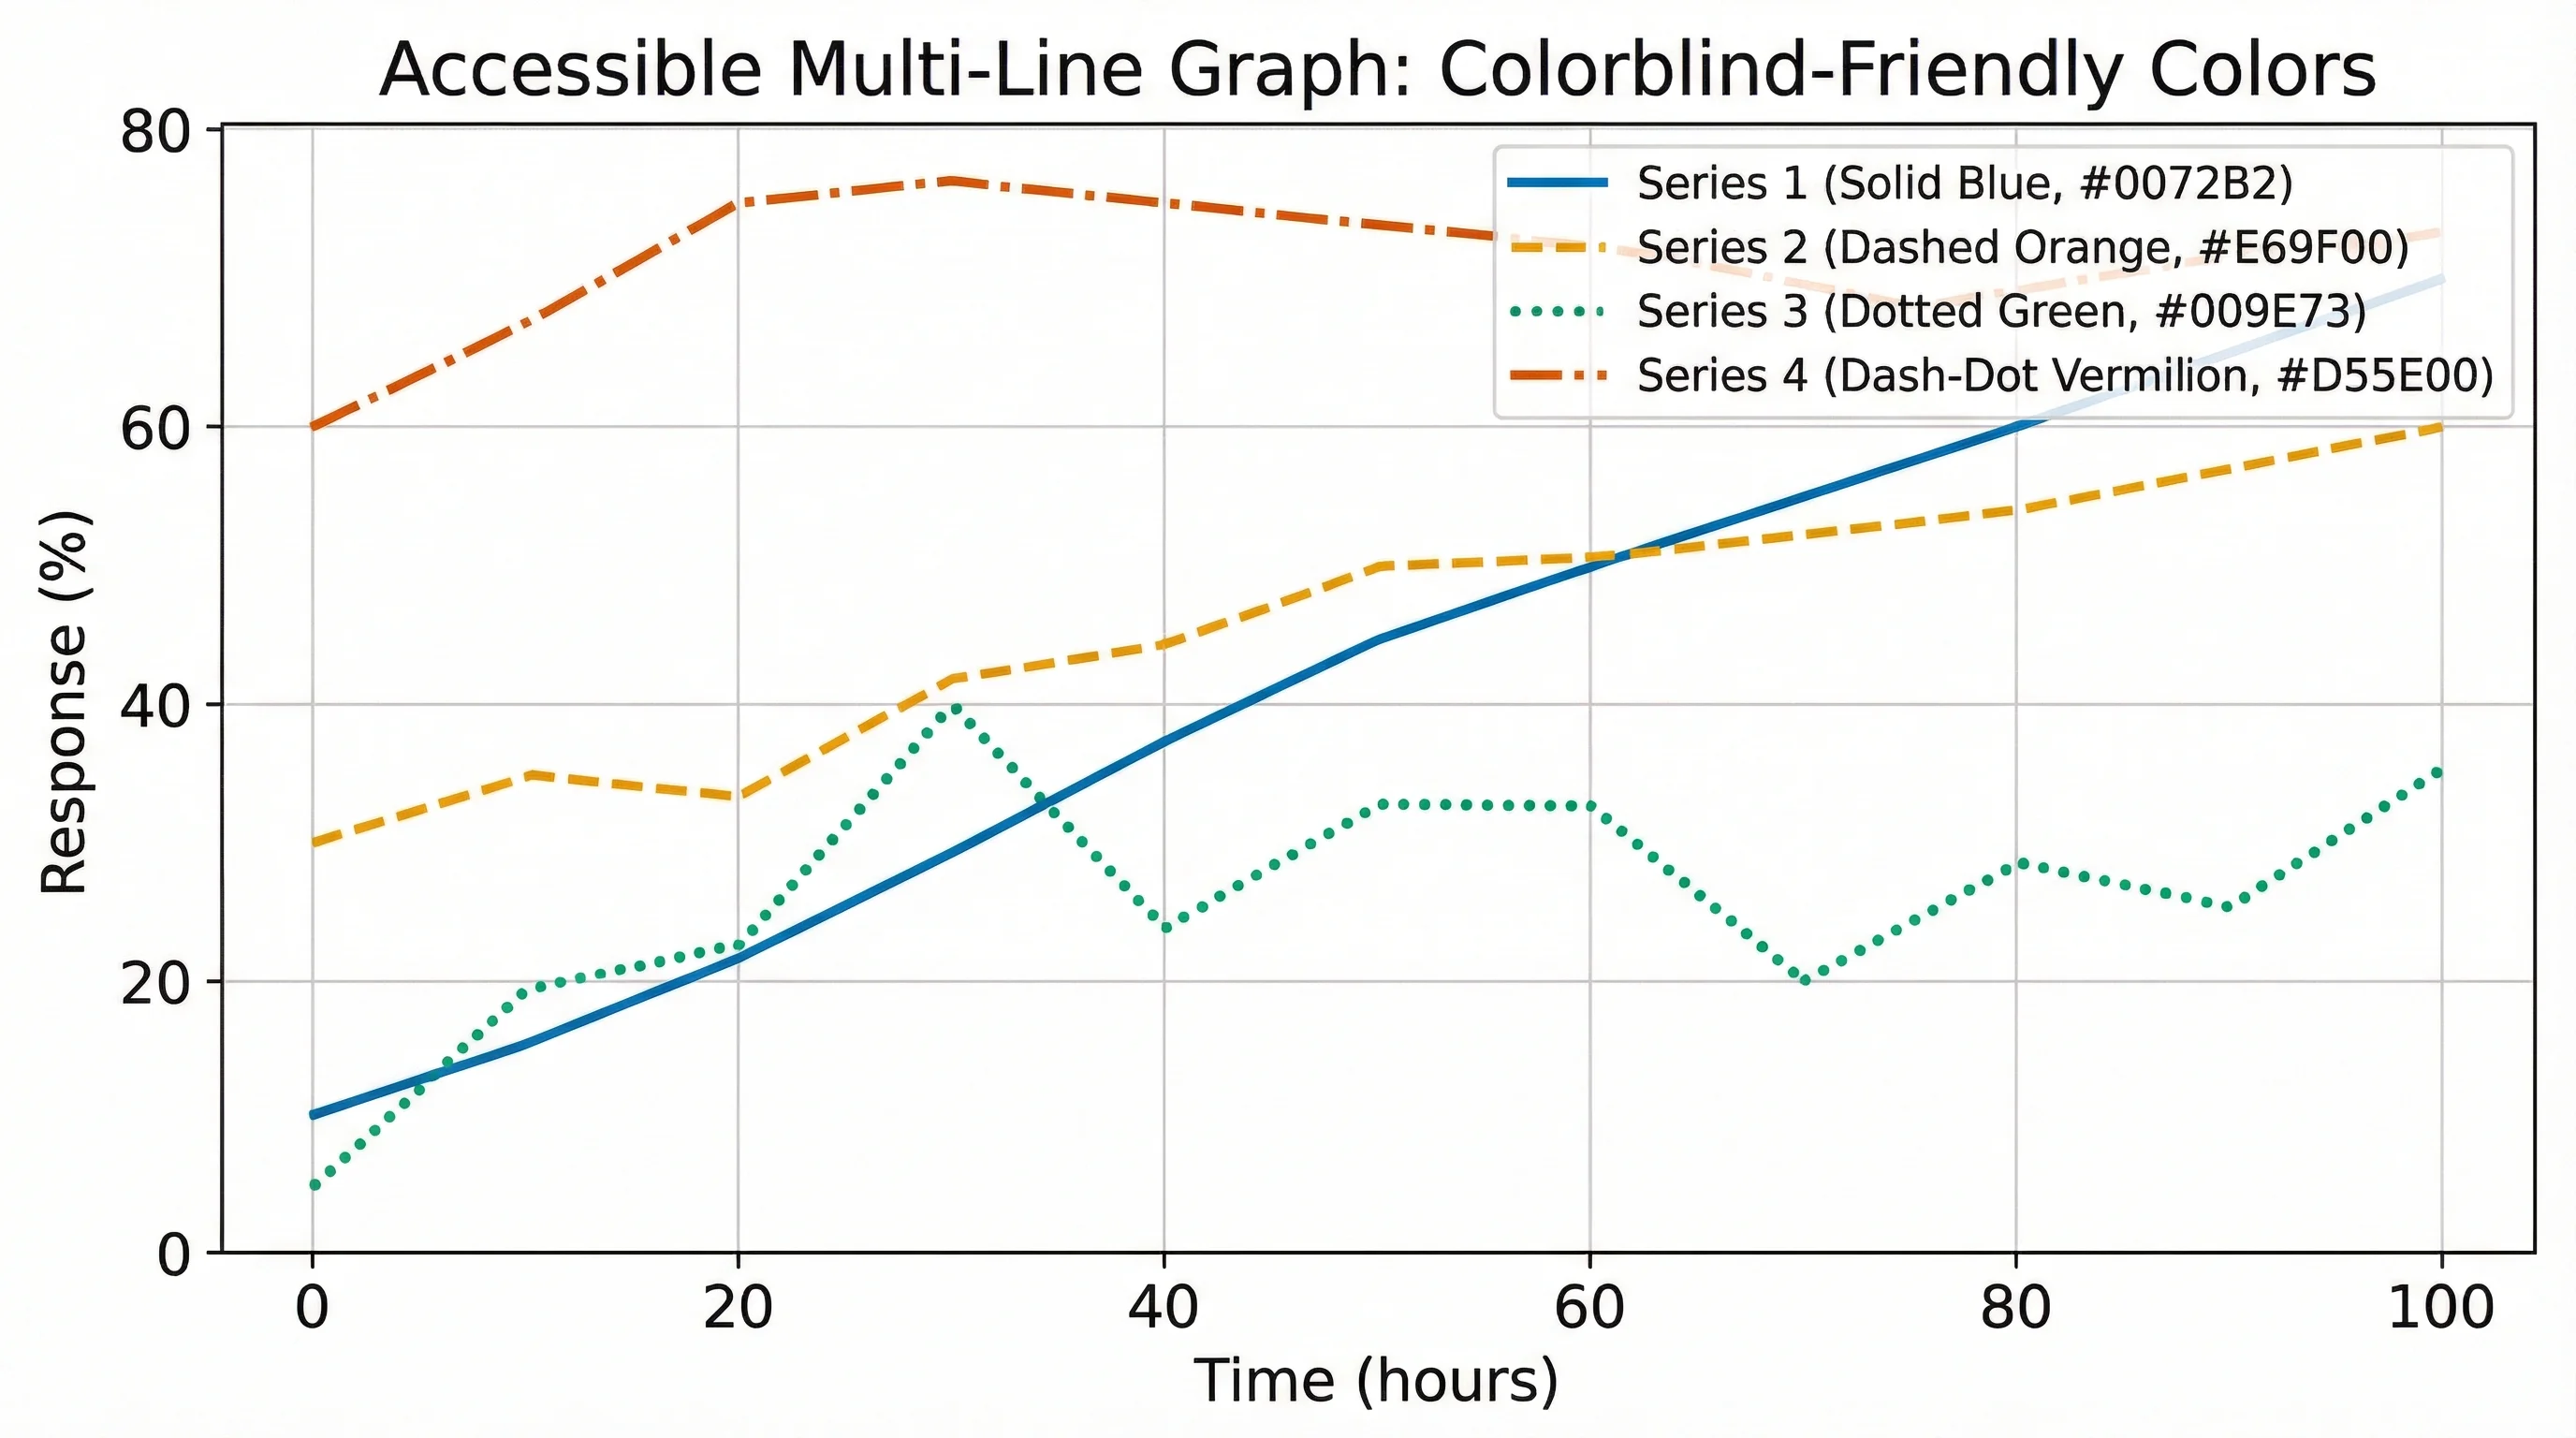
When to use Okabe-Ito: Use it whenever you need distinct categorical colors -- bar charts, line graphs with multiple series, scatter plots with groups, legends, and labels. For sequential or diverging data (heatmaps, geographic maps), use Viridis or ColorBrewer instead.
For a complete guide covering all these palettes with hex codes, see our comprehensive scientific color palette guide.
Okabe-Ito Palette Origin and Citation
The palette was first published by Masataka Okabe and Kei Ito as part of the Color Universal Design (CUD) project at the University of Tokyo:
Okabe, M. & Ito, K. (2008). "Color Universal Design (CUD): How to make figures and presentations that are friendly to Colorblind people." Available at jfly.uni-koeln.de/color/
It gained widespread recognition after Bang Wong's 2011 article in Nature Methods:
Wong, B. (2011). "Points of view: Color blindness." Nature Methods, 8(6), 441. doi:10.1038/nmeth.1618
How to cite in your paper: Reference either the original Okabe & Ito (2008) source or Wong (2011) Nature Methods article, depending on your field's convention.
Frequently Asked Questions
Is the Okabe-Ito palette the same as the Wong palette?
Yes, effectively. Bang Wong popularized the Okabe-Ito palette in his 2011 Nature Methods column, and many researchers refer to it as the "Wong palette." The hex codes are identical.
How many colors are in the Okabe-Ito palette?
The standard Okabe-Ito palette contains 8 colors: Orange (#E69F00), Sky Blue (#56B4E9), Bluish Green (#009E73), Yellow (#F0E442), Blue (#0072B2), Vermillion (#D55E00), Reddish Purple (#CC79A7), and Black (#000000).
Can I use the Okabe-Ito palette commercially?
Yes. The palette was published as part of the Color Universal Design project and is freely available for any use, including commercial applications.
Does ggplot2 have a built-in Okabe-Ito scale?
Yes. Starting with ggplot2 version 3.4.0, you can use scale_color_okabeito() and scale_fill_okabeito() directly without defining the hex codes manually.
What if I need more than 8 colors?
If you need more than 8 distinct categories, consider combining the Okabe-Ito palette with shape or pattern encoding. Alternatively, the Paul Tol palette offers up to 12 colorblind-safe categorical colors. See our full palette comparison guide for details.
Scientific Color Palette Generator
Generate and customize colorblind-safe palettes for your figures.
分类
更多文章
Best Free Adobe Illustrator Alternatives 2026
Compare the best free Adobe Illustrator alternatives in 2026: Inkscape, Affinity by Canva, Canva, Vectr, Gravit and ConceptViz for vector graphics and diagrams.
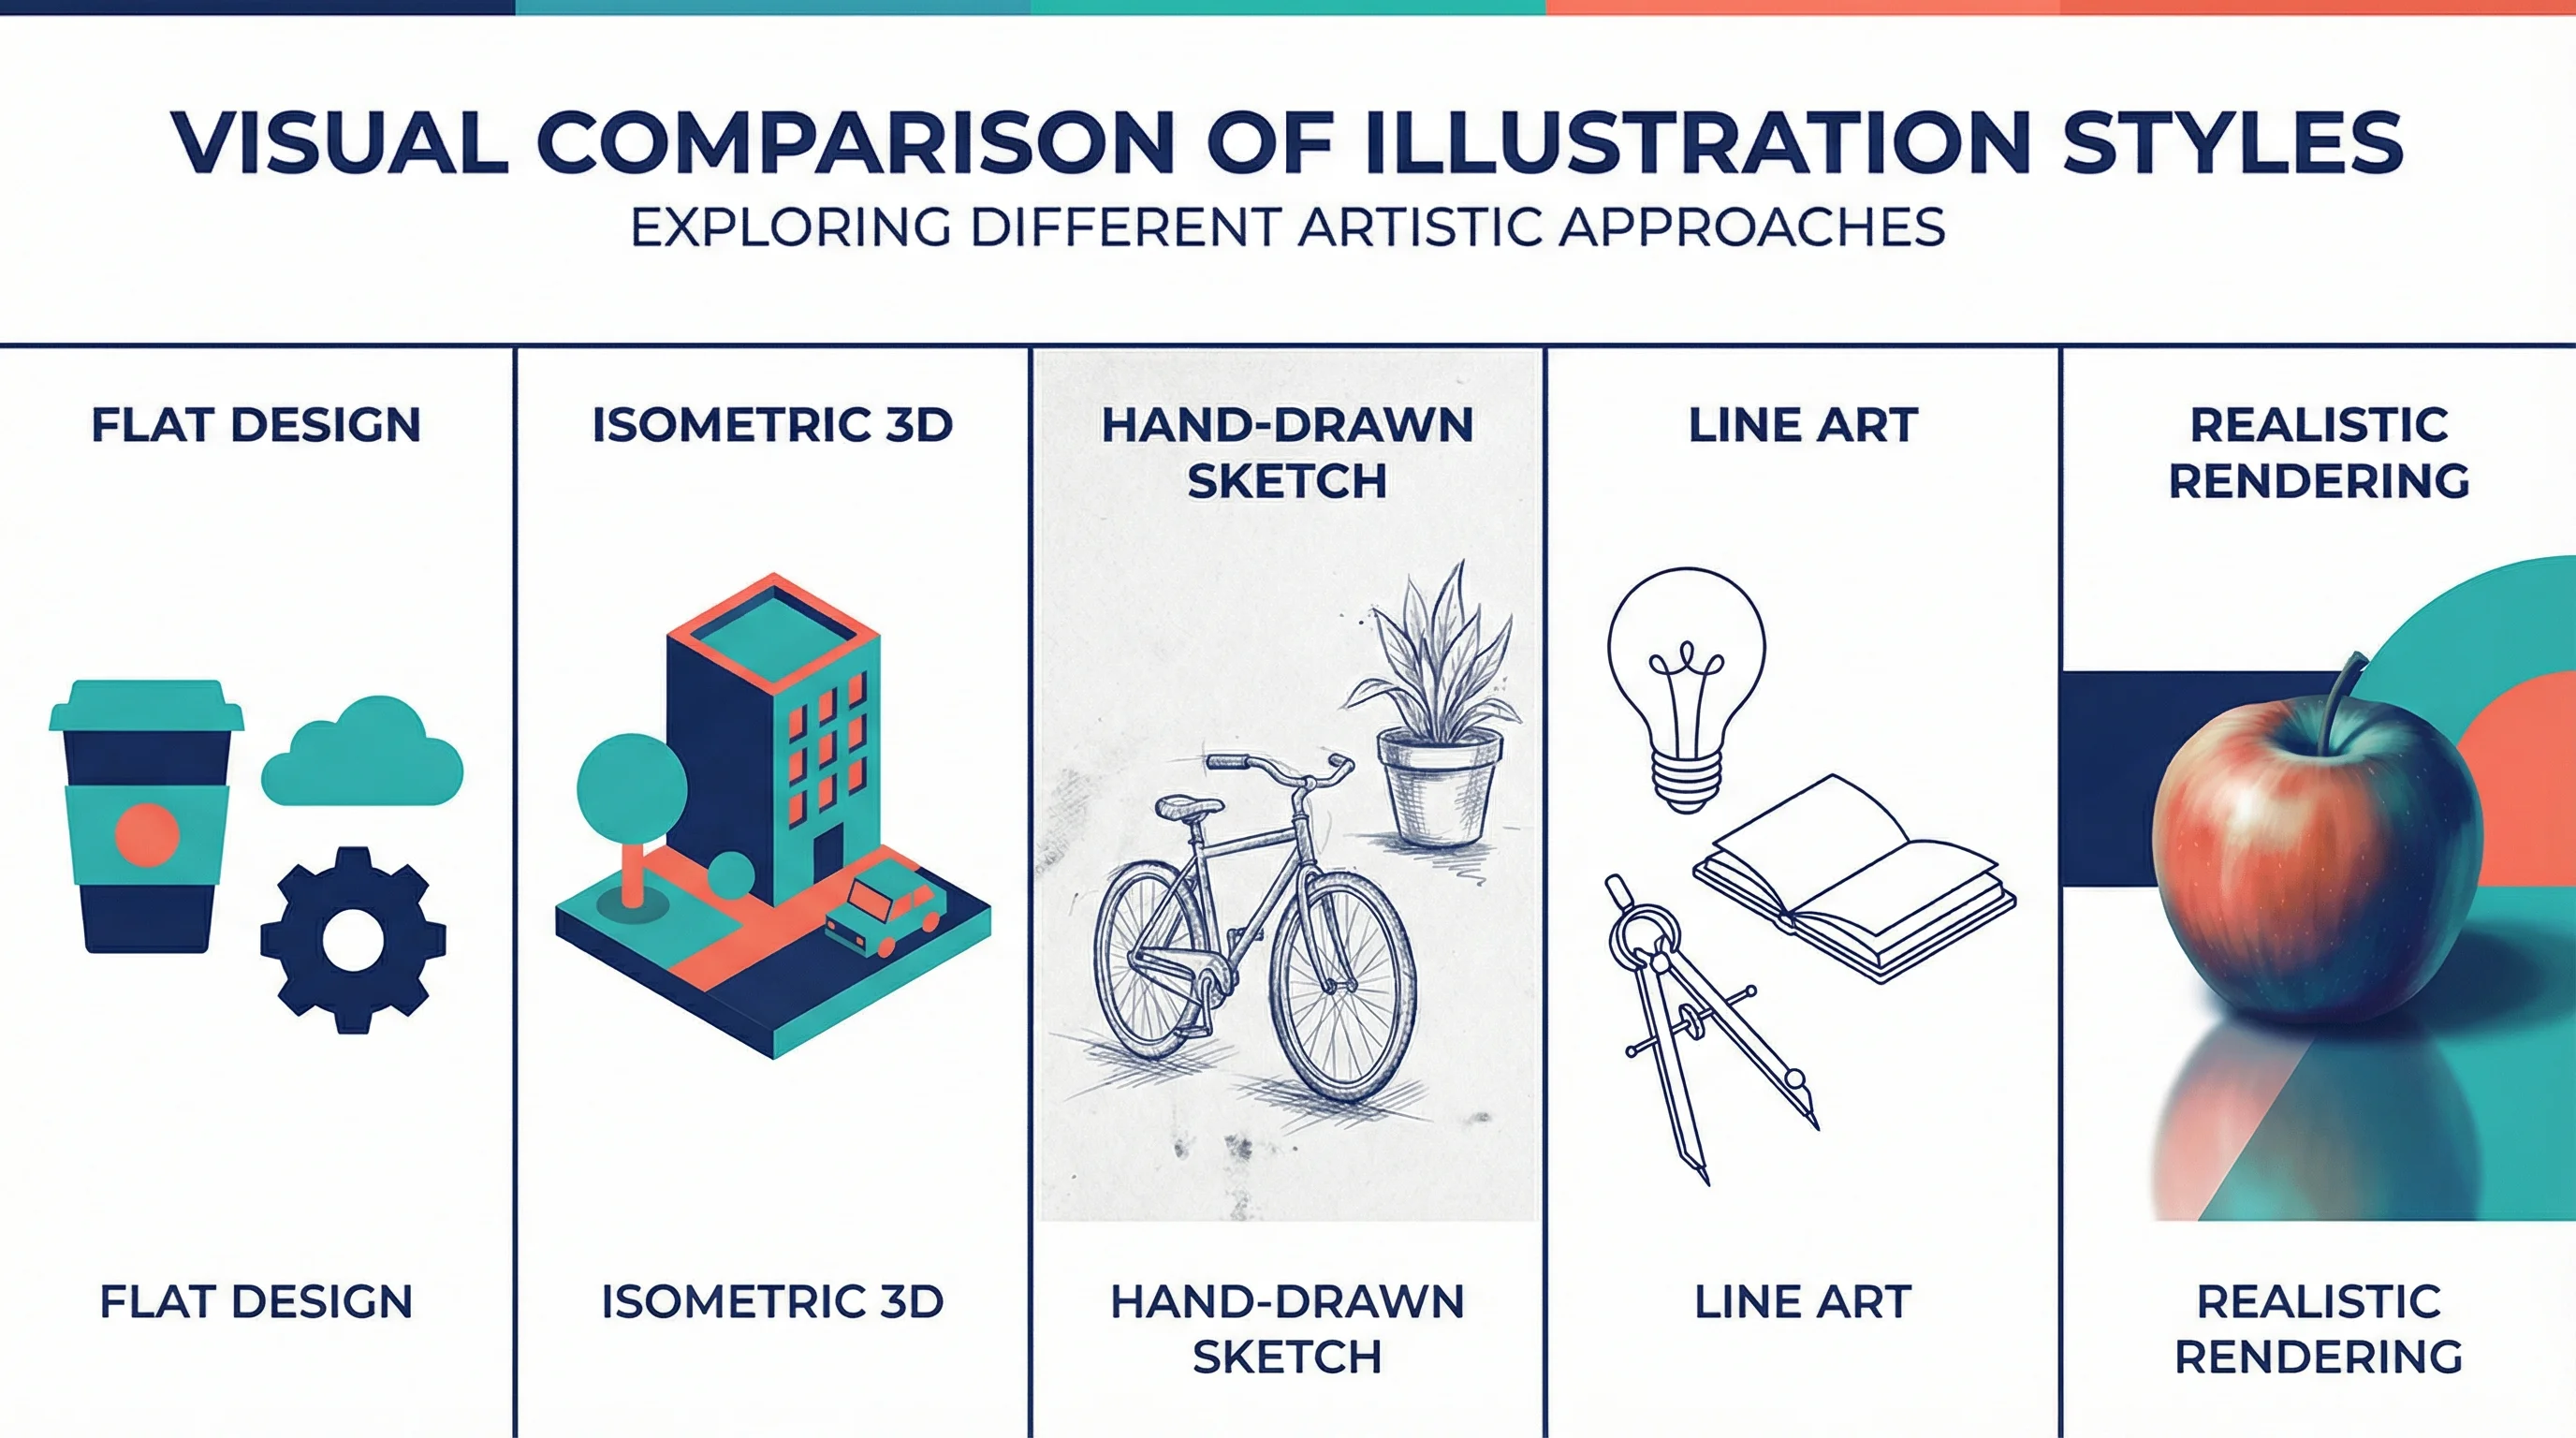
15 Illustration and Infographic Design Styles Explained (2026)
Explore 15 illustration and infographic design styles with examples: flat, isometric, 3D, hand-drawn, minimalist, vector, cartoon, line art and more.

Best AI Diagram Generators in 2026 Compared
Compare the top AI diagram generators for UML, ER, Venn, electrical, and architecture diagrams. Turn text into professional visuals in seconds.