Reaction Coordinate Diagram Generator for Energy Profiles
Draw a labeled reaction coordinate diagram — transition-state peak, Ea and ΔH arrows, exothermic/endothermic auto-detect, and catalyzed pathways.
Energy levels (kJ/mol)
Readout
- Type
- Exothermic
- ΔH
- -60 kJ/mol (released)
- Activation energy
- 80 kJ/mol
- Peak energy
- 180 kJ/mol
Reaction Coordinate Diagram Examples
Common energy profiles: exothermic, endothermic, catalyzed, and multi-step reactions
Labeled Reaction Coordinate Diagram
An energy profile with reactants, transition state, products, Ea and ΔH all labeled.
Exothermic Energy Profile
An exothermic profile: products below reactants, energy released, ΔH negative.
Endothermic Energy Profile
An endothermic profile: products above reactants, energy absorbed, ΔH positive.
Activation Energy Diagram
A diagram emphasizing Ea as the climb from the reactant level to the transition state.
Catalyzed vs Uncatalyzed
Two pathways compared: the catalyzed route has a lower activation energy peak.
Two-Step Reaction with Intermediate
A multi-step profile with two transition states and a stable intermediate between them.
What is a reaction coordinate diagram?
A reaction coordinate diagram — also called an energy profile or potential energy diagram — shows how the potential energy of a chemical system changes as a reaction proceeds. Potential energy is plotted on the vertical axis and the reaction progress, or reaction coordinate, runs along the horizontal axis from reactants on the left to products on the right. The curve starts on a flat plateau at the reactant energy, climbs to a peak, and then descends to a plateau at the product energy. The height of that curve at any point represents the energy the collection of atoms holds as old bonds break and new bonds form. Because the x-axis is a measure of progress rather than time or concentration, it has no numeric scale — only direction matters. These diagrams let you read off, at a glance, how much energy a reaction needs to get started and whether it releases or absorbs energy overall.
Activation energy and the transition state
- To react, molecules must first collide with enough energy and the right orientation to reach an unstable, high-energy arrangement called the transition state — the peak of the curve. The energy required to climb from the reactant level up to that peak is the activation energy, written Ea.
- Activation energy is the barrier every reaction has to clear, which is why some thermodynamically favorable reactions still proceed slowly at room temperature: the molecules rarely have enough energy to reach the top. A higher peak means a larger Ea and a slower reaction; a lower peak means the barrier is easier to cross.
- The transition state itself is fleeting and cannot be isolated. It sits at the maximum of the curve where bonds are partially broken and partially formed. In this tool the peak energy is simply the reactant energy plus the activation energy, and it is marked with a labeled dot at the top of the curve.
Exothermic vs endothermic reactions (ΔH)
- The overall energy change of a reaction is the enthalpy change, ΔH, equal to the product energy minus the reactant energy. Its sign tells you whether energy is released or absorbed.
- In an exothermic reaction the products sit lower than the reactants, so ΔH is negative and energy is released to the surroundings — the reaction gives off heat. In an endothermic reaction the products sit higher than the reactants, ΔH is positive, and energy is absorbed from the surroundings. This tool detects the type automatically from the two energy levels you enter and draws the ΔH arrow pointing down for exothermic and up for endothermic.
- Note that ΔH and Ea are independent: a reaction can be strongly exothermic yet still have a large activation barrier, which is why fuels can sit stably in air until a spark provides the energy to get over the peak.
Catalysts and lower activation energy
- A catalyst speeds up a reaction by providing an alternative pathway with a lower activation energy — a lower peak on the diagram. It does not change the reactant or product energies, so the overall ΔH stays exactly the same; only the barrier between them is reduced.
- On a reaction coordinate diagram a catalyzed pathway is drawn as a second curve sharing the same start and end levels but with a shorter climb to a lower transition state. Toggle "Show catalyzed pathway" in the tool to overlay it and compare the two barriers side by side.
- Because more molecules have enough energy to clear a lower barrier at any given temperature, lowering Ea can dramatically increase the reaction rate. Enzymes are biological catalysts that work exactly this way, cutting activation energies so reactions can run quickly at body temperature.
Multi-step reactions and intermediates
- Many reactions happen in more than one elementary step. A two-step reaction has two transition states — two peaks — separated by a valley. The species that sits in that valley is a reaction intermediate: a real, if short-lived, molecule that forms after the first step and is consumed in the second.
- An intermediate is fundamentally different from a transition state. A transition state is a maximum on the energy curve and cannot be isolated, while an intermediate is a local minimum — it is stable enough, at least briefly, to have its own energy level. The taller of the two peaks corresponds to the slowest, rate-determining step.
- Switch on "Two-step (with intermediate)" to draw a diagram with two transition states and a labeled intermediate in the dip between them. You can set the intermediate energy and the second activation energy independently to model the shape of the mechanism.
Frequently Asked Questions
Related Science Tools
 Chemistry
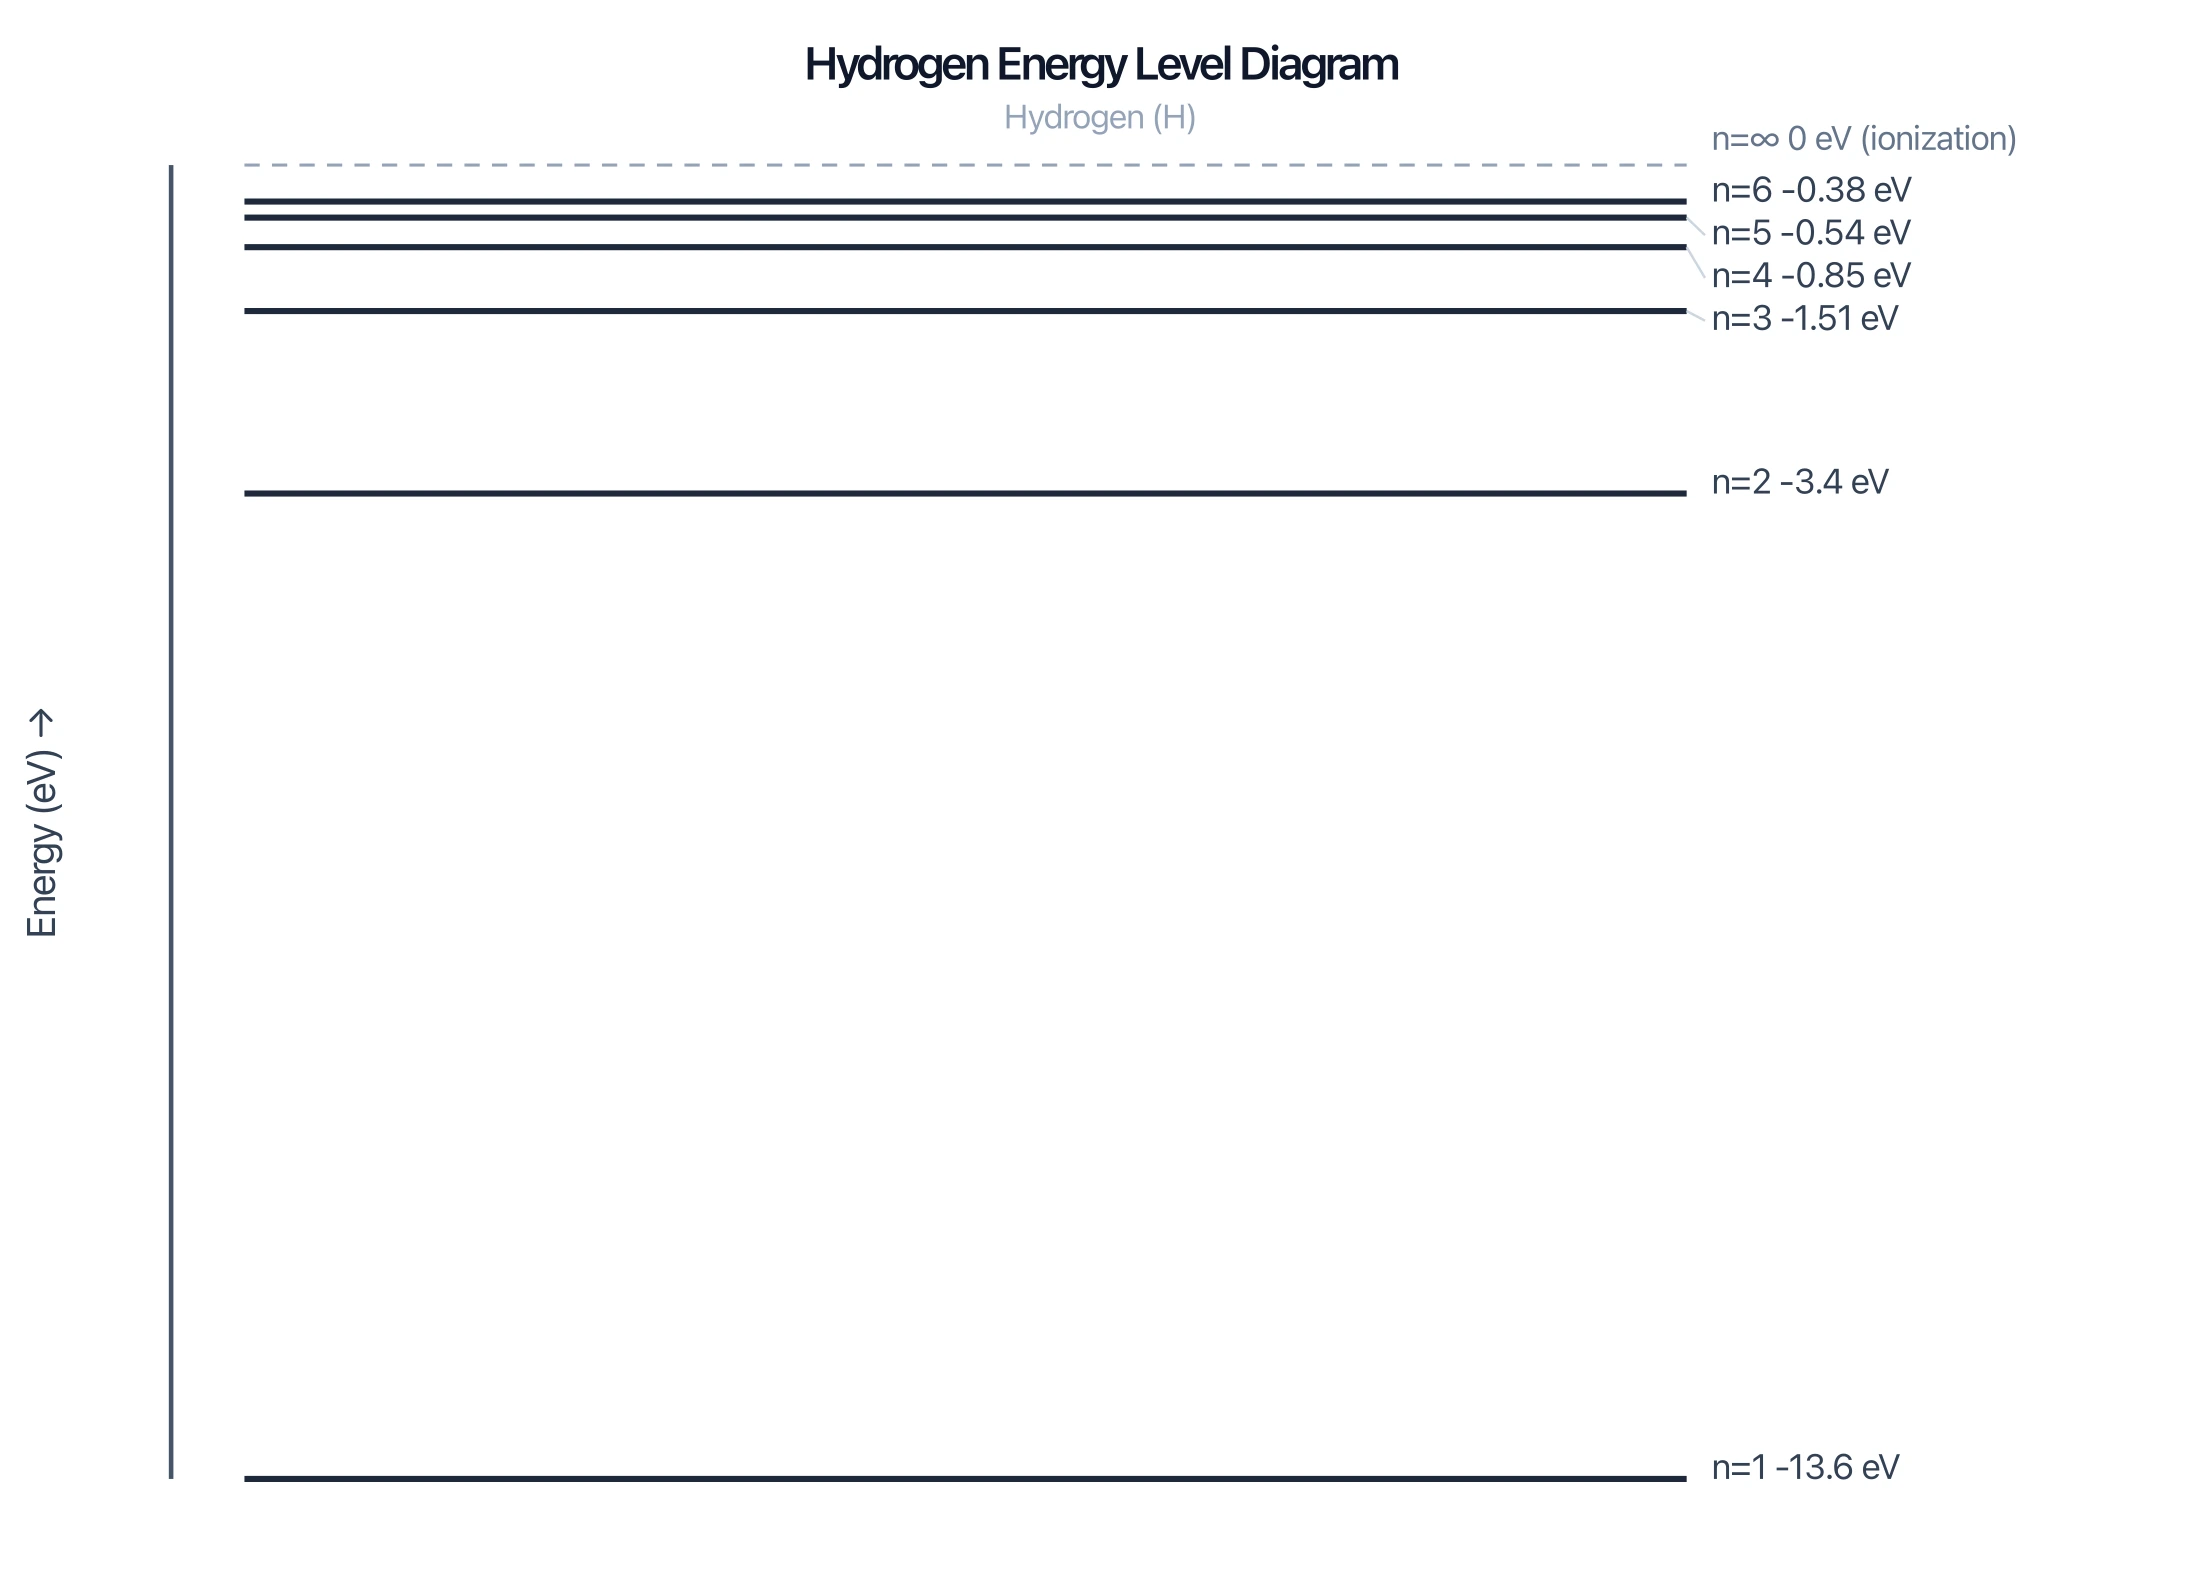
Energy Level Diagram Generator
Draw labeled electron energy level diagrams: shells, subshells, and electron configurations with transitions.
 Chemistry
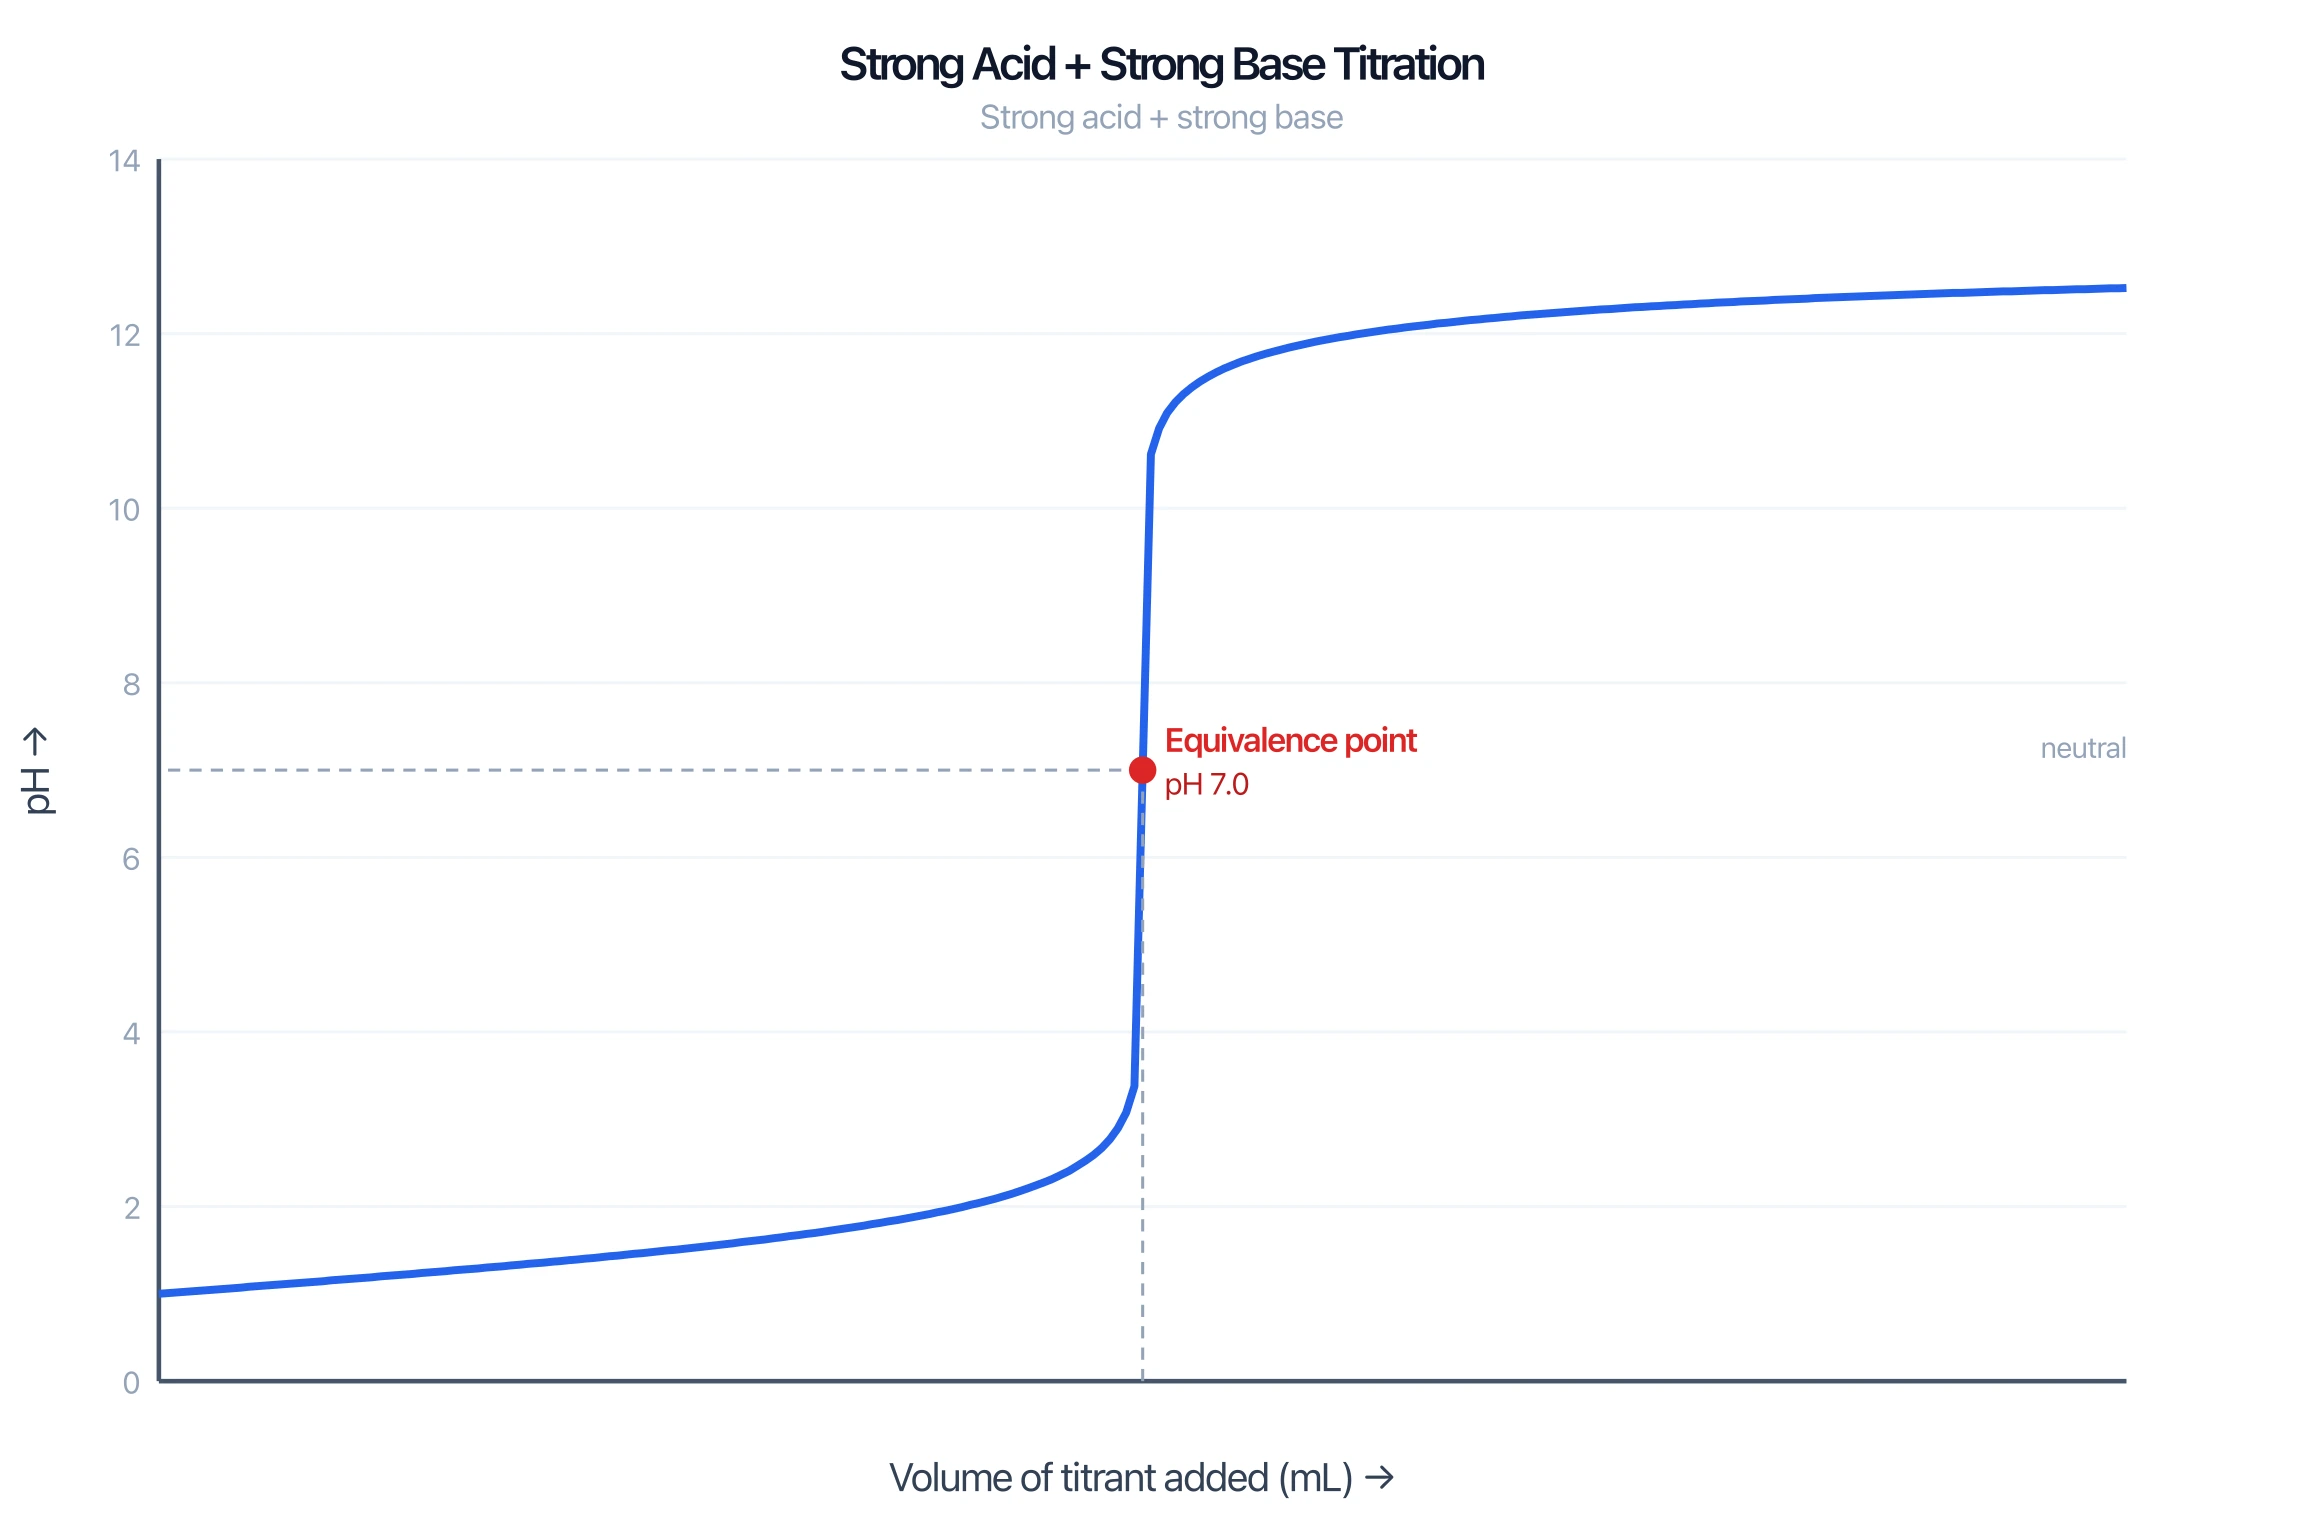
Titration Curve Generator
Plot pH vs volume titration curves for strong and weak acids and bases, with the equivalence point marked.
 Education
Coordinate Plane Generator
Create clean, printable Cartesian planes: plot ordered pairs, graph lines by slope and intercept, and label the quadrants.