ER Diagram Generator from Plain English
Generate an entity-relationship diagram from a plain-English description of your database. Name your entities, attributes, and relationships and the AI draws a labeled ERD with crow’s-foot cardinality, primary and foreign keys — free.
ER Diagram Generator
Free to try ·
Your ER diagram will appear here
Describe your database structure and click Generate
ER Diagram Examples
Entity-relationship diagrams across academic, business, and software domains
University Database ERD
A university enrollment model drawn in Chen notation, with diamonds for relationships and ovals for attributes.
Hospital Management ERD
A hospital schema in Crow's Foot notation, showing one-to-many and many-to-many relationships with labeled cardinality.
E-Commerce Database ERD
An e-commerce data model with color-coded entities for Product, Customer, Order, Payment, and Review.
Library System ERD
A library borrowing and cataloging model with primary and foreign keys labeled on every entity.
Social Media Platform ERD
A social platform model with many-to-many links and a self-referencing follow relationship between users.
Inventory Management ERD
A procurement and distribution model with Supplier, Warehouse, and Purchase Order entities and clear cardinality.
What is an ER diagram?
An entity-relationship diagram (ERD) is a picture of the data your system stores and how that data connects. It maps the entities you keep records about — things like Customer, Order, or Product — along with their attributes (the fields of each record) and the relationships between them. ER diagrams are the standard first step in relational database design: you sketch the model on paper before you write a single line of SQL, so everyone agrees on what data exists and how it links together. This generator turns a plain-English description of your database into exactly that kind of labeled ERD.
Entities, attributes, and relationships
- Entities are the things your database tracks — each one usually becomes a table. Customer, Order, and Product are entities.
- Attributes are the properties of an entity — the columns of the table. A Customer has a name, an email, and a signup date.
- Relationships are the links between entities — a Customer places an Order, an Order contains Products. These links are what make a relational database relational.
- A good ERD shows all three at once, so you can read the shape of your data and the rules that connect it in a single view.
Cardinality: one-to-one, one-to-many, and many-to-many
Cardinality describes how many records on one side of a relationship can connect to records on the other side. A one-to-one (1:1) relationship links exactly one record to one other — a User and their single Profile. A one-to-many (1:N) relationship is the most common — one Customer can place many Orders, but each Order belongs to one Customer. A many-to-many (M:N) relationship links many records on both sides — a Student enrolls in many Courses and each Course has many Students — and is usually resolved with a join (junction) table. Getting cardinality right is the difference between a schema that holds your data correctly and one that loses or duplicates it, so describe these rules clearly when you write your prompt.
Primary keys, foreign keys, and crow’s-foot notation
A primary key is the attribute that uniquely identifies each record in an entity — a customer_id or an order_id — and it is conventionally underlined in an ERD. A foreign key is an attribute that points to the primary key of another entity, and it is how a relationship is actually implemented: an Order carries a customer_id foreign key that references the Customer it belongs to. Crow’s-foot notation draws these relationships as connecting lines whose endpoints encode cardinality — a single bar means “one,” a forked “crow’s foot” means “many,” and a circle means “optional.” It is the notation most database tools and engineers use, because it packs the cardinality rules into the lines themselves. The original Chen notation, by contrast, uses rectangles for entities, diamonds for relationships, and ovals for attributes, and is common in textbooks.
How to generate an ERD from a plain-English description
- List your entities — the main things your system stores, such as User, Order, Product, Payment.
- For each entity, mention its key attributes and which one is the primary key (for example, “User has id, email, and name”).
- Describe how the entities relate and how many connect to how many — “one Customer places many Orders,” “Students and Courses are many-to-many.”
- Name a notation if you have a preference (“use crow’s-foot notation”), then generate. The AI reads your description and draws a labeled ERD with entities, attributes, keys, and cardinality.
Using ER diagrams in database design
ER diagrams earn their keep at three points in a project. Early on, a conceptual ERD captures the entities and relationships at a high level so stakeholders can agree on scope. As the design firms up, a logical ERD adds attributes, primary keys, and cardinality while staying independent of any particular database. Finally, a physical ERD pins down data types and table structures for a specific engine like PostgreSQL or MySQL. A well-normalized model — ideally to third normal form — removes redundancy and keeps your data consistent. Use the diagram from this tool to think through the model, document it, and communicate it with your team before you build the schema.
Frequently Asked Questions
More Database & Diagram Tools
 Visualization
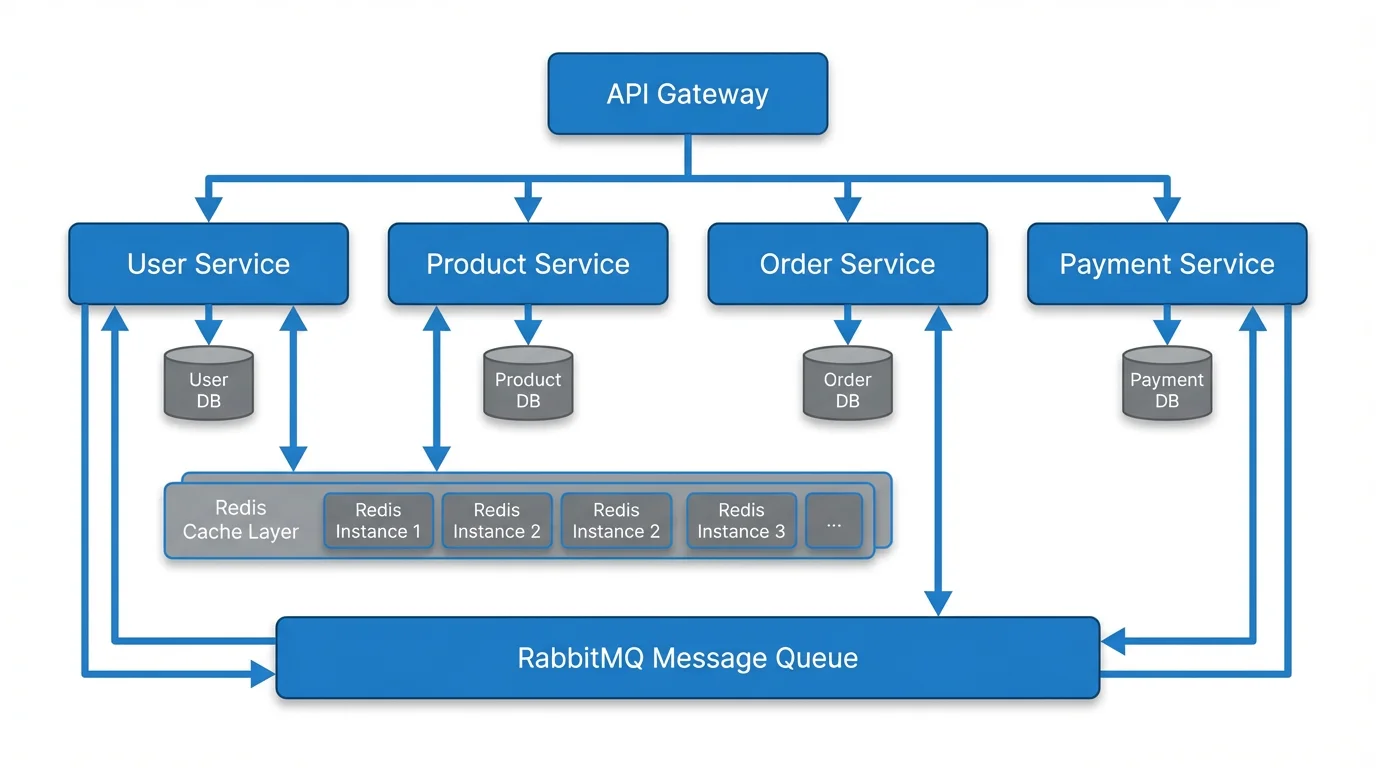
Text to Diagram Generator
Turn a text description into a flowchart, architecture diagram, or other technical diagram.
 Research
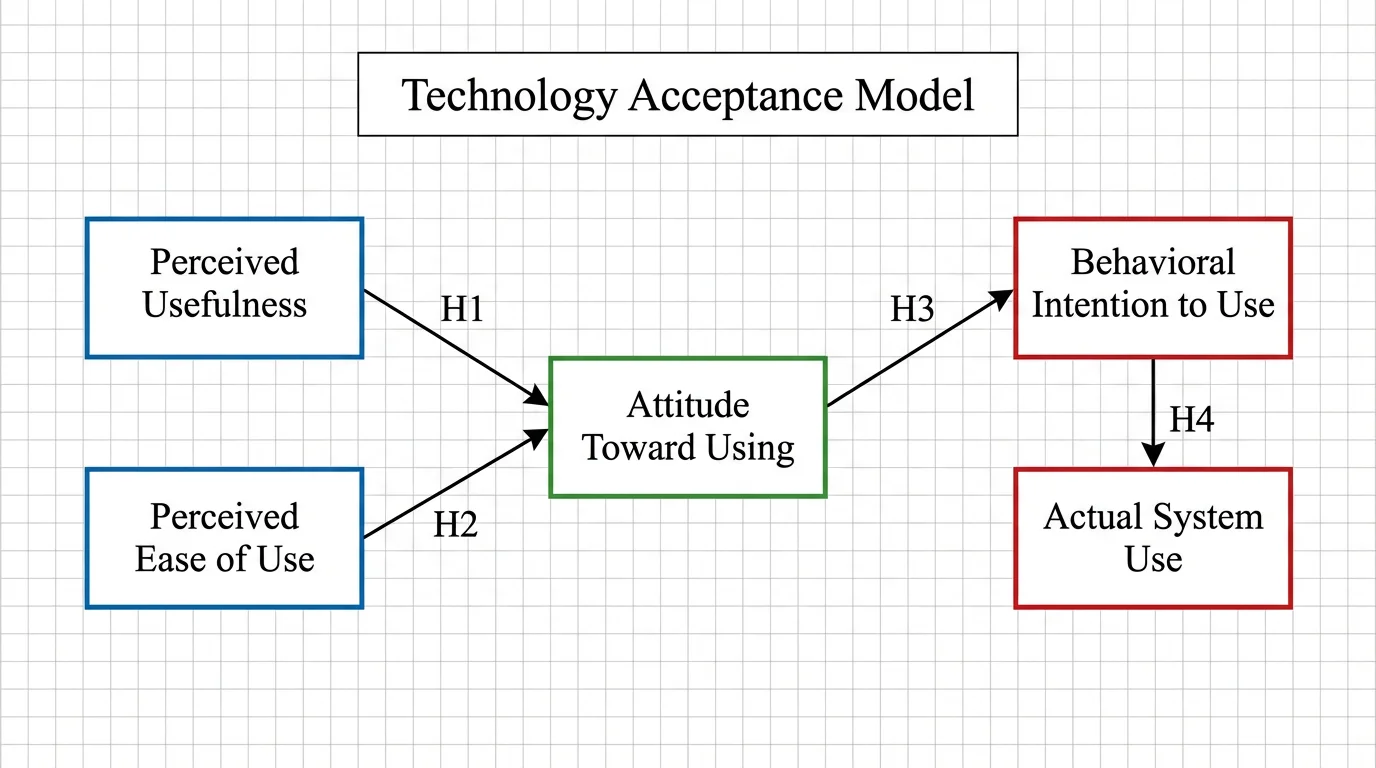
Conceptual Framework Generator
Map research variables and their relationships into a clear conceptual framework.
 Visualization
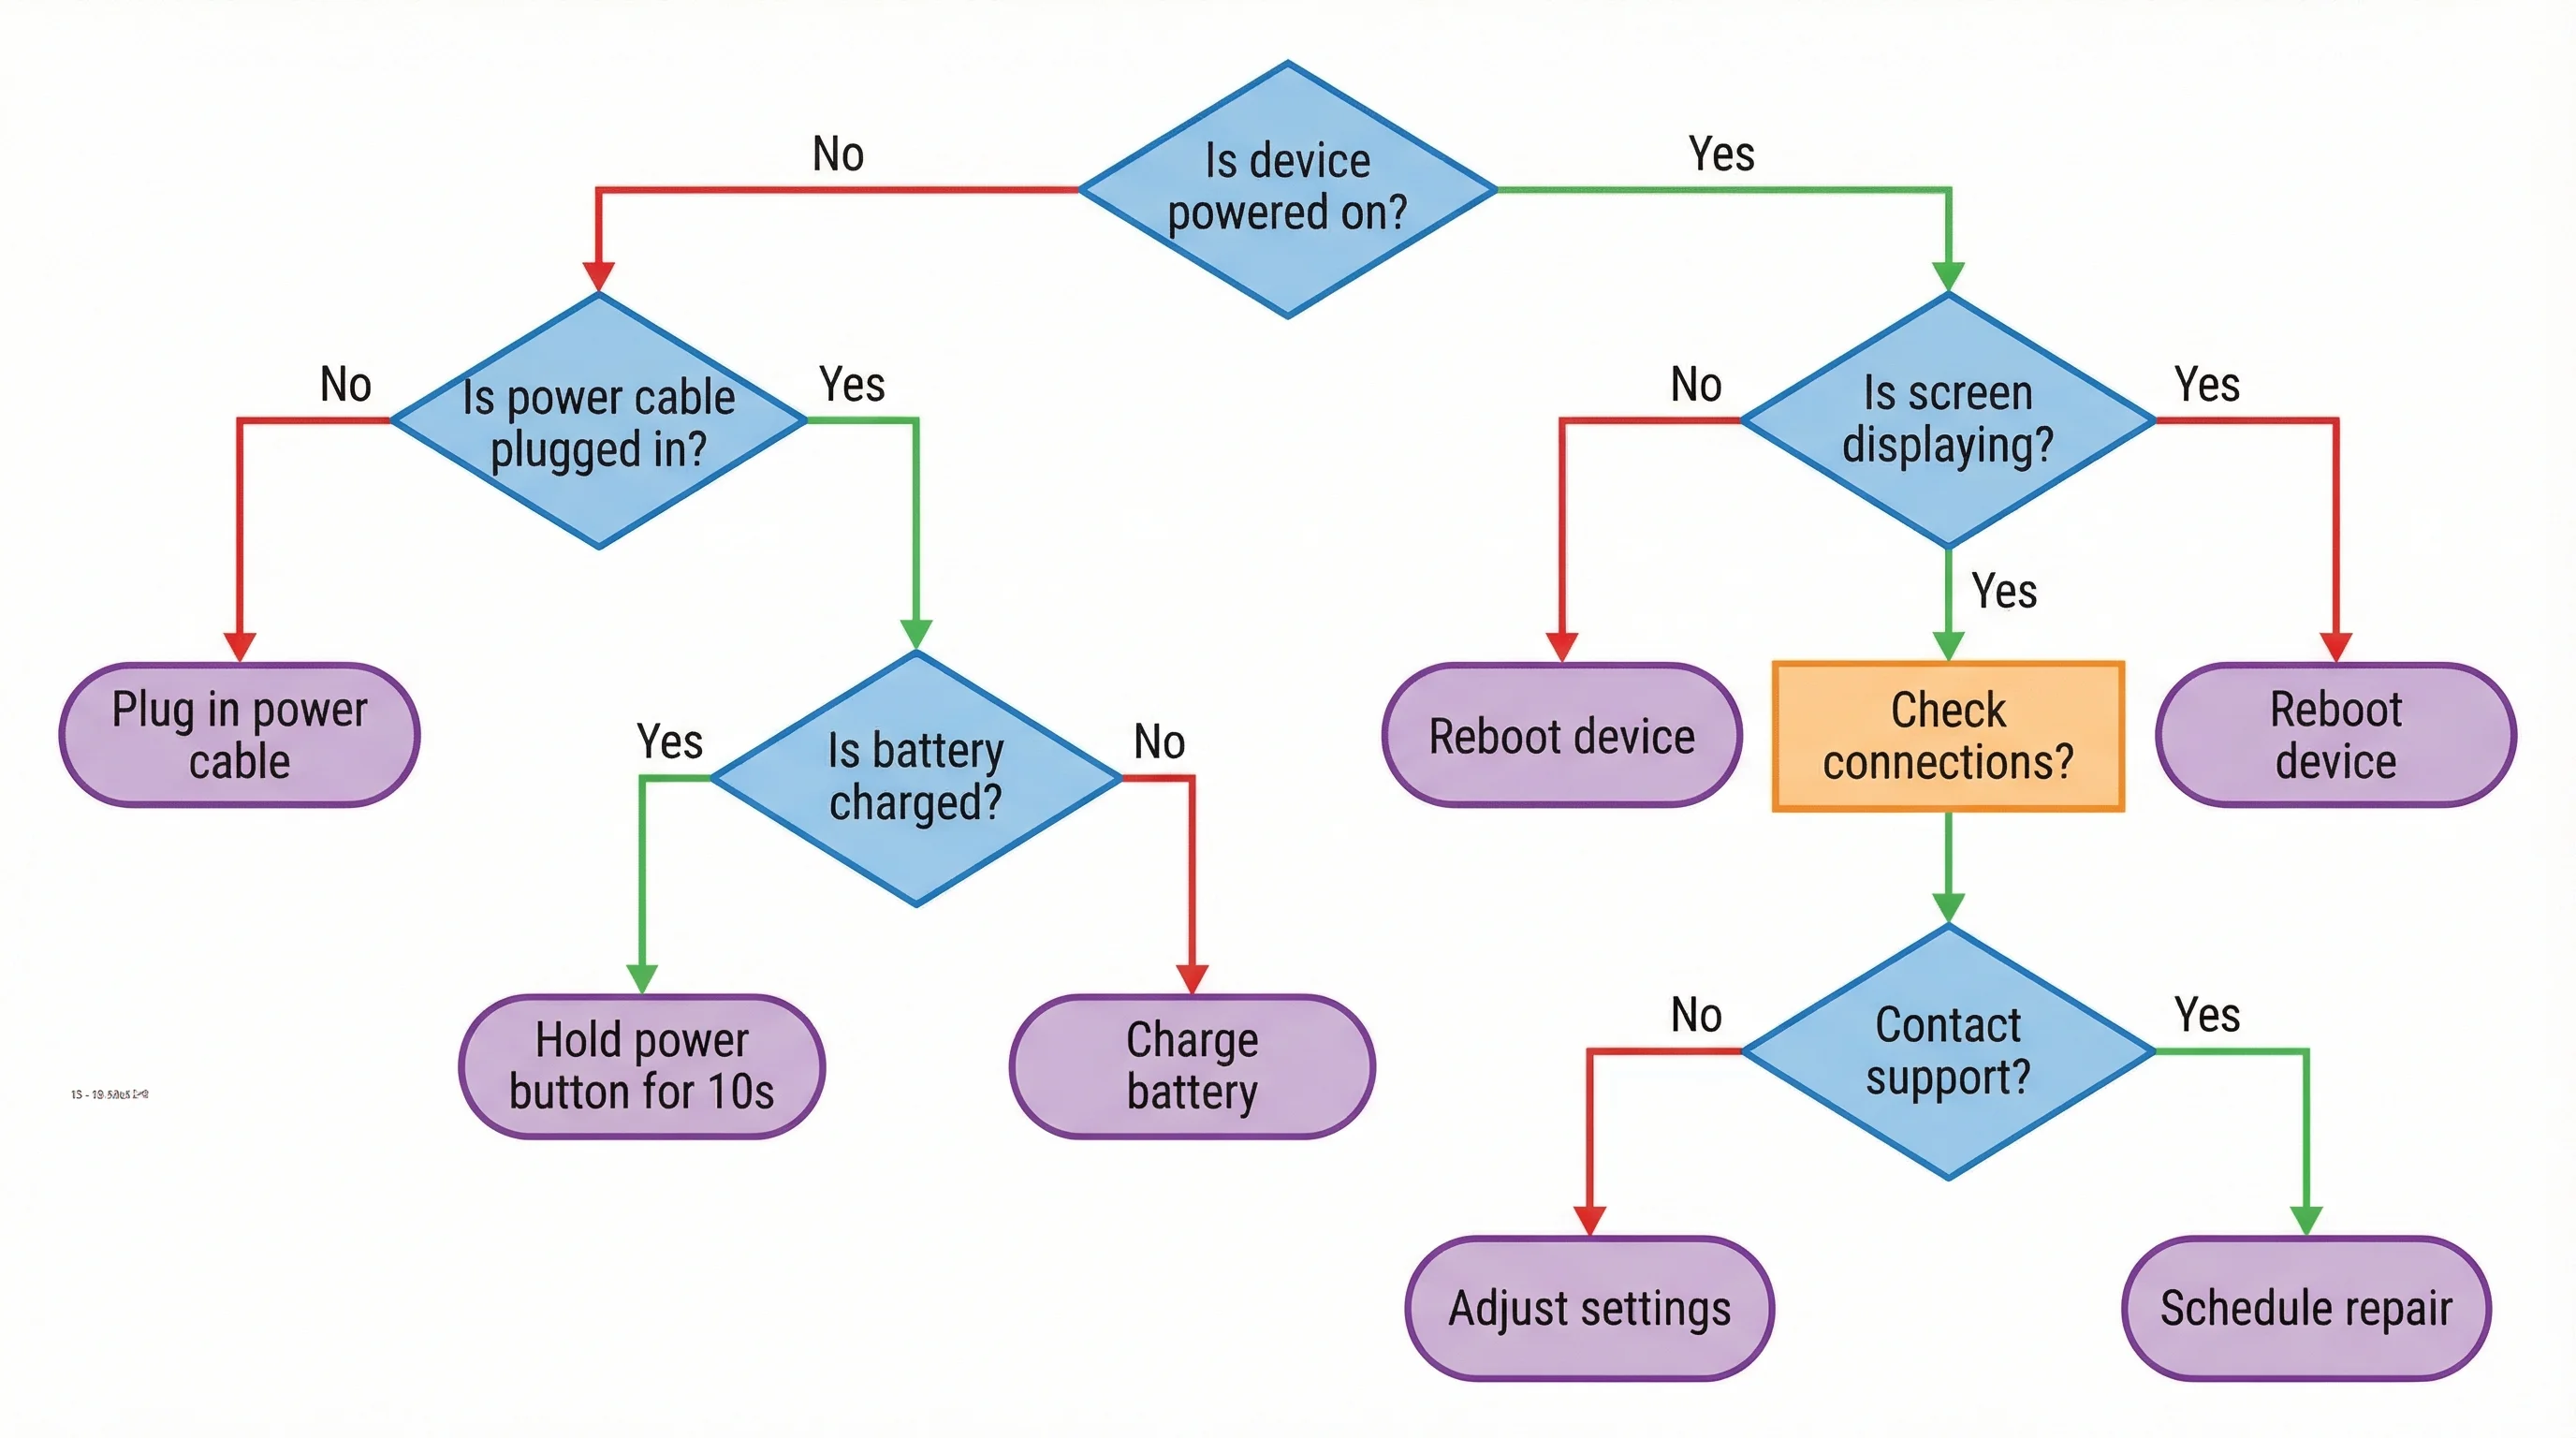
AI Flowchart Generator
Generate flowcharts from text descriptions for processes, workflows, and decisions.