Ecosystem Diagram Generator for Biotic, Abiotic & Trophic Levels
Generate a fully labeled ecosystem diagram in seconds. Show biotic and abiotic components, trophic levels, an energy pyramid, producers to tertiary consumers, decomposers, and nutrient cycling for pond, forest, or grassland habitats — labeled or blank for worksheets — then download free.
Ecosystem Diagram Generator
Free to try ·
Your diagram will appear here
Describe what you need and click Generate
Ecosystem Diagram Examples
Labeled ecosystem components, energy pyramids, and habitat diagrams
Ecosystem Components Labeled
A full ecosystem overview labeling every biotic (living) and abiotic (non-living) component — ideal for introducing the concept of an ecosystem.
Biotic vs Abiotic Factors
Biotic versus abiotic factors laid out side by side — the clearest way to teach the two categories that make up any ecosystem.
Energy Pyramid — Trophic Levels
An energy pyramid showing all four trophic levels with the 10% energy transfer rule — perfect for lessons on energy flow through an ecosystem.
Pond Ecosystem
A complete pond ecosystem with every trophic level labeled — from algae producers to heron tertiary consumers — plus key abiotic factors.
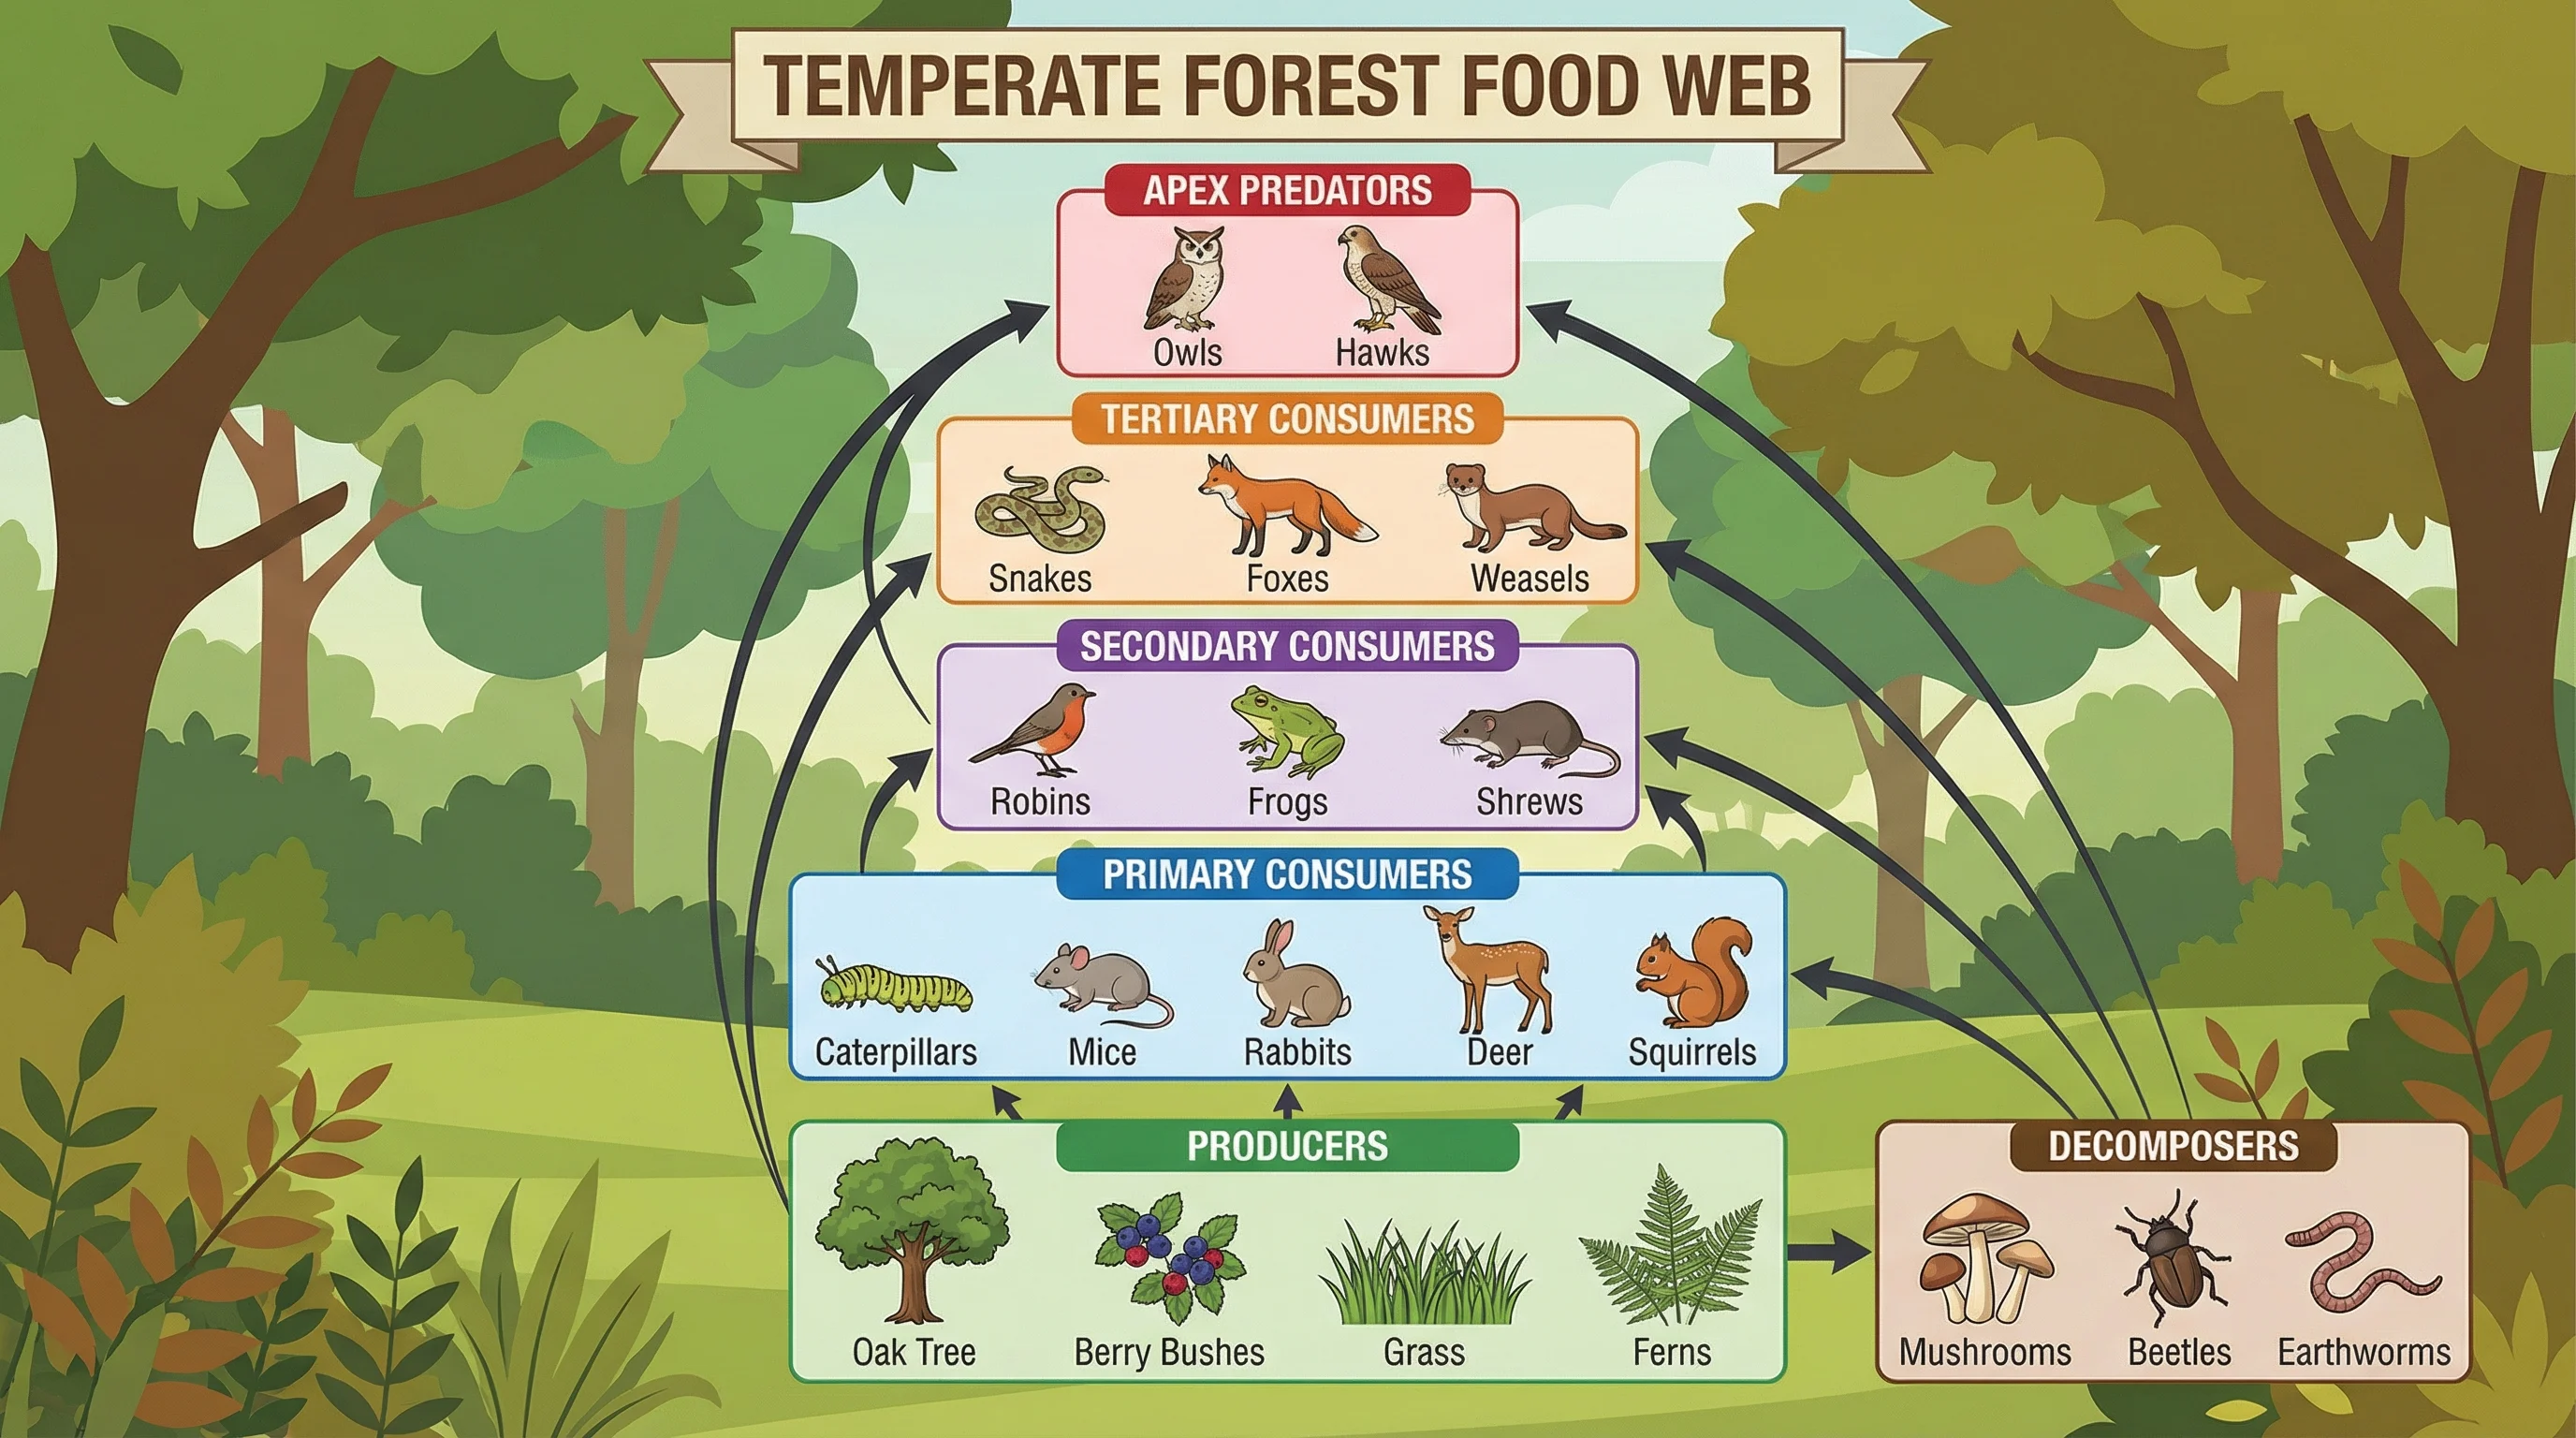
Forest Ecosystem
A temperate forest ecosystem from soil decomposers to apex predators, with biotic and abiotic factors clearly labeled.
Blank Ecosystem Worksheet
A printer-ready blank ecosystem worksheet — leader lines and trophic-level boxes without the answers, so students fill them in.
What is an ecosystem?
An ecosystem is a community of living organisms (biotic factors) interacting with each other and with their non-living environment (abiotic factors) as a functioning system. Biotic components include all the plants, animals, fungi, and bacteria in a habitat. Abiotic components include sunlight, temperature, water, soil, and air. The two sets of components are deeply linked: sunlight and soil nutrients determine which plants grow, the plants support which animals can live there, and the animals and decomposers recycle nutrients back into the soil. An ecosystem diagram shows all of these relationships in one labeled view, making it easy to see the whole system at once.
Biotic vs abiotic factors
- Biotic factors — all living things in the ecosystem:
- Producers (autotrophs): plants, algae, and photosynthetic bacteria that capture sunlight energy and make their own food.
- Primary consumers (herbivores): animals that eat producers directly, such as deer, grasshoppers, and rabbits.
- Secondary consumers: animals that eat primary consumers, such as frogs, foxes, and small fish.
- Tertiary consumers (apex predators): animals at the top of the food chain that eat secondary consumers, such as eagles, wolves, and large sharks.
- Decomposers and detritivores: fungi, bacteria, and invertebrates that break down dead organic matter and return nutrients to the soil.
- Abiotic factors — non-living components:
- Sunlight: the primary energy source that drives photosynthesis.
- Water and rainfall: determine the type of habitat and which organisms can survive.
- Temperature: shapes which species can live in a habitat and how fast chemical reactions occur.
- Soil and minerals: provide nutrients that producers need to grow.
- Air and dissolved gases: oxygen and carbon dioxide essential for respiration and photosynthesis.
Trophic levels and the energy pyramid
A trophic level is the position an organism occupies in the food chain, and the energy pyramid shows how much energy is available at each level. Producers form the wide base because they capture the most energy from sunlight. Primary consumers are above them, secondary consumers above that, and tertiary consumers sit at the narrow apex. Only about 10% of the energy at one trophic level passes to the next — the rest is lost as heat during respiration. This 10% rule explains why ecosystems support many more plants than herbivores, and many more herbivores than top predators. Drawing an energy pyramid makes this principle immediately visible and is one of the most tested concepts in ecology.
Nutrient cycling within an ecosystem
While energy flows through an ecosystem in one direction (sun → producers → consumers → decomposers → heat), nutrients cycle continuously. Decomposers — mainly bacteria and fungi — break dead organisms and waste products down into simple molecules and return them to the soil and water. Producers then absorb these nutrients to grow, passing them up the food chain again. The carbon cycle, nitrogen cycle, and water cycle are all examples of nutrient cycling, and each one keeps the ecosystem running. An ecosystem diagram that includes decomposers and nutrient arrows shows students that matter is recycled even though energy is not.
Common ecosystem types: pond, forest, and grassland
Pond ecosystems are freshwater habitats where algae and aquatic plants are the main producers, and where energy flows from tiny zooplankton through fish to fish-eating birds. The dissolved oxygen level and water temperature are key abiotic factors. Forest ecosystems are dominated by trees that form a canopy shading the layers beneath them; energy flows from trees and shrubs through deer, squirrels, and insects to foxes, owls, and wolves. Soil quality and rainfall are the key abiotic drivers. Grassland ecosystems have grasses as the dominant producers, supporting large grazing herds (bison, wildebeest) that are hunted by carnivores (lions, wolves). Fire and rainfall regimes are the main abiotic controls. Each habitat type can be shown as a full labeled ecosystem diagram in this generator.
Labeled and blank ecosystem diagrams for worksheets
For teaching, it is useful to have two versions of the same ecosystem diagram. A fully labeled version names every producer, consumer, decomposer, and abiotic factor, and it is ideal for lesson slides and revision notes. A blank or unlabeled version keeps the shapes, arrows, and structure but removes the text, so students must fill in the names themselves — a powerful way to check understanding. Because this generator takes a plain-English description, you can ask for a labeled forest ecosystem diagram for the lesson, then immediately ask for a black-and-white blank version of the same layout for the worksheet — no redrawing required.
Frequently Asked Questions
Related Biology Tools
 Biology
Food Web Maker
Map the full network of feeding relationships between organisms in an ecosystem — who eats whom across multiple chains.
 Biology
Food Chain Diagram Generator
Create a clear step-by-step food chain from producer to apex predator with labeled trophic levels.
 Biology
Carbon Cycle Diagram Generator
Illustrate how carbon moves through the atmosphere, biosphere, oceans, and geosphere in a labeled cycle diagram.