Electronegativity Chart for Periodic Trends & Bond Type
Free electronegativity chart with atomic radius and ionization energy heatmaps, a highest to lowest list and a bond type calculator. PNG, SVG or print.
Property
Paper (landscape)
Printing
Electronegativity (Pauling scale). Hatched cells have no value. Scroll sideways on small screens and click an element for its details.
Click any element in the table to see its atomic weight, common ion charges, group, period and periodic trend values.
Free Electronegativity and Periodic Trend Charts
Every chart below is drawn from the same checked data as the tool above. View, download and print them free, no sign-up.
Electronegativity Chart on the Periodic Table
Pauling electronegativity for every element that has a value, with the two trend arrows.
Periodic trends
Printer friendly
Ranked lists
What is electronegativity?
Electronegativity is a number that describes how strongly an atom pulls shared electrons toward itself in a chemical bond. This chart uses the Pauling scale, where fluorine is the highest at 3.98, oxygen is 3.44, chlorine 3.16 and nitrogen 3.04. The lowest values belong to the heavy alkali metals, with francium at 0.70 (estimated) and cesium at 0.79. Noble gases such as helium, neon and argon have no agreed Pauling value, so their cells are left empty instead of guessed. A few other elements, including promethium, europium, terbium, ytterbium, radon and everything from rutherfordium onward, are empty for the same reason.
The trends in one minute
- Across a period from left to right: electronegativity increases, ionization energy generally increases, and atomic radius decreases. Nuclear charge grows while electrons are added to the same shell, so the atom pulls harder and shrinks.
- Down a group from top to bottom: electronegativity decreases, ionization energy decreases, and atomic radius increases. More shells put the outer electrons farther from the nucleus.
- The two trend arrows on the heatmap point toward the higher values. Switch the property above and the arrows flip where the direction changes, for example for atomic radius.
Exceptions that show up on the chart
- Beryllium has a higher first ionization energy than boron (about 900 against 801 kJ/mol) because boron loses a 2p electron that is easier to remove than a 2s electron.
- Nitrogen has a higher first ionization energy than oxygen (about 1402 against 1314 kJ/mol) because oxygen has a paired electron in a 2p orbital that repels its partner.
- Noble gas covalent radii rest on very little data and are not directly comparable, so the neon value (58 pm) comes out slightly larger than fluorine (57 pm) instead of smaller. Many textbooks omit them from radius charts.
Using the difference to predict the bond type
Subtract the two electronegativities to get the difference. A common rule of thumb says a difference below 0.4 is nonpolar covalent, 0.4 to 1.8 is polar covalent, and above 1.8 is ionic. The bond type tab applies that rule to any two elements and shows the numbers. Sodium chloride gives 2.23 and is ionic, hydrogen chloride gives 0.96 and is polar covalent, and carbon to hydrogen gives 0.35 and is nonpolar. Treat the result as an approximation. Some courses use 1.7 or 2.0 as the ionic cutoff, and two metals bond metallically whatever the difference.
Which values this chart uses
Electronegativity values are Pauling values from PubChem, checked against Wikipedia data pages. Where sources did not agree on a value, the cell is left empty. Atomic radius is the covalent radius, single bond, from Cordero and coworkers (2008), published up to curium. Mn, Fe and Co use low-spin values and carbon uses the sp3 value. Ionization energy is the first ionization energy in kJ/mol, converted from the electronvolt values in the NIST Atomic Spectra Database. Lead is shown at 2.33, the Pauling value for lead(IV), while lead(II) is about 1.87. Values for francium and for americium to lawrencium are estimates and carry an asterisk, and cells with no agreed value stay empty.
Frequently Asked Questions
Related Chemistry Tools
 Chemistry
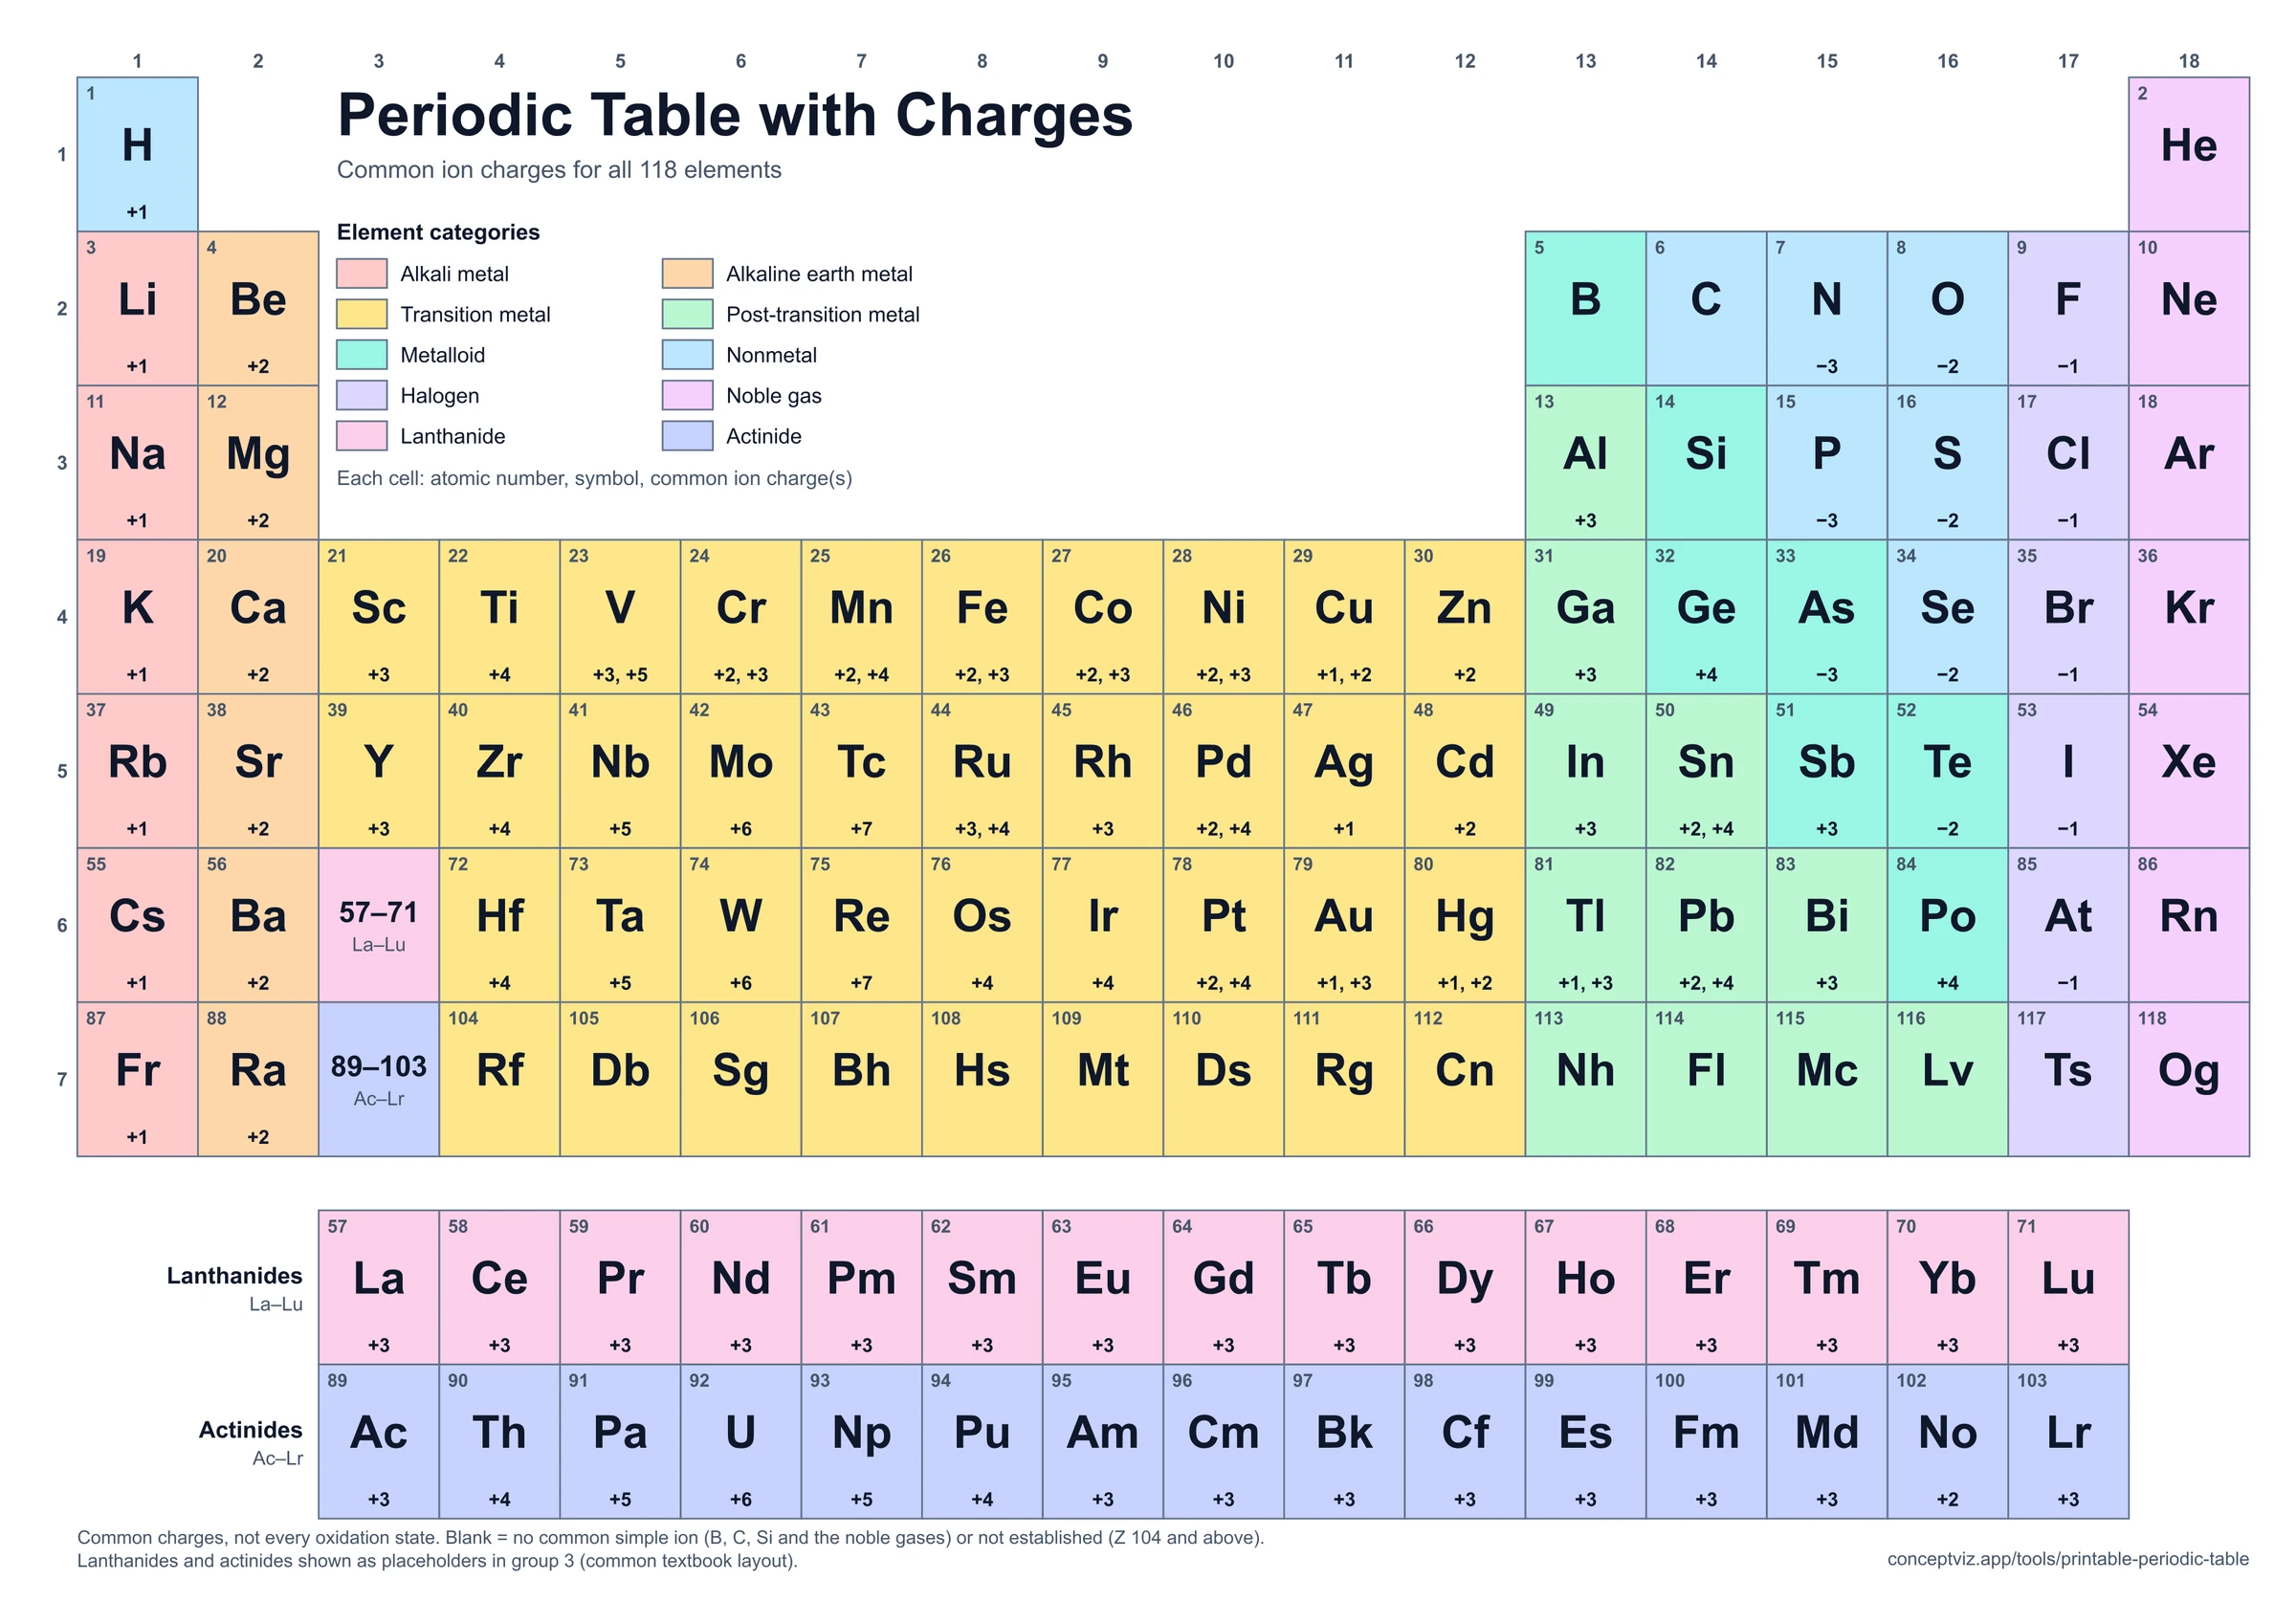
Printable Periodic Table
Periodic table with the common ion charge of every element, plus atomic mass and blank versions.
 Chemistry
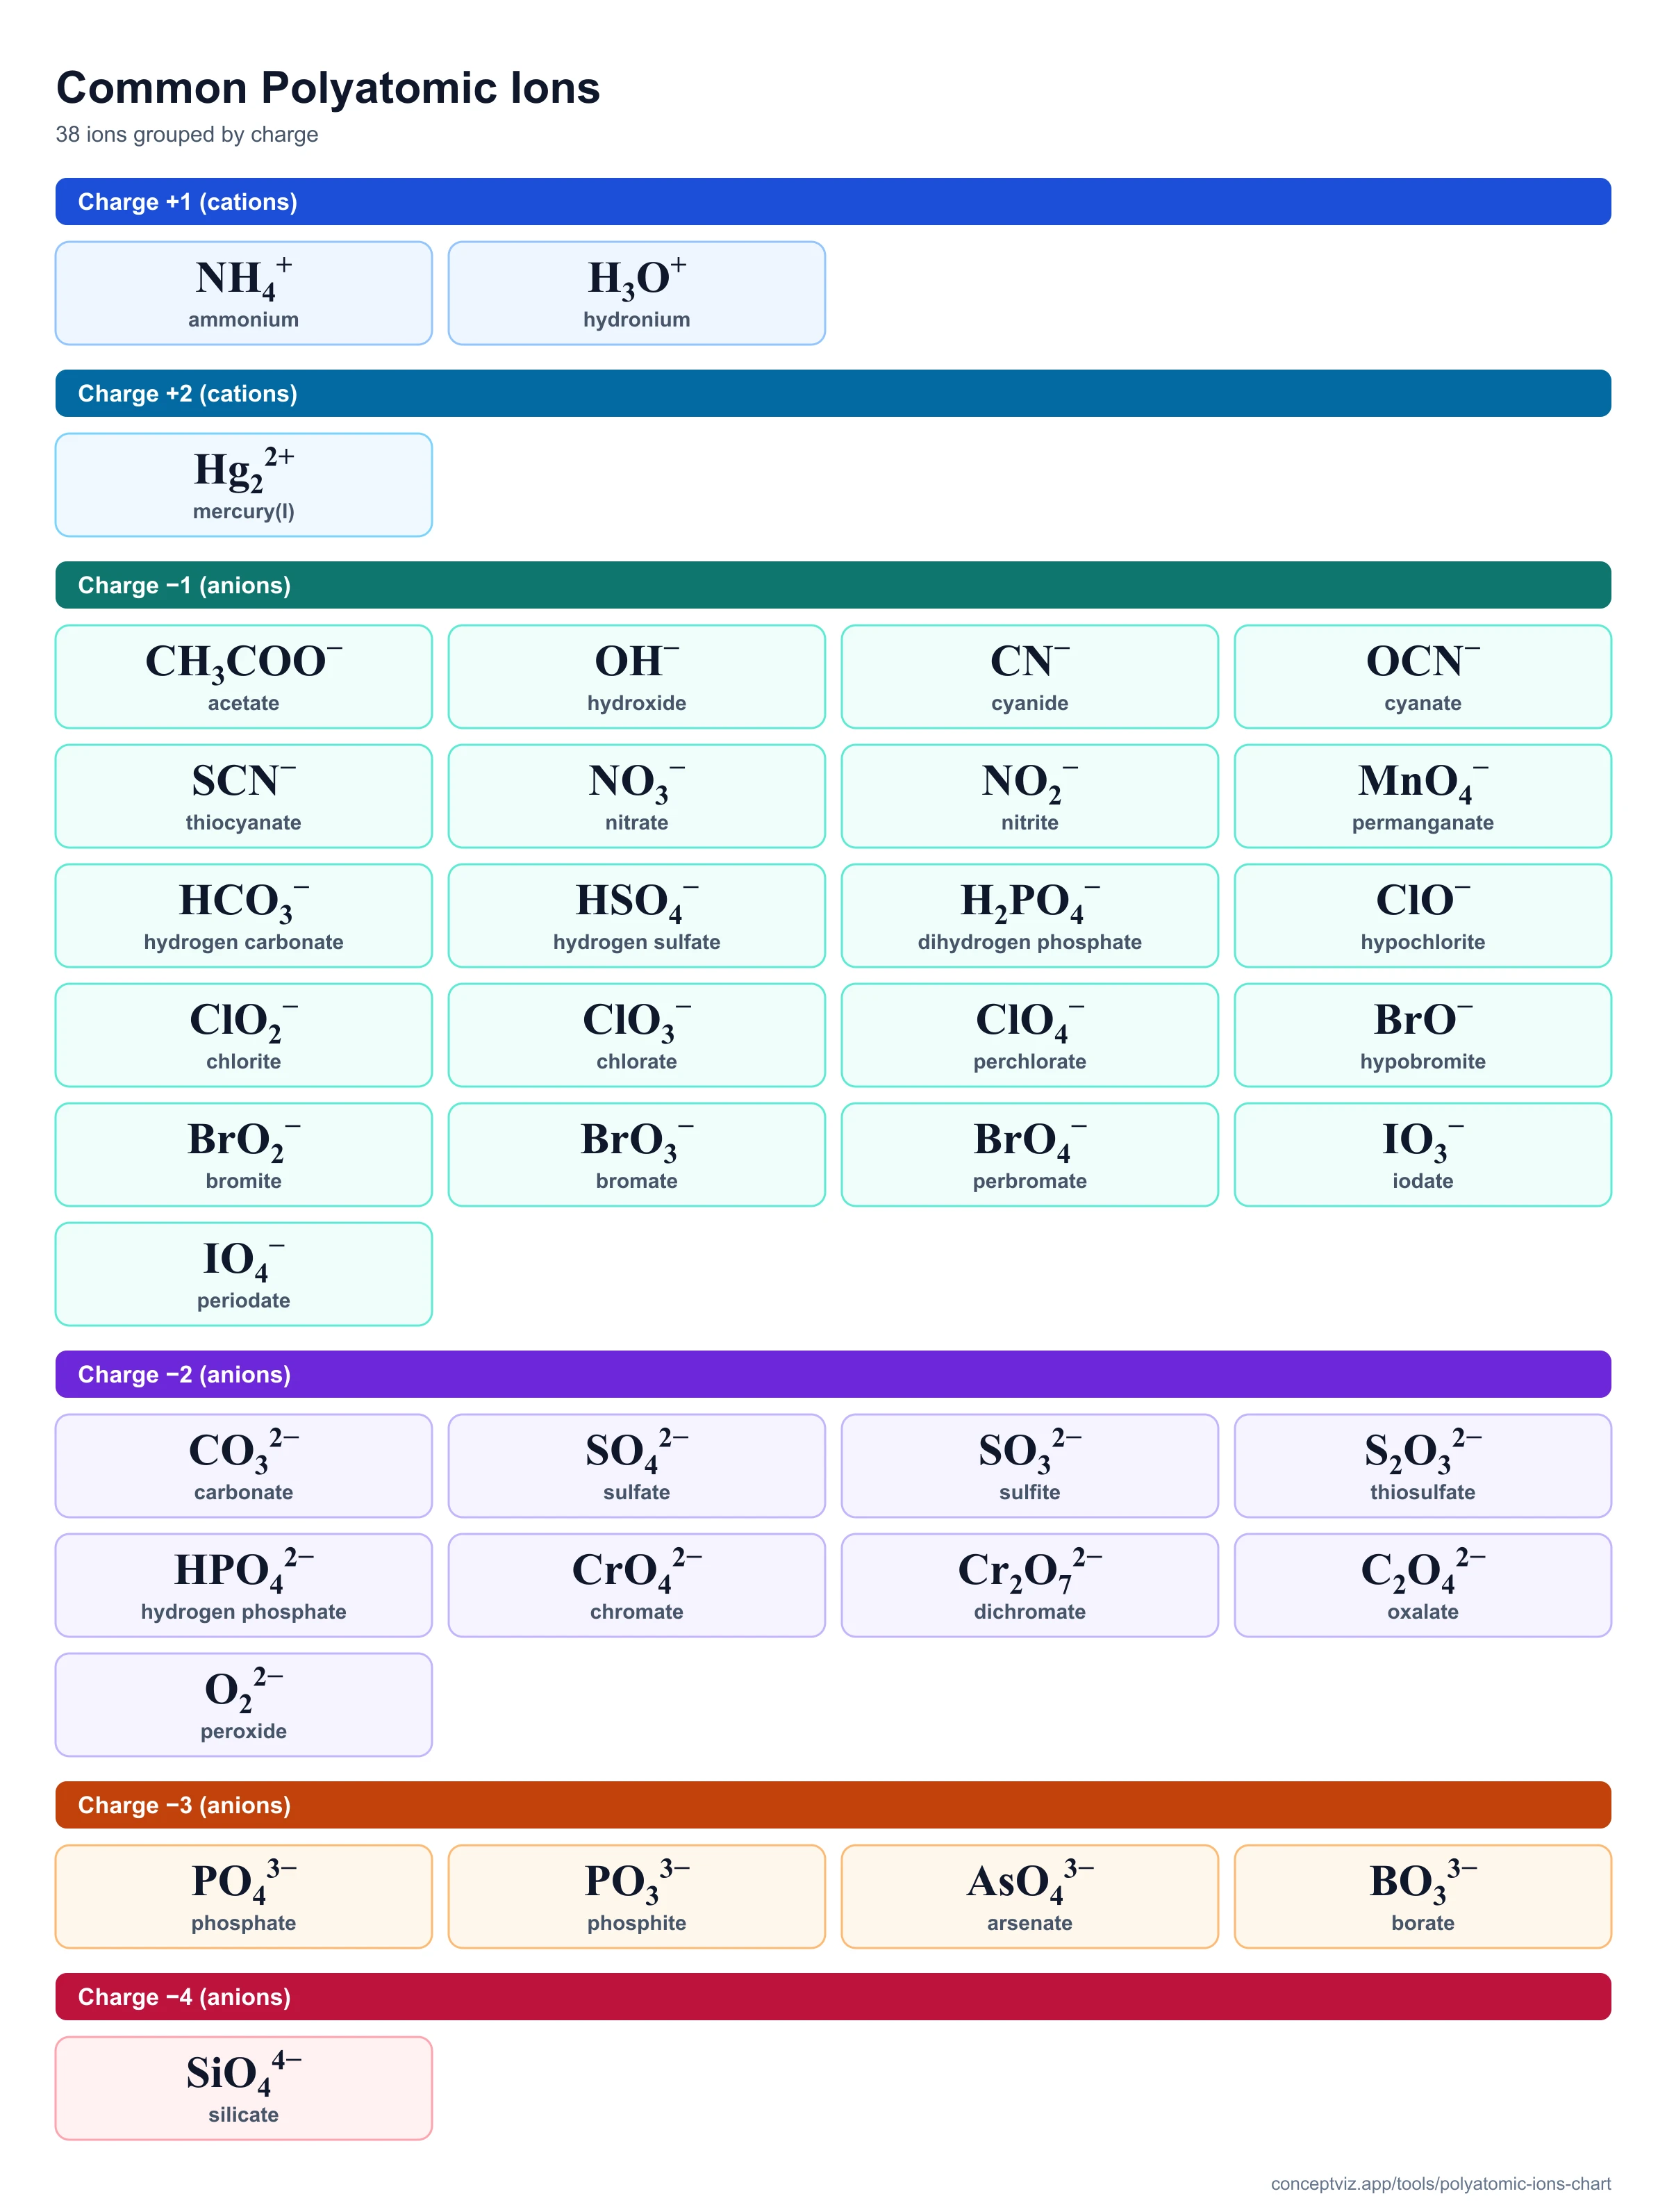
Polyatomic Ions Chart
Printable list of 38 common polyatomic ions with charges, naming rules and flashcards.
 Chemistry
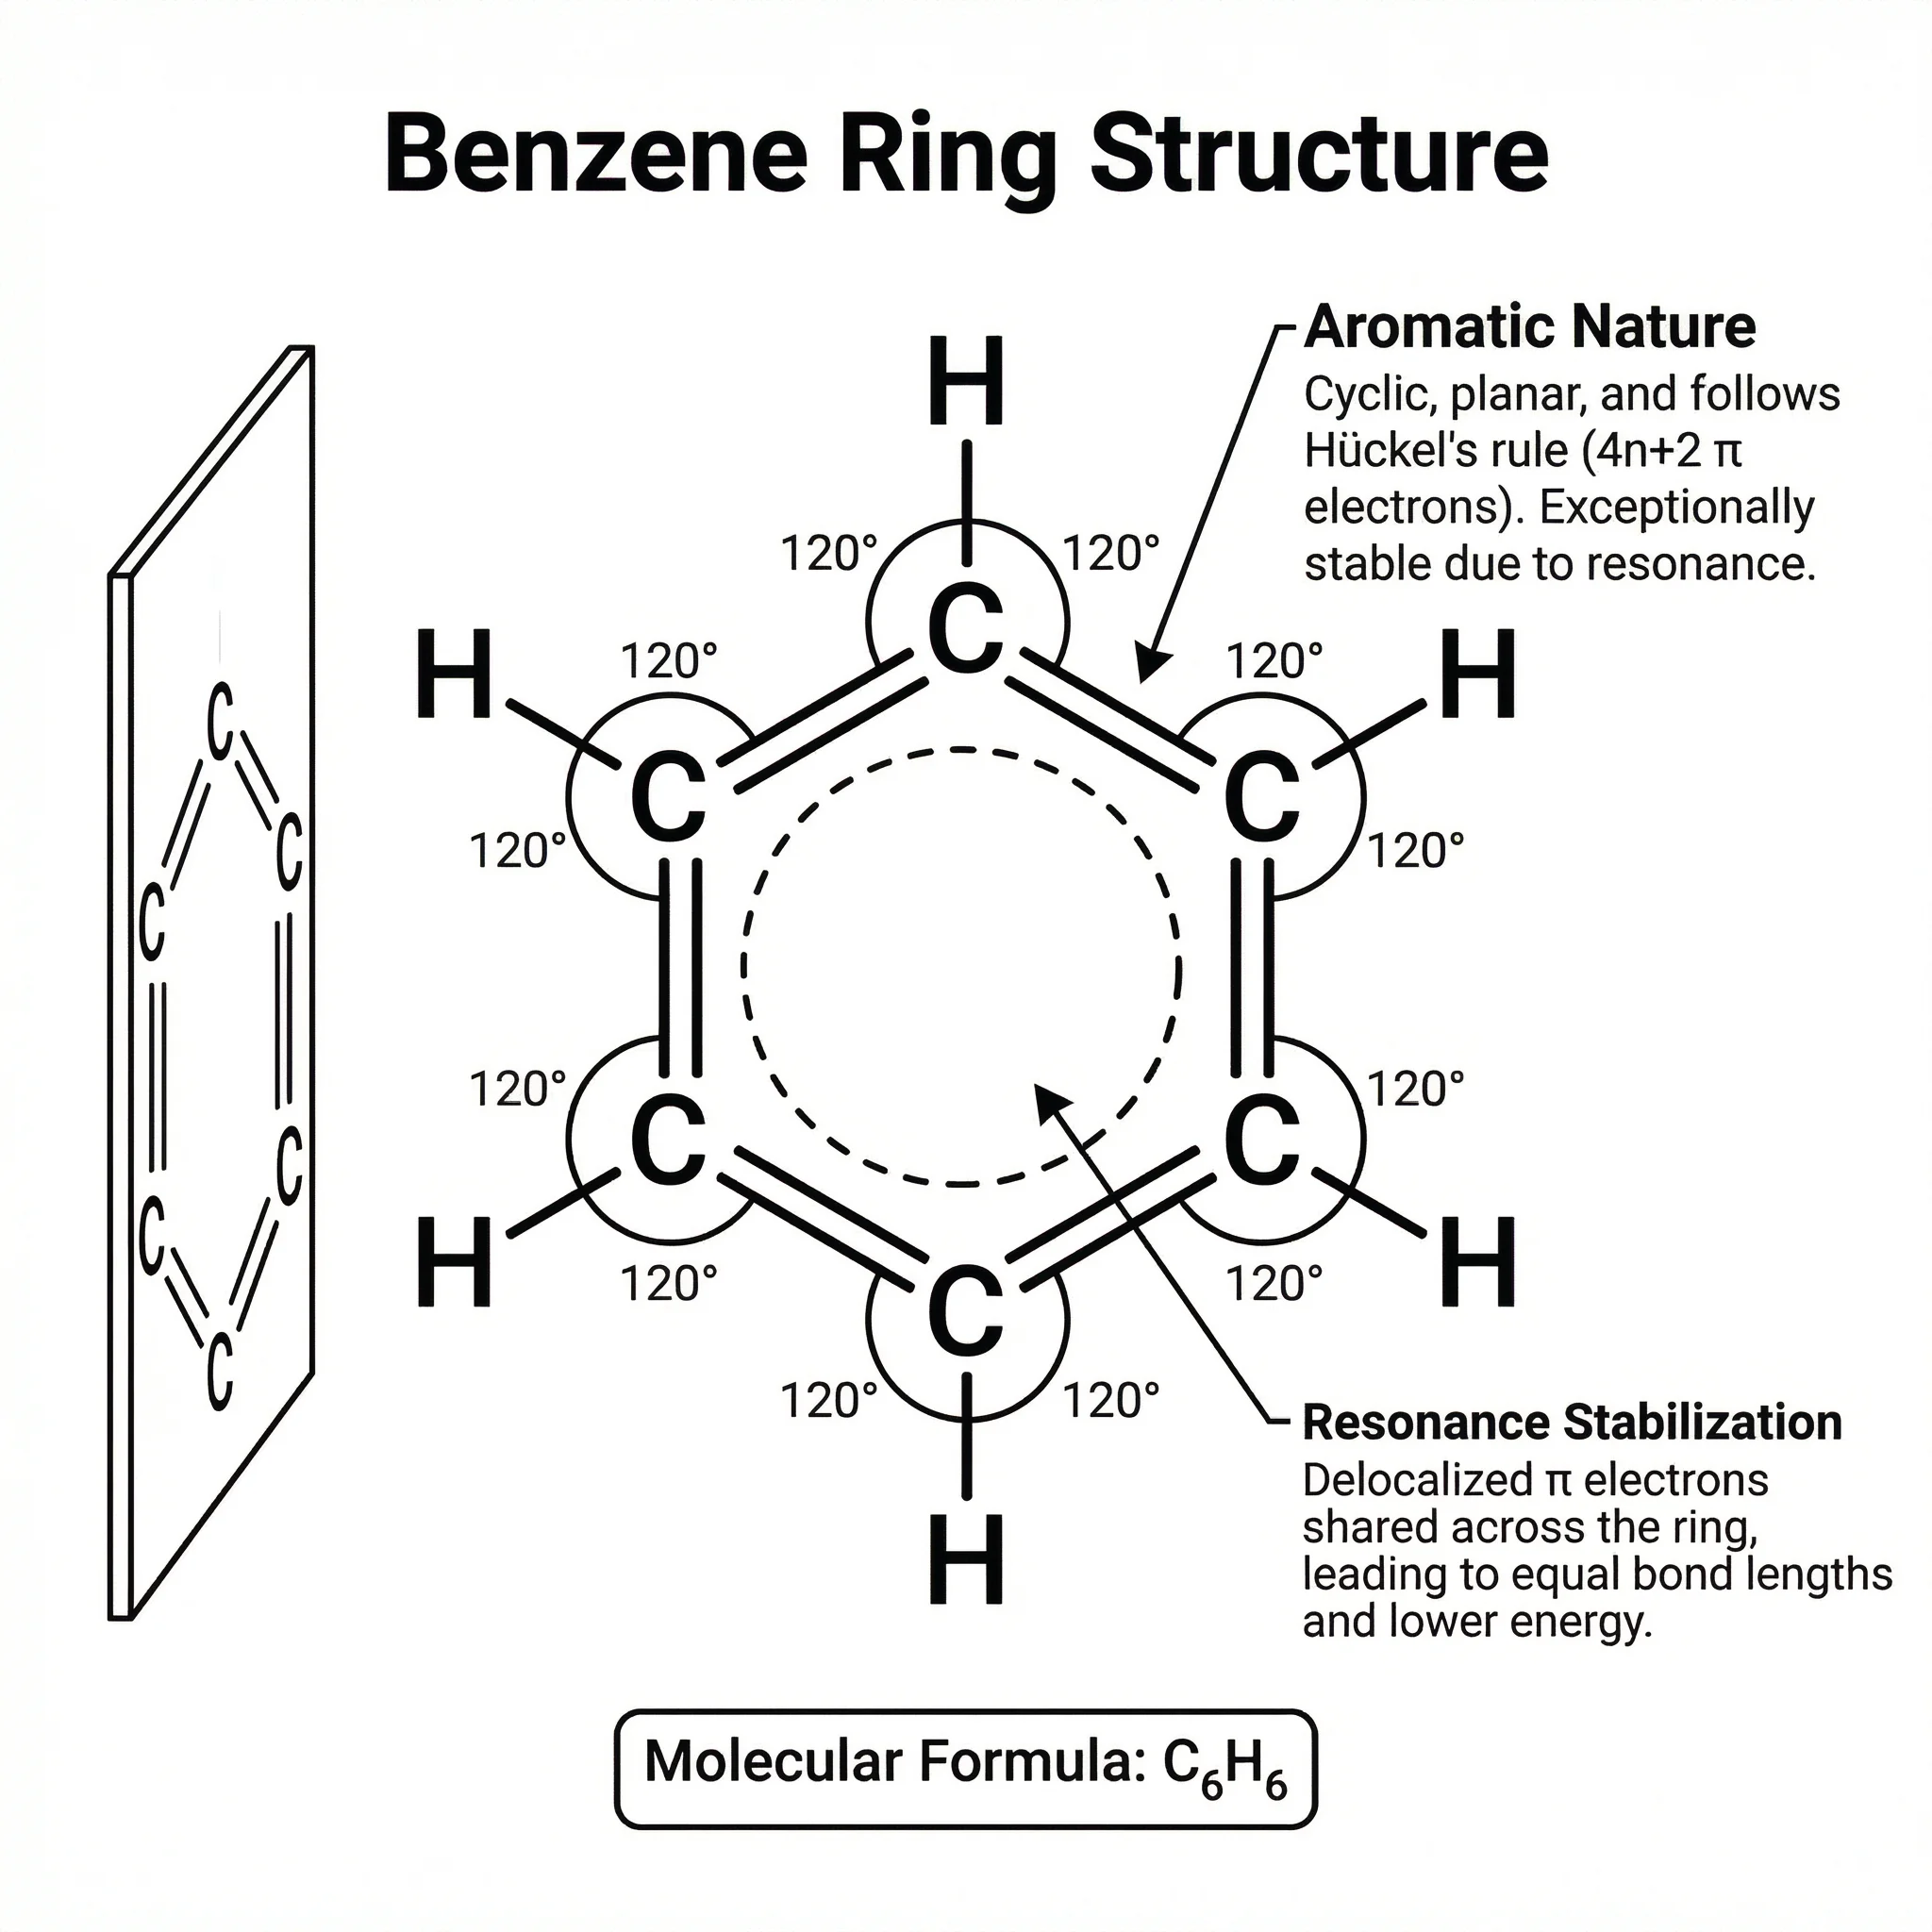
Lewis Dot Structure Generator
Create Lewis dot structures and valence electron diagrams for chemistry homework.