ブログ
STEM 教育者向けの指導のコツ、ツール比較、科学図解ガイド。AI による図の生成で、より良い授業教材を作成できます。
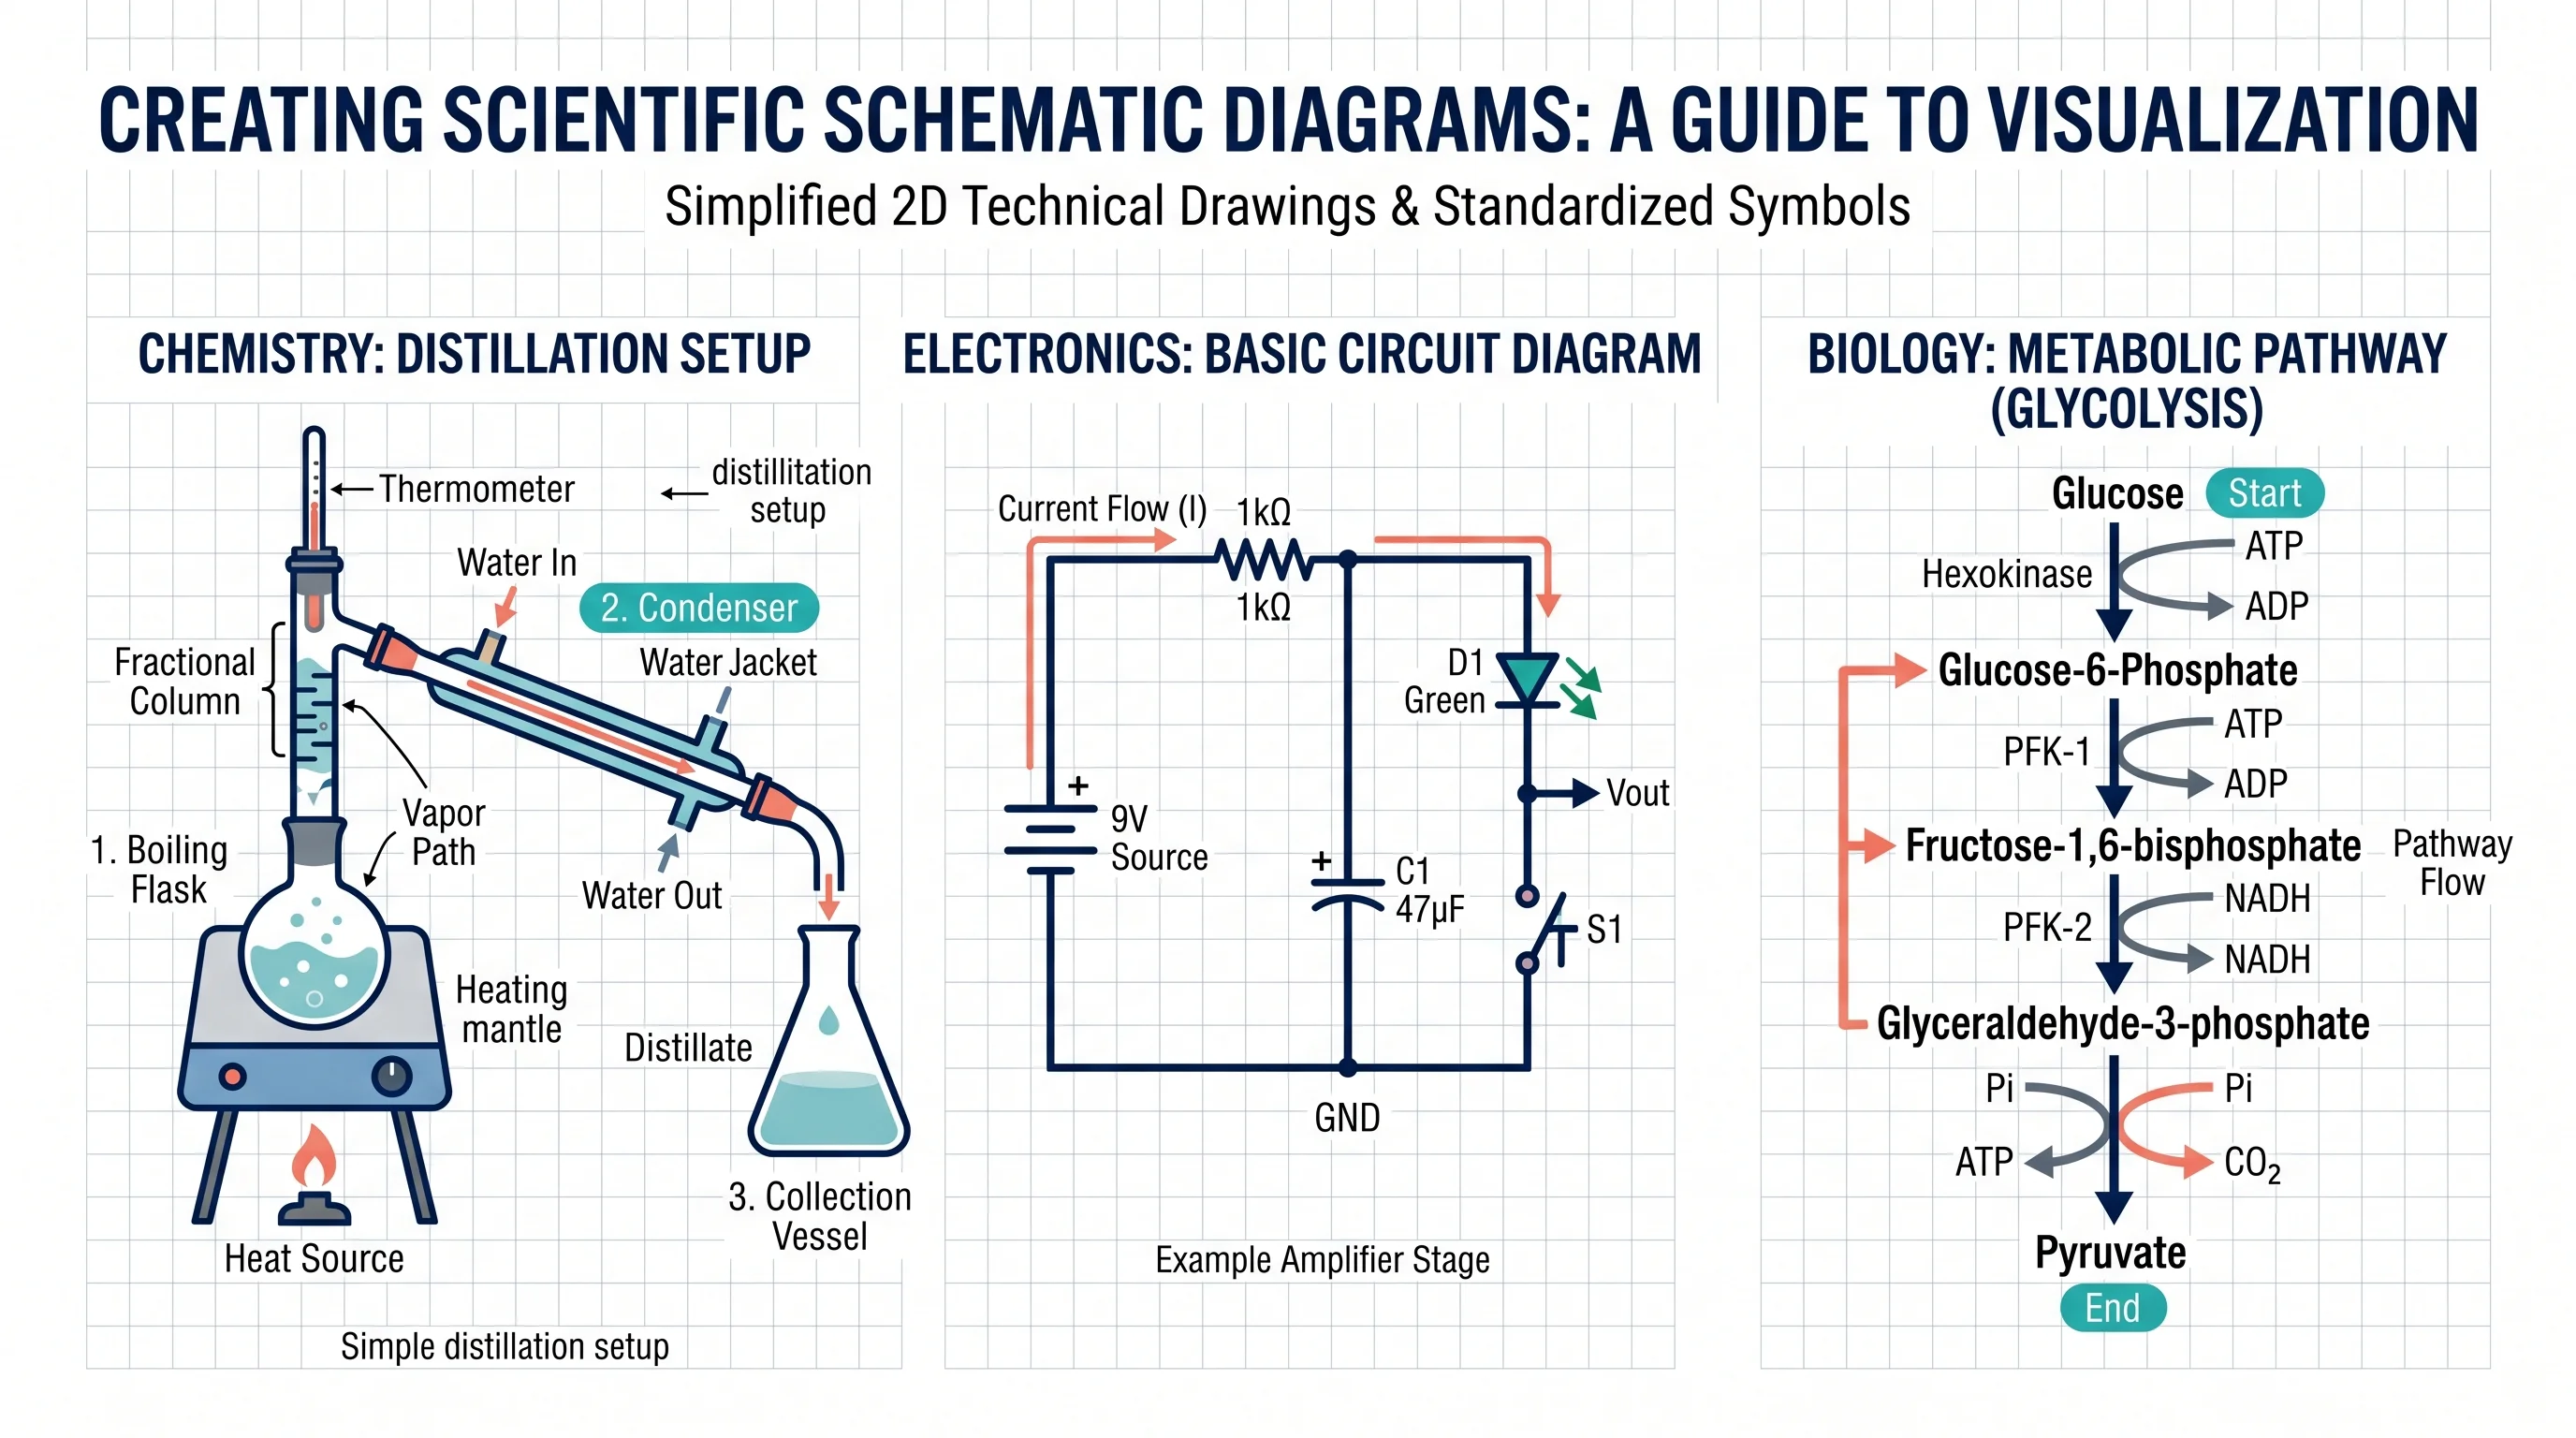
Schematic Diagram: Definition, Examples, How to Make One
What is a schematic diagram? Definition, lab and research examples, drawing rules and a step-by-step method, plus tools to make one quickly.
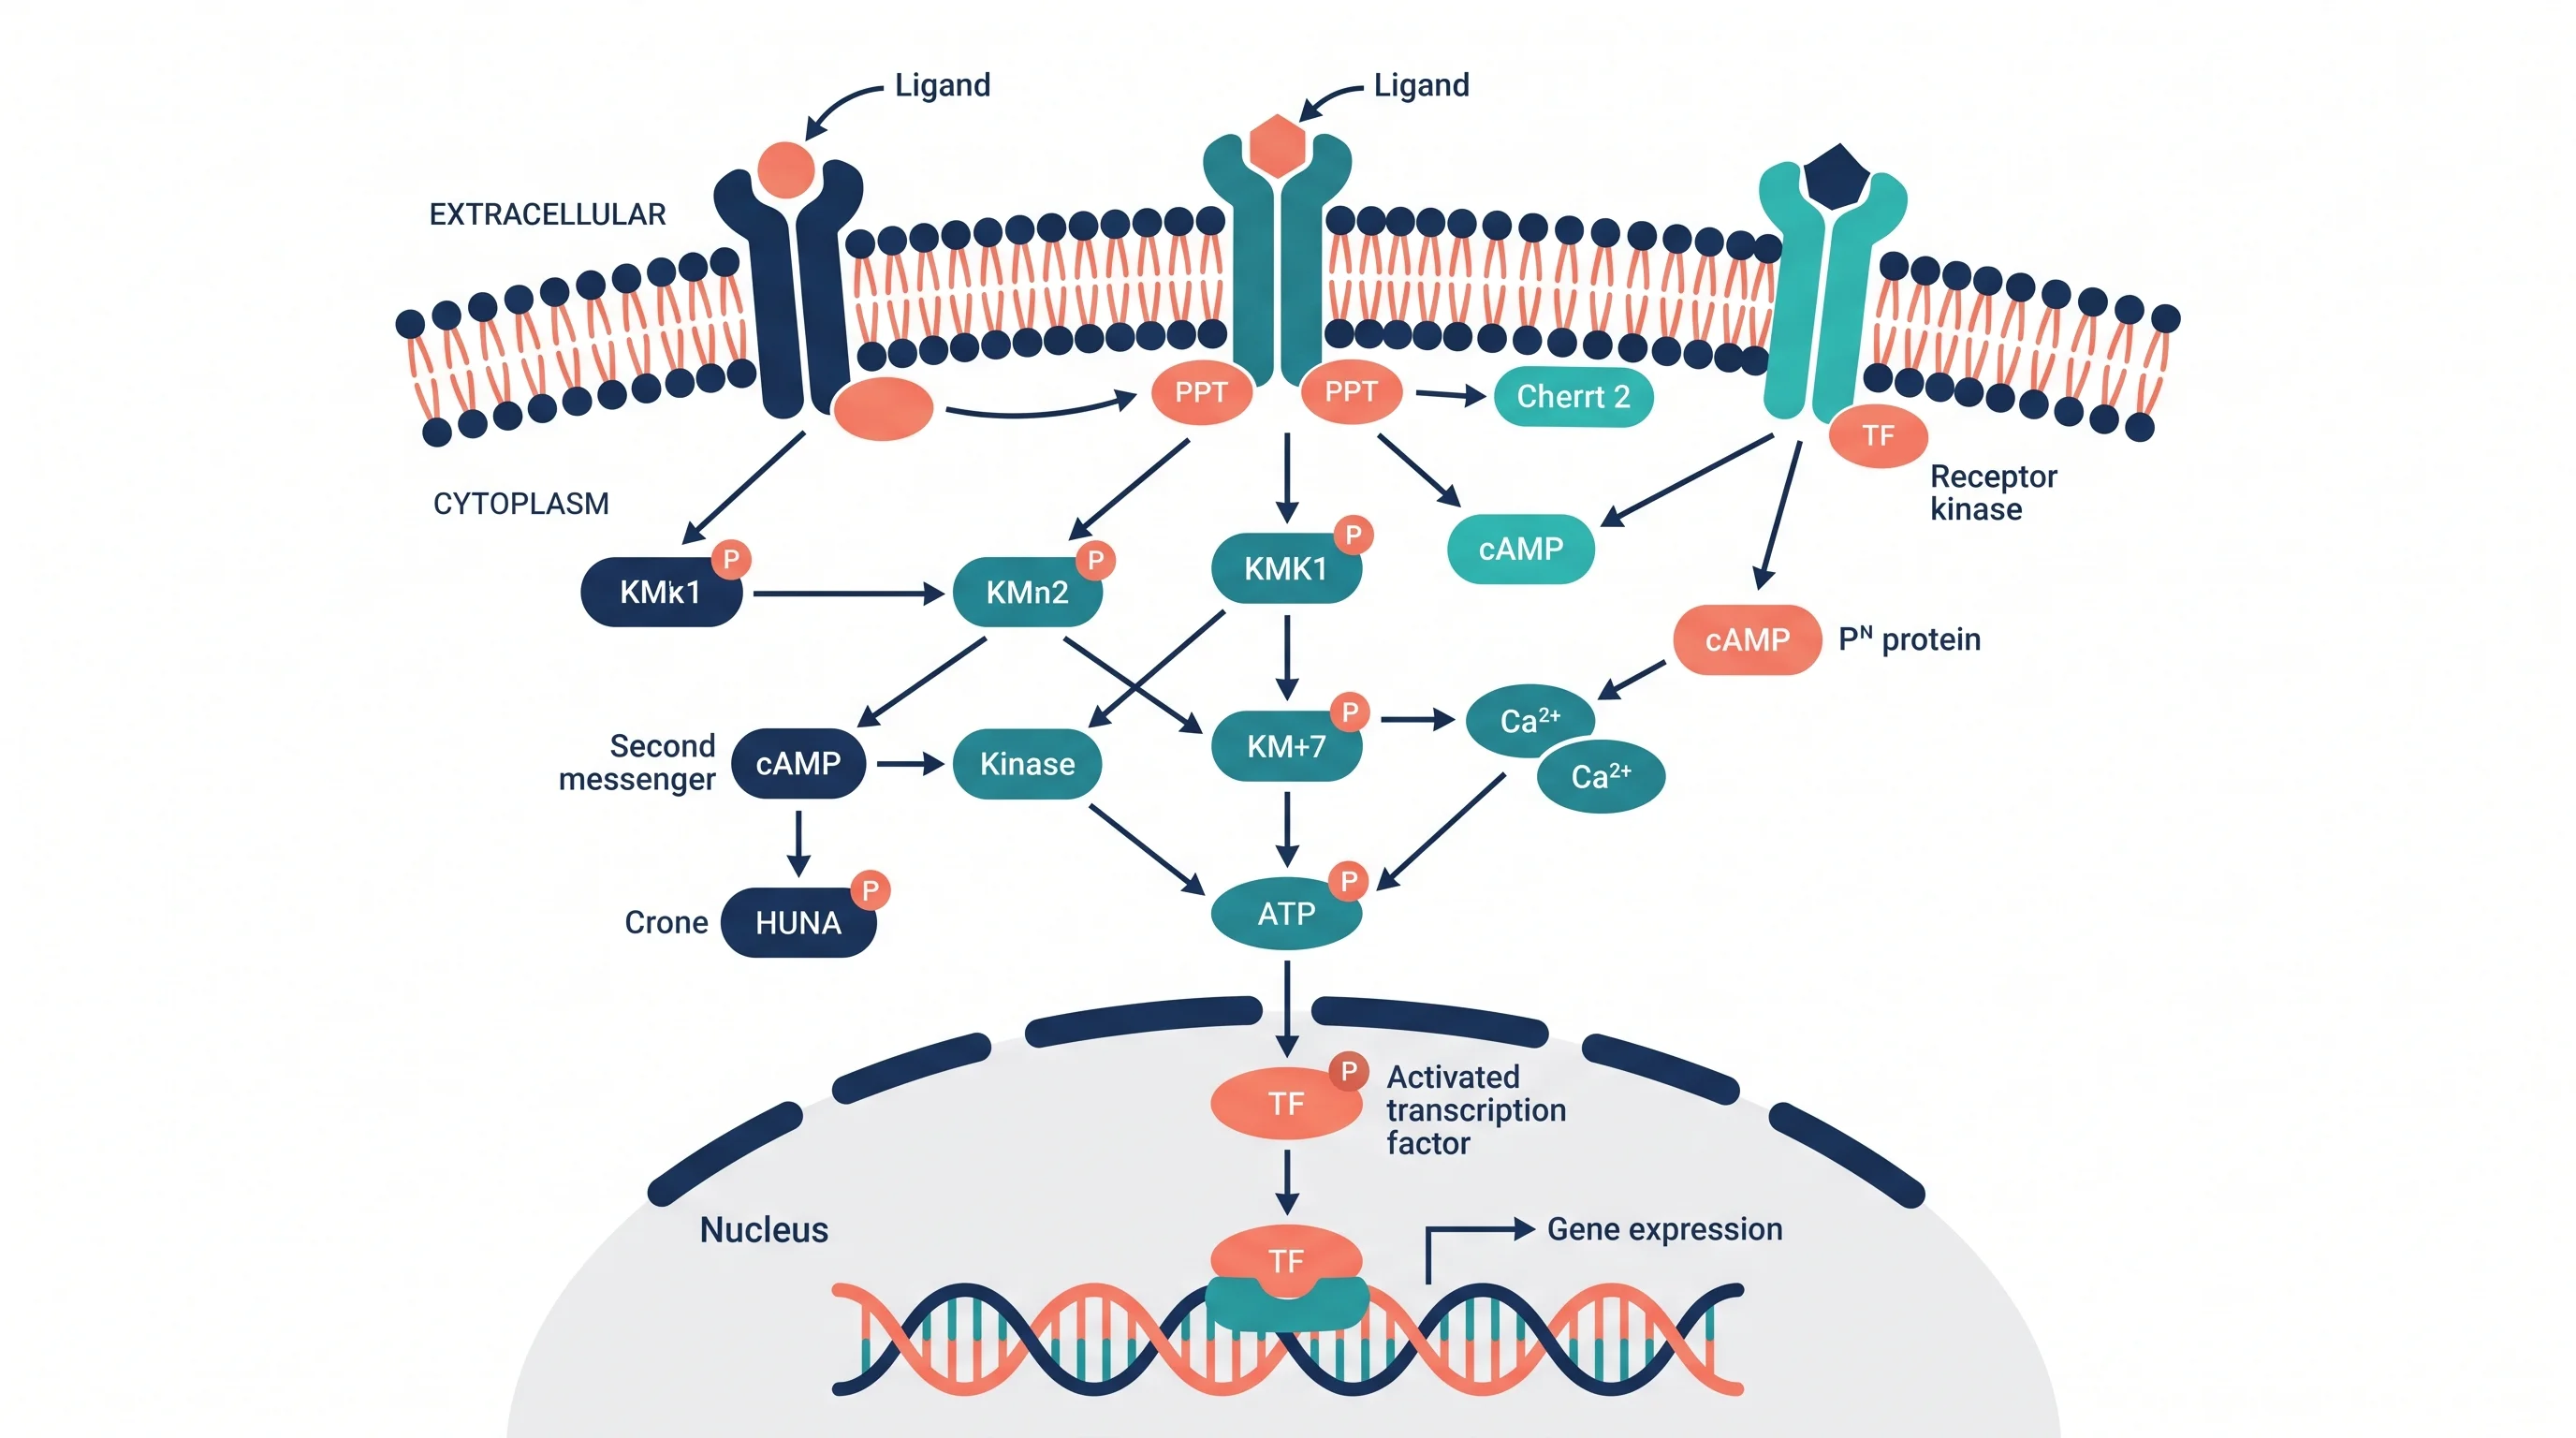
Signal Transduction Pathway Diagram: A Complete Guide for Biology Students and Researchers
Learn how to create signal transduction pathway diagrams for papers and presentations. Covers GPCR, RTK, MAPK, and Wnt pathways with tools and symbols.
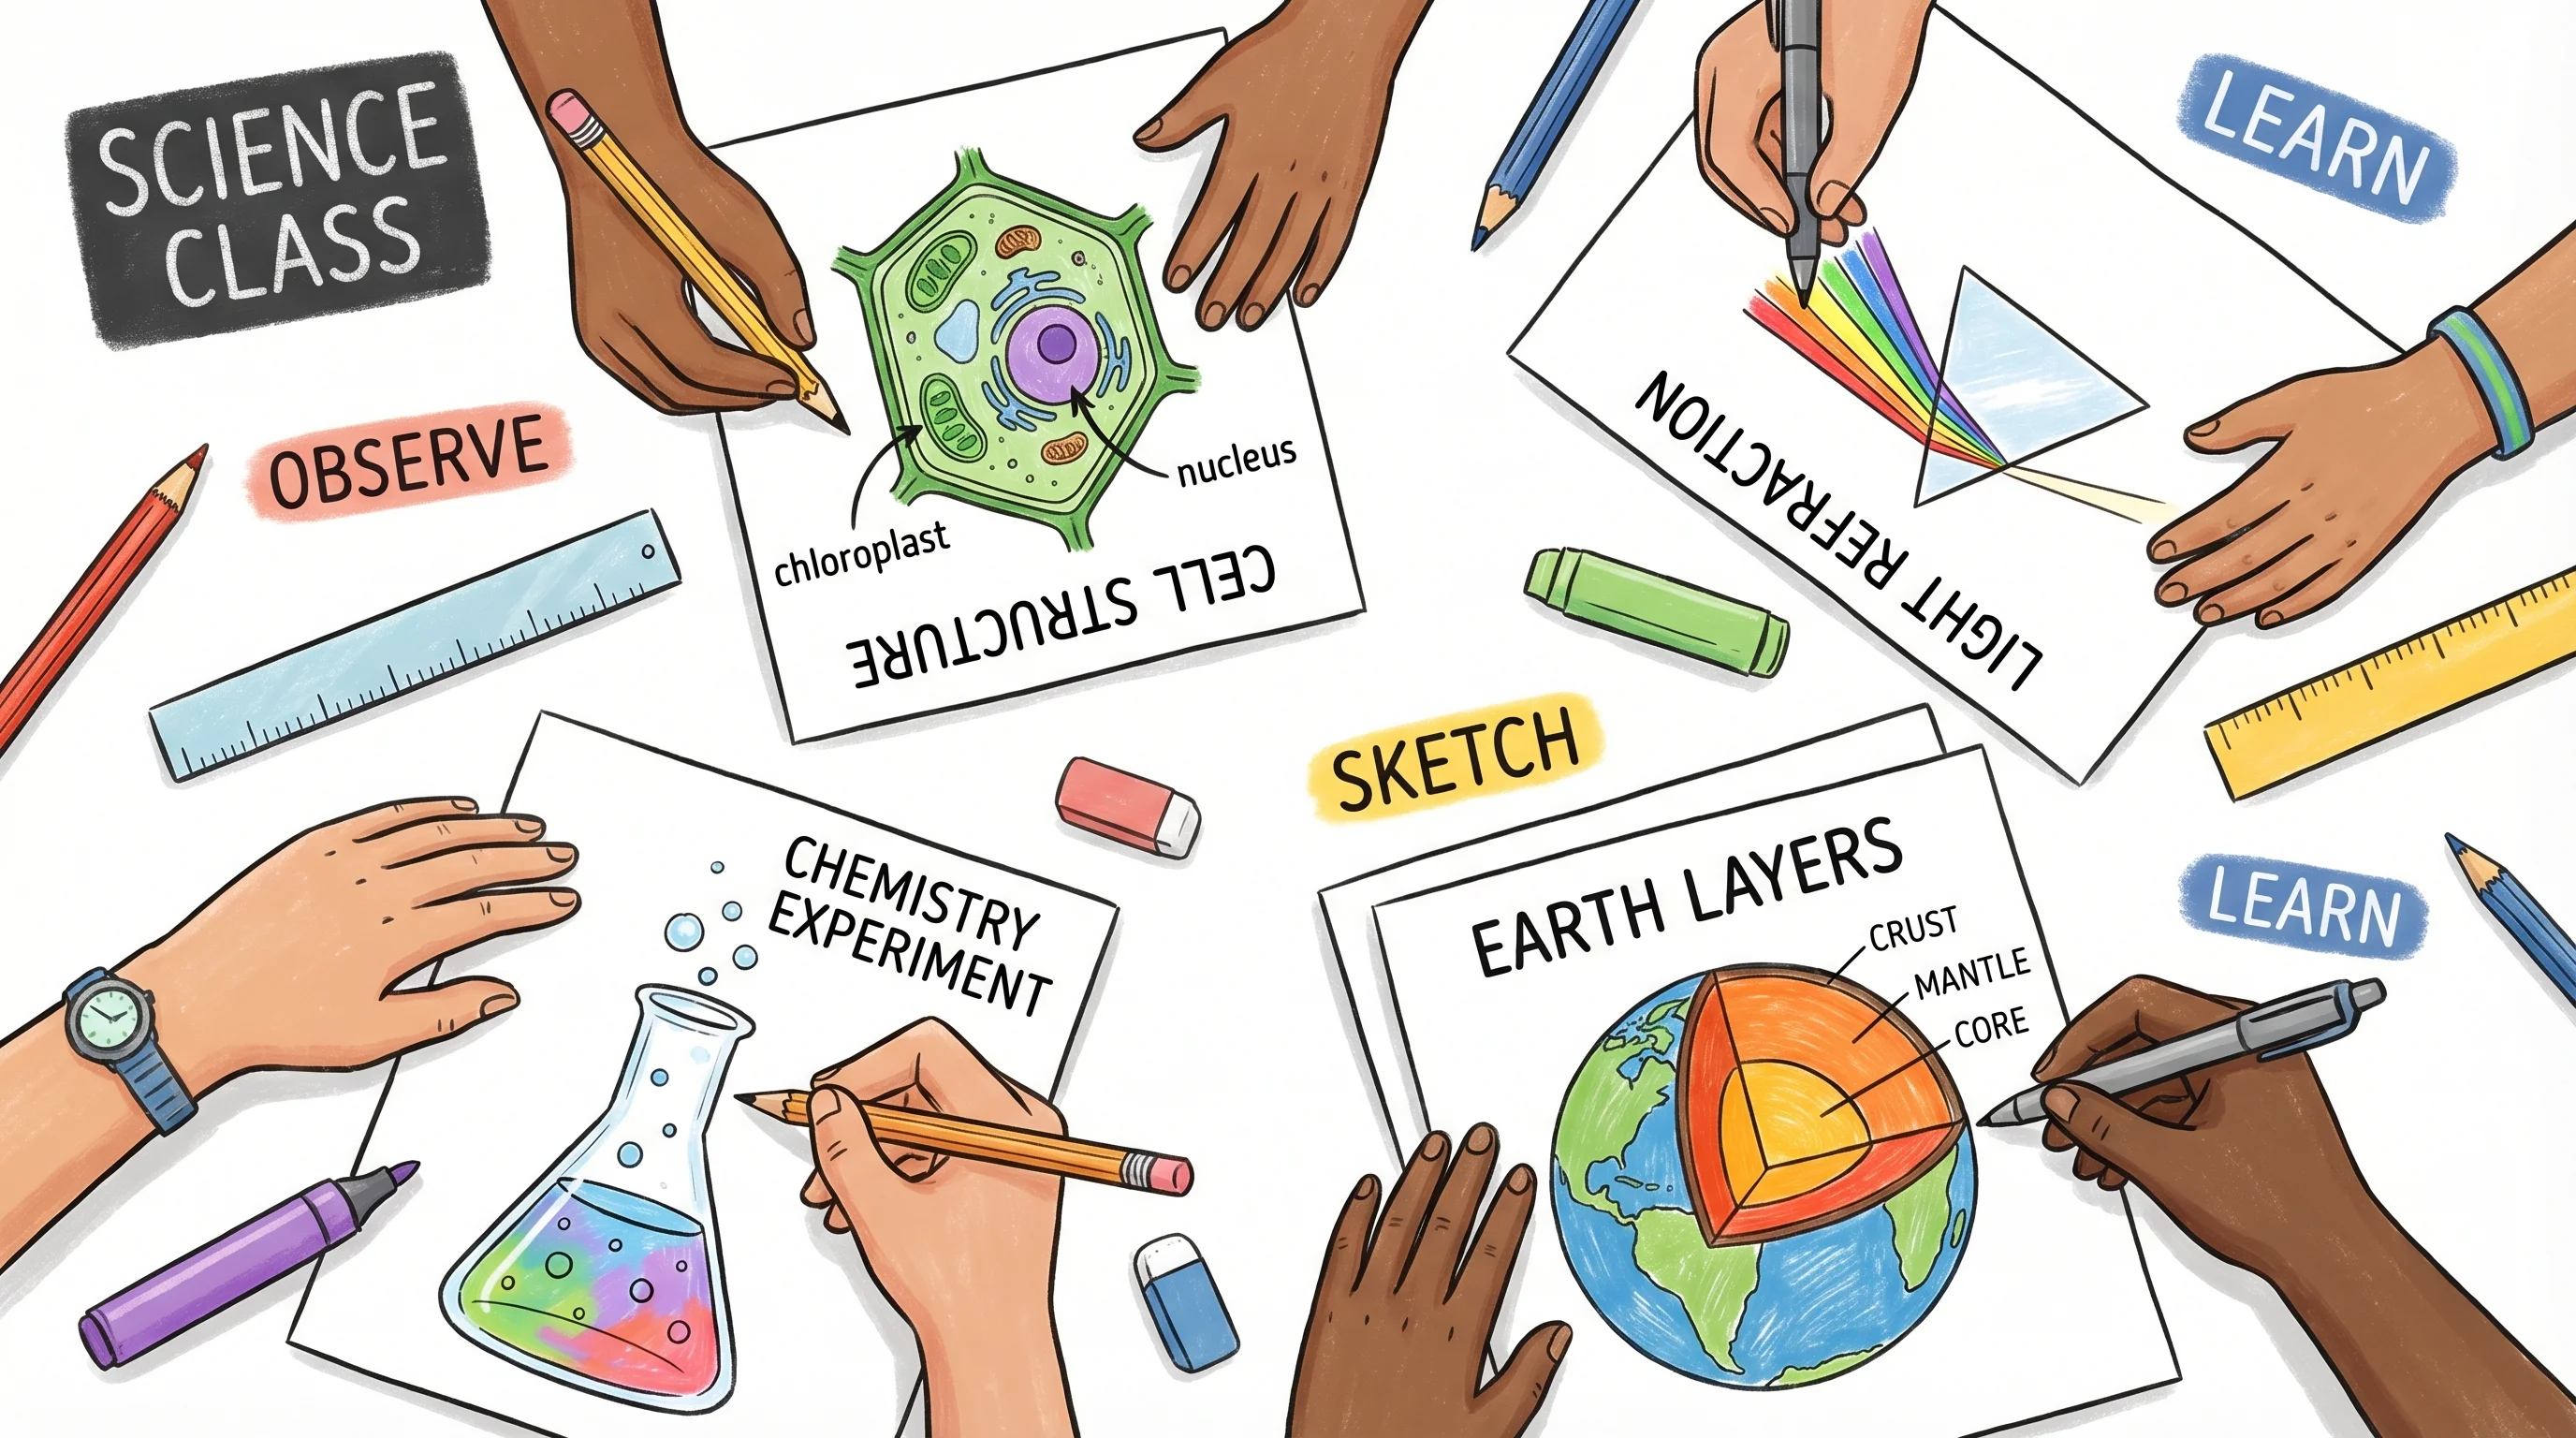
How to Create Science Drawings: Easy Step-by-Step Guide for Students
Learn how to create clear, labeled science drawings for biology, chemistry, and physics class. A step-by-step guide with tips, examples, and free AI tools.

PhD Poster Design Guide: How to Create a Winning Conference Poster (2026)
Complete guide to designing PhD conference posters that stand out. Learn layout, typography, and color schemes, and use free AI tools to build research posters.
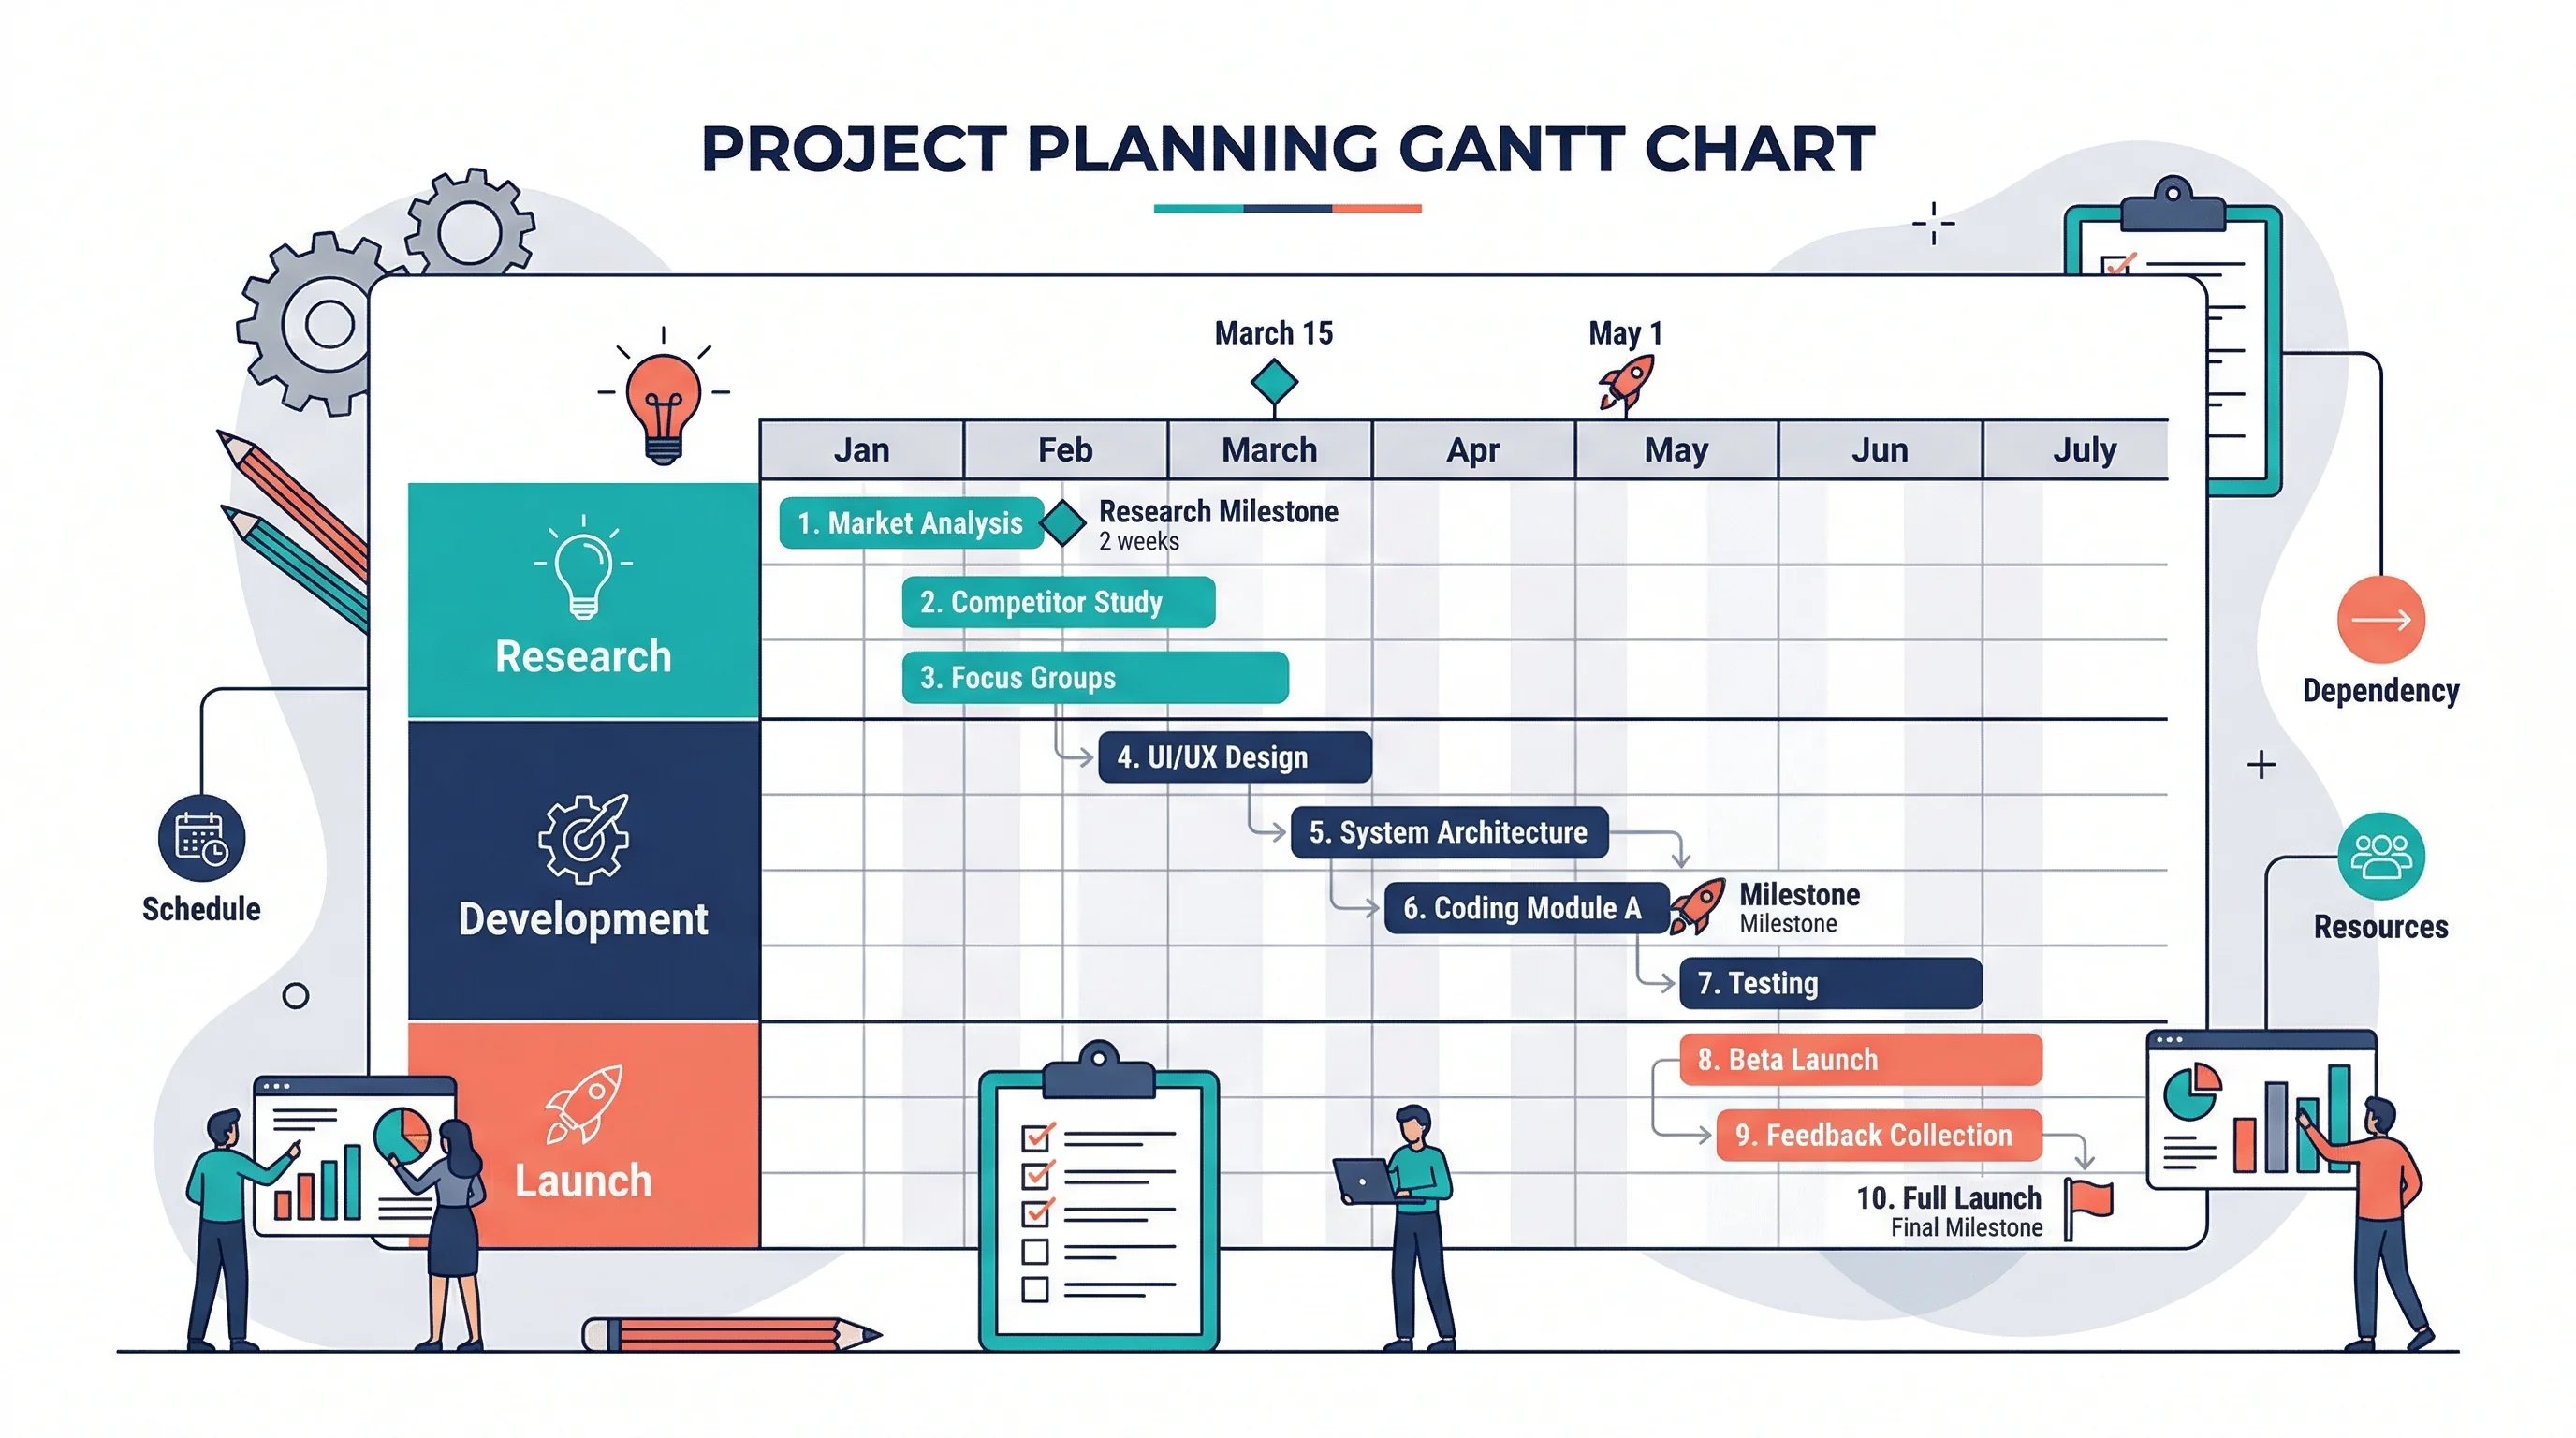
How to Make a Gantt Chart: Step-by-Step Guide for Projects and Research (2026)
Learn how to make a Gantt chart for project plans, research schedules, and launch timelines. Covers Excel, common mistakes, and when to use timeline tools.
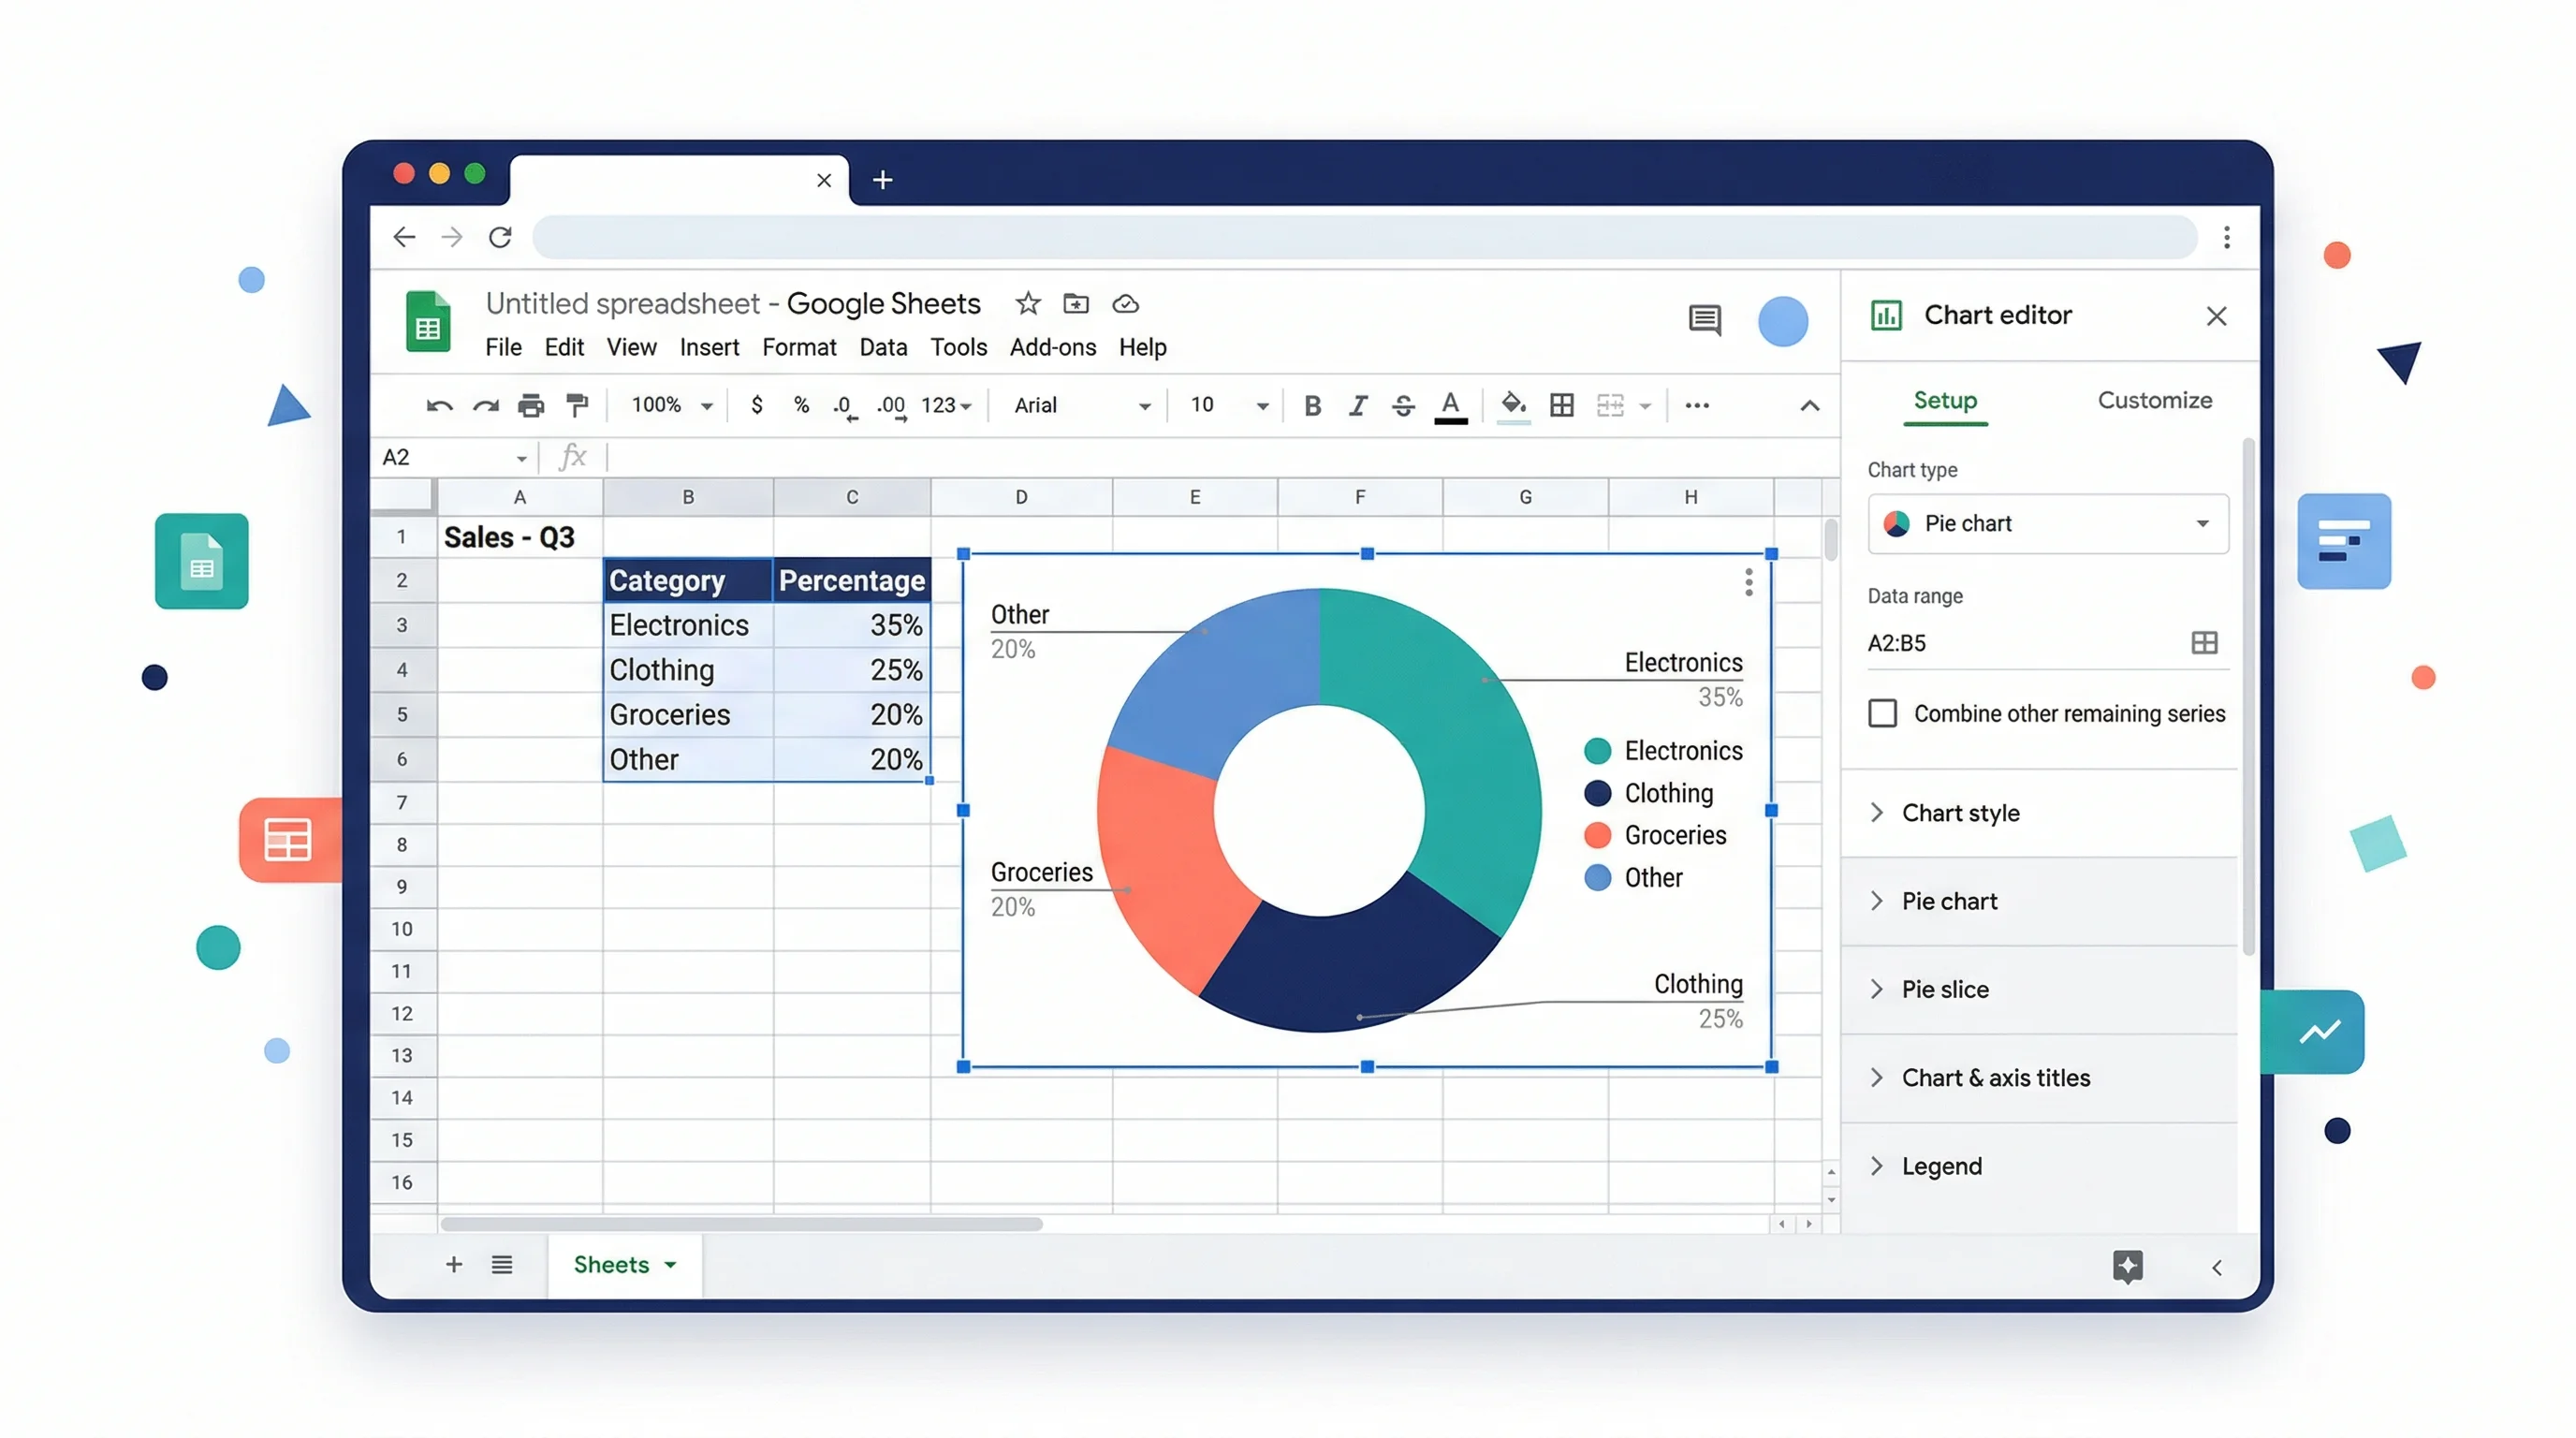
How to Make a Pie Chart in Google Sheets: Step-by-Step Guide (2026)
Learn how to create a pie chart in Google Sheets, summarize messy data, format labels, customize slices, and avoid misleading charts, with official help links.