")
How to Make a Gantt Chart in Excel: Step-by-Step Project Timing Guide (2026)
Learn how to build a Gantt chart in Excel using a stacked bar chart, start dates, duration formulas, and milestone formatting. Includes Microsoft and ExcelJet references.
Gantt charts are one of the clearest ways to show when project tasks start, how long they last, and how the schedule fits together. They are especially useful when you need to communicate project timing to people who do not want to read a long planning table line by line.
Excel does not include a native Gantt chart type, but it can still produce a solid Gantt-style schedule with a stacked bar chart, date formatting, and a few layout tweaks. That is why Excel remains a common choice for lightweight project planning, especially when the timeline data already lives in a workbook.
This guide explains how to make a Gantt chart in Excel, how to calculate duration correctly, how to make the bars read like a real schedule, and where Excel starts to struggle compared with dedicated project tools.
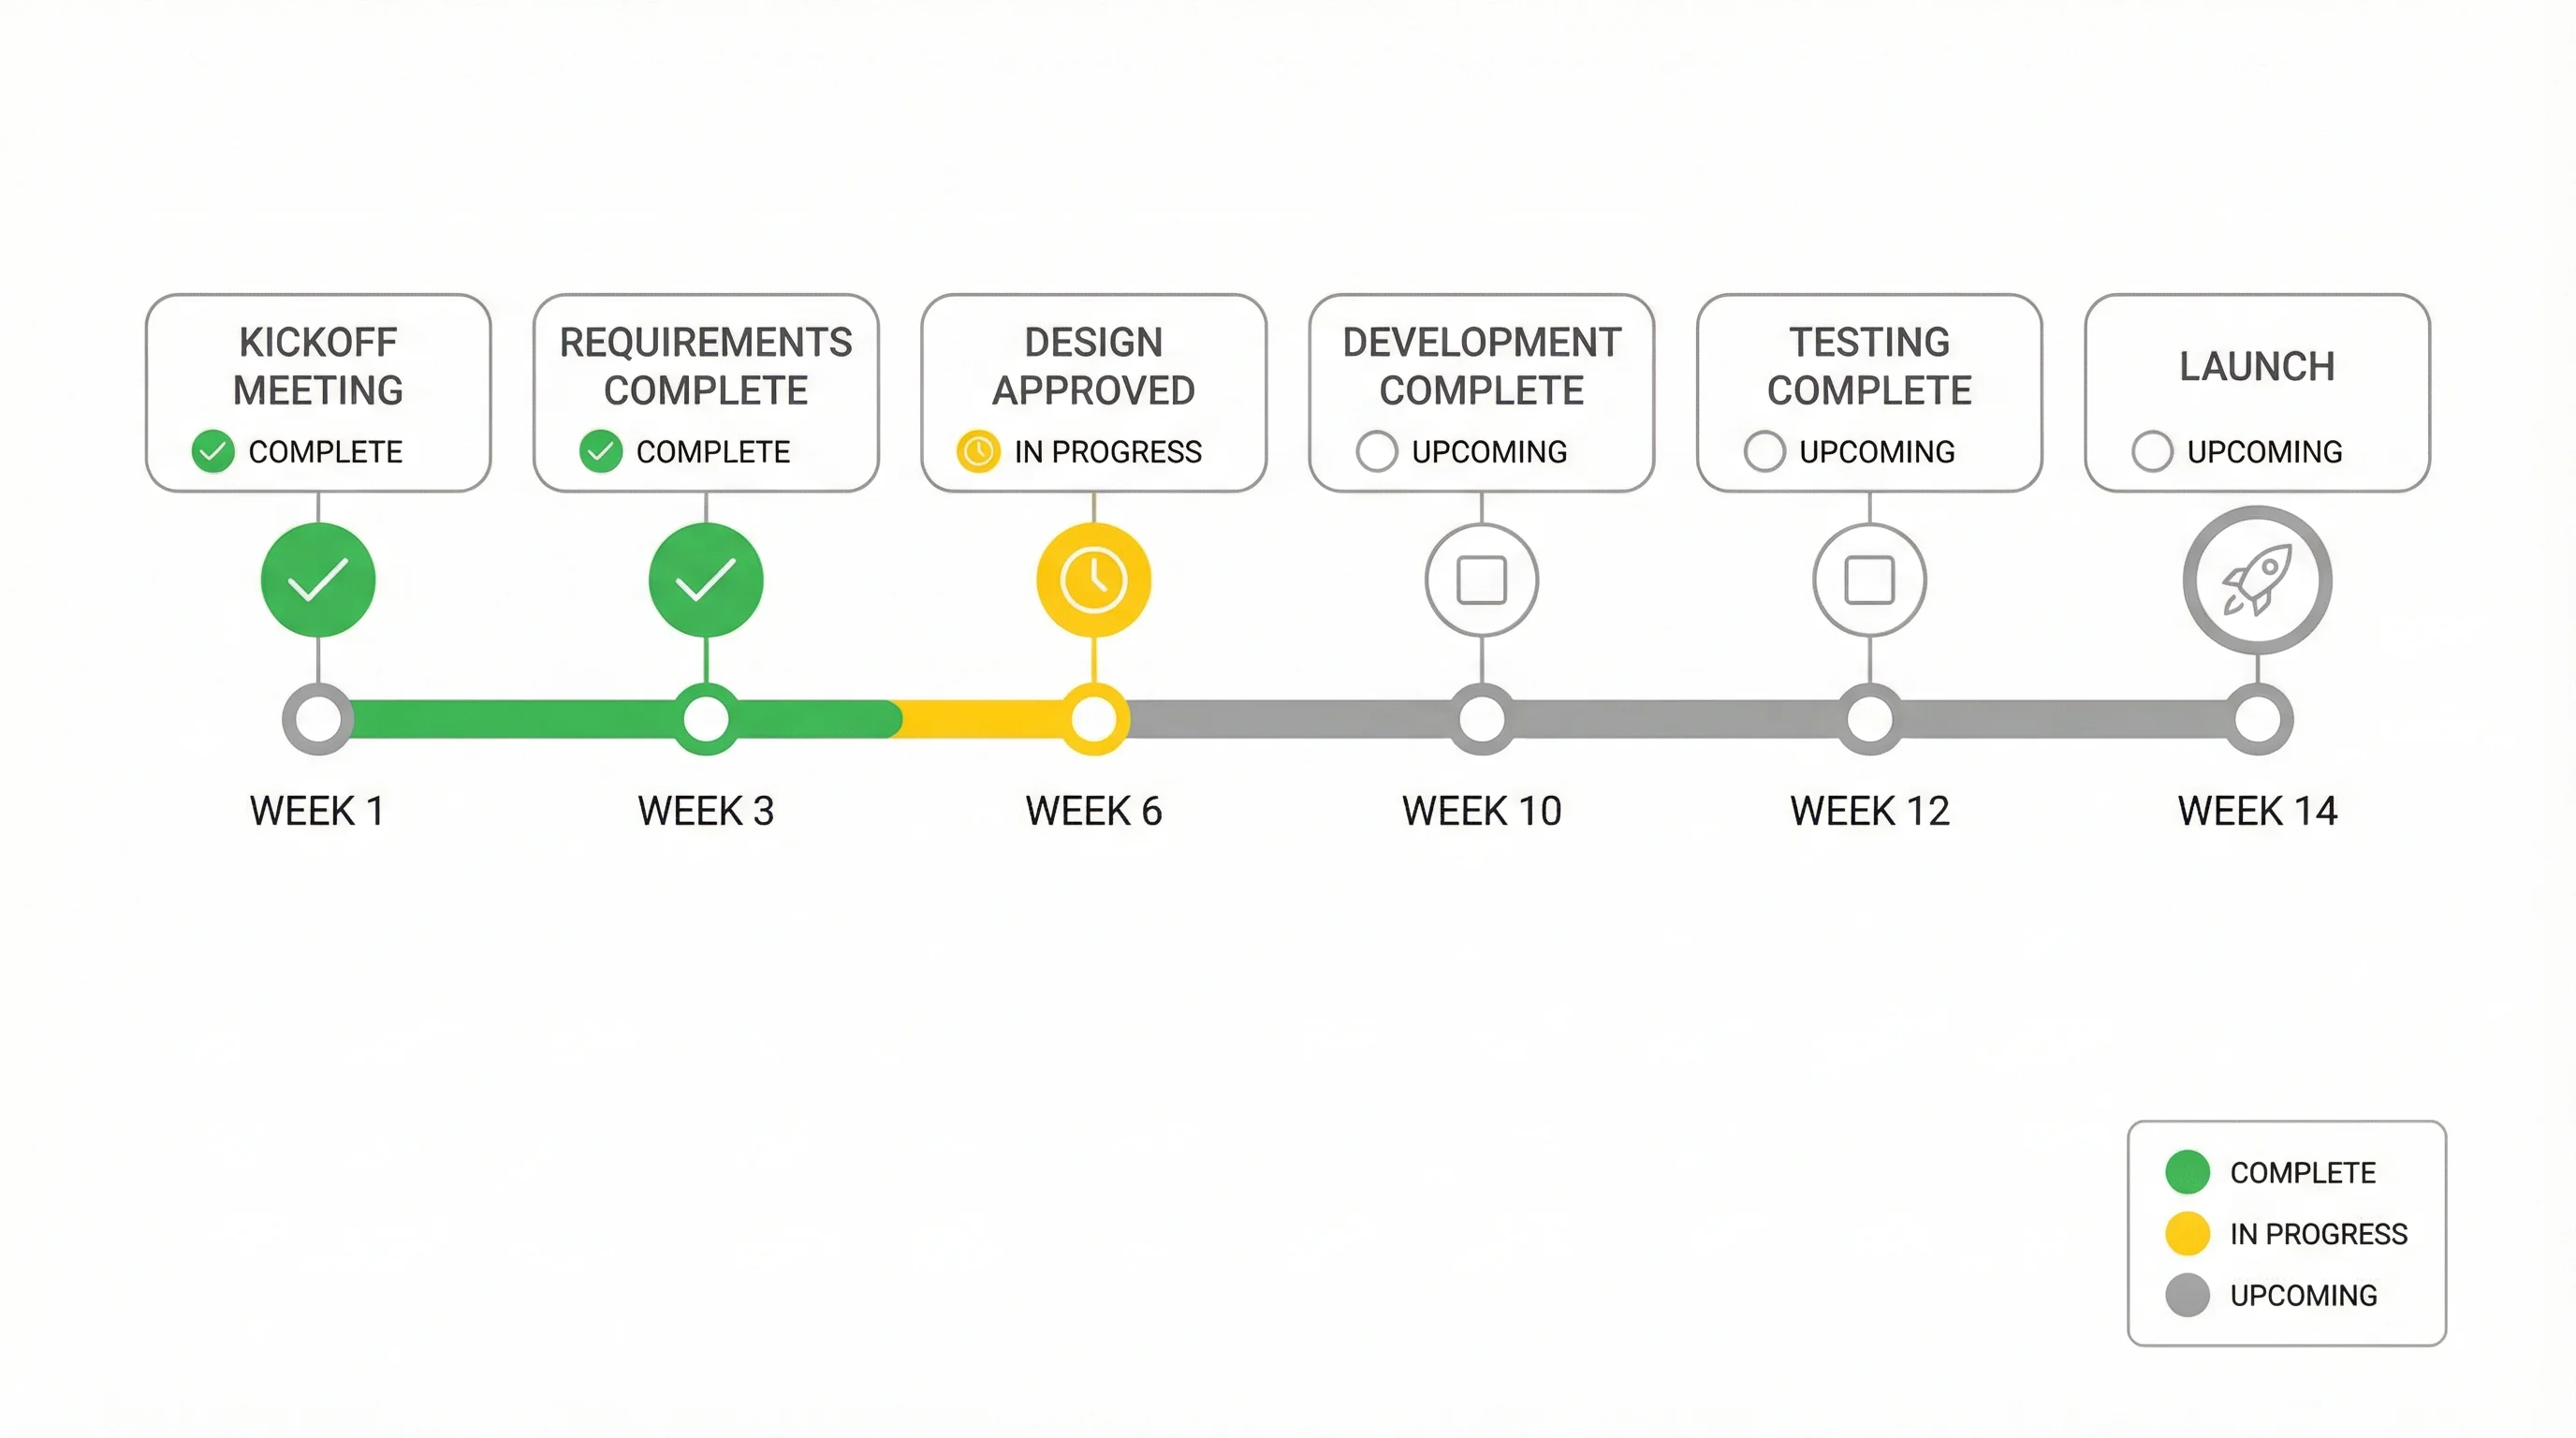
Timeline Generator
Generate polished project timelines and roadmap visuals without manually formatting every Excel bar.
Create your timeline ->What a Gantt Chart Actually Shows
A Gantt chart maps tasks against time.
Each row usually represents:
- a task
- a start date
- a duration
- sometimes an owner or completion status
The visual result lets readers answer questions such as:
- What starts first?
- What overlaps?
- Which tasks run the longest?
- Where are milestones?
- How far along is the project?
That makes Gantt charts useful for:
- project roadmaps
- research timelines
- launch plans
- content calendars
- grant or study schedules
Why Use Excel for a Gantt Chart?
Excel is often the right tool when:
- your planning data already lives in a spreadsheet
- the schedule is relatively simple
- you need a shareable chart quickly
- the audience wants a static timeline, not a full project system
Microsoft's Excel-specific guide, Present your data in a Gantt chart in Excel, uses the same basic principle this article follows: build a stacked bar chart, then hide the start-date portion so only the duration bars remain visible.
Excel is strongest here when the Gantt chart is primarily a communication artifact rather than a live planning engine. If the timeline changes every hour across many owners and dependencies, Excel becomes harder to govern.
Step 1: Build the Source Table
A simple Excel Gantt chart needs at least three columns:
| Task | Start Date | Duration (days) |
|---|---|---|
| Kickoff | 2026-05-01 | 2 |
| Research | 2026-05-03 | 8 |
| Draft | 2026-05-11 | 5 |
| Review | 2026-05-16 | 4 |
| Launch | 2026-05-22 | 1 |
You can also work from a slightly richer table:
| Task | Start Date | End Date | Duration | Owner | % Complete |
|---|---|---|---|---|---|
| Kickoff | 2026-05-01 | 2026-05-02 | 2 | PM | 100 |
| Research | 2026-05-03 | 2026-05-10 | 8 | Analyst | 60 |
| Draft | 2026-05-11 | 2026-05-15 | 5 | Writer | 20 |
Duration formula
If you already have start and end dates, calculate duration with:
=EndDate - StartDate
If you want the finish date counted inclusively, use:
=EndDate - StartDate + 1
Be consistent. One of the easiest ways to break an Excel Gantt chart is mixing inclusive and exclusive duration logic across rows.
Add status columns early if you will need them later
Even if the first draft only shows tasks and dates, it is smart to reserve columns for:
- owner
- percent complete
- milestone flag
- workstream
Those fields become useful later when you want to color-code the bars, add progress overlays, or filter the schedule.
Step 2: Insert the Stacked Bar Chart
- Select the
Start DateandDurationcolumns. - Go to
Insert > Recommended Charts > All Charts > Bar > Stacked Bar. - Excel will produce a stacked bar chart with two segments per task.
At first, it will not look like a Gantt chart. That is expected.
The first series is the hidden positioning layer. The second series is the visible task bar.
Step 3: Hide the Start-Date Series
This is the key Gantt trick.
- Click the start-date bars
- Right-click and choose
Format Data Series - Set the fill to
No fill - Set the border to
No line
Now the duration bars will appear to float across the date axis. That is what turns the stacked bar chart into a Gantt-style layout.
If that hidden positioning series is still visible, the chart will look like a normal stacked bar rather than a schedule. This is the single most important visual conversion step.
Step 4: Reverse the Task Order
By default, Excel often places the first task at the bottom. For most Gantt charts, the first task should appear at the top.
To fix this:
- Click the vertical axis with task names
- Open
Format Axis - Enable
Categories in reverse order
This small step makes the chart read like a project plan rather than an upside-down list.
Step 5: Format the Horizontal Axis as Dates
The time axis should be clean and readable.
Use Format Axis to:
- set the axis type to dates
- choose a useful minimum date
- choose a useful maximum date
- adjust major units to days, weeks, or months
For short projects, daily intervals work. For longer roadmaps, weekly or monthly tick spacing is usually better.
If the chart has too much empty space before the first task or after the last task, tighten the min and max dates manually.
Step 6: Use Color Sparingly
A Gantt chart can become chaotic very quickly if every task has its own color.
Better patterns include:
- one main color for all standard tasks
- one accent color for milestones
- a second muted color for completed progress
- a different color family only for major workstreams
The goal is to make the schedule readable first and attractive second.
Step 7: Make the Gantt Chart Easier to Read
Use one main bar color
A single clean bar color is usually enough for the base schedule. Add more color only when it communicates meaning such as owner, workstream, or status.
Add data labels carefully
Sometimes adding the task name or duration to the bar helps. Sometimes it makes the chart crowded. Use labels only where they improve interpretation.
Reduce unnecessary chart clutter
Keep:
- task names
- a readable date axis
- light gridlines if they help timing interpretation
Remove:
- heavy chart borders
- decorative gradients
- 3-D effects
- redundant legends
How to Show Progress in an Excel Gantt Chart
One practical upgrade is to show completed work.
The simplest approach is to add a Completed helper column and create another stacked series.
For example:
| Task | Start Date | Duration | Completed |
|---|---|---|---|
| Research | 2026-05-03 | 8 | 5 |
| Draft | 2026-05-11 | 5 | 1 |
Then:
- format the completed bar with a darker fill
- format the remaining duration with a lighter fill
This gives a clear visual of schedule progress without leaving Excel.
For stakeholder reporting, this is often more useful than a plain schedule because it lets people see both planned timing and actual execution at once.
How to Mark Milestones
Milestones are zero-duration or one-day events such as:
- kickoff approved
- beta released
- manuscript submitted
- review completed
You can represent them by:
- using one-day duration bars in a contrasting color
- creating a dedicated helper series
- adding label markers at specific dates
Milestones matter because they give the reader anchor points. A Gantt chart without milestones can feel like a wall of bars.
Dependencies and Critical Tasks
Excel can show timing clearly, but it does not naturally behave like a dedicated project-management tool when dependencies become complex.
You can still communicate dependencies visually by:
- placing dependent tasks directly beneath their predecessors
- adding milestone rows between major phases
- grouping tasks by workstream
- using labels or comments for critical path tasks
This is often enough for research schedules, content launches, grant applications, and internal planning decks, even if it is not enough for enterprise-scale scheduling.
Formula-Based Gantt Views in Excel
ExcelJet's guide on how to make a Gantt chart in Excel shows an alternative approach: using conditional formatting and formulas to build a calendar-style Gantt grid directly in worksheet cells.
That method is useful when:
- you want week-by-week visibility
- you want a worksheet view instead of a chart object
- you need more spreadsheet-style control
One example formula pattern is:
=AND($C2<=G$1,$C2+$D2>G$1)
This checks whether a given date column falls within the task interval and can be used to fill timeline cells visually.
The chart-based method is usually better for presentation. The formula-grid method is often better for planning sheets.
Example: Content Launch Schedule
Suppose you are planning a mini content launch with five steps:
| Task | Start Date | Duration |
|---|---|---|
| Brief Approved | 2026-05-01 | 1 |
| Research | 2026-05-02 | 4 |
| Drafting | 2026-05-06 | 3 |
| Review | 2026-05-09 | 2 |
| Publish | 2026-05-12 | 1 |
In this kind of schedule, Excel works well because:
- task count is modest
- dependencies are simple
- dates do not change minute by minute
- the output is mainly for communication
That is exactly the kind of use case where a lightweight Excel Gantt chart is worth the setup time.
Common Gantt Chart Mistakes in Excel
Mistake 1: Using the wrong duration logic
If some rows are inclusive and others are exclusive, the timeline becomes unreliable.
Mistake 2: Forgetting to hide the start-date series
Without that step, the chart is just a stacked bar chart, not a readable Gantt-style schedule.
Mistake 3: Leaving the task order upside down
Always check whether the first task is at the top.
Mistake 4: Overloading the timeline with too many colors
Use color to encode meaning, not decoration.
Mistake 5: Trying to turn Excel into a full project-management platform
Excel is fine for static schedules and communication. It is not ideal for live dependency tracking, resource leveling, or complex project governance.
Mistake 6: Treating every task as equally important
If milestones, approvals, or handoff points matter, mark them visually. Otherwise the reader sees a field of similar bars and loses the structure of the plan.
When Excel Is Enough and When It Is Not
Excel is enough when:
- the project is relatively straightforward
- the chart is mostly for communication
- the team already works in spreadsheets
- you need something quickly
Excel becomes limiting when:
- you need dynamic dependencies
- you need automatic resource balancing
- many people are updating the schedule constantly
- you need a real scheduling system instead of a visual summary
In those situations, Excel often becomes the staging area, while the final visual or planning logic moves to a dedicated tool.
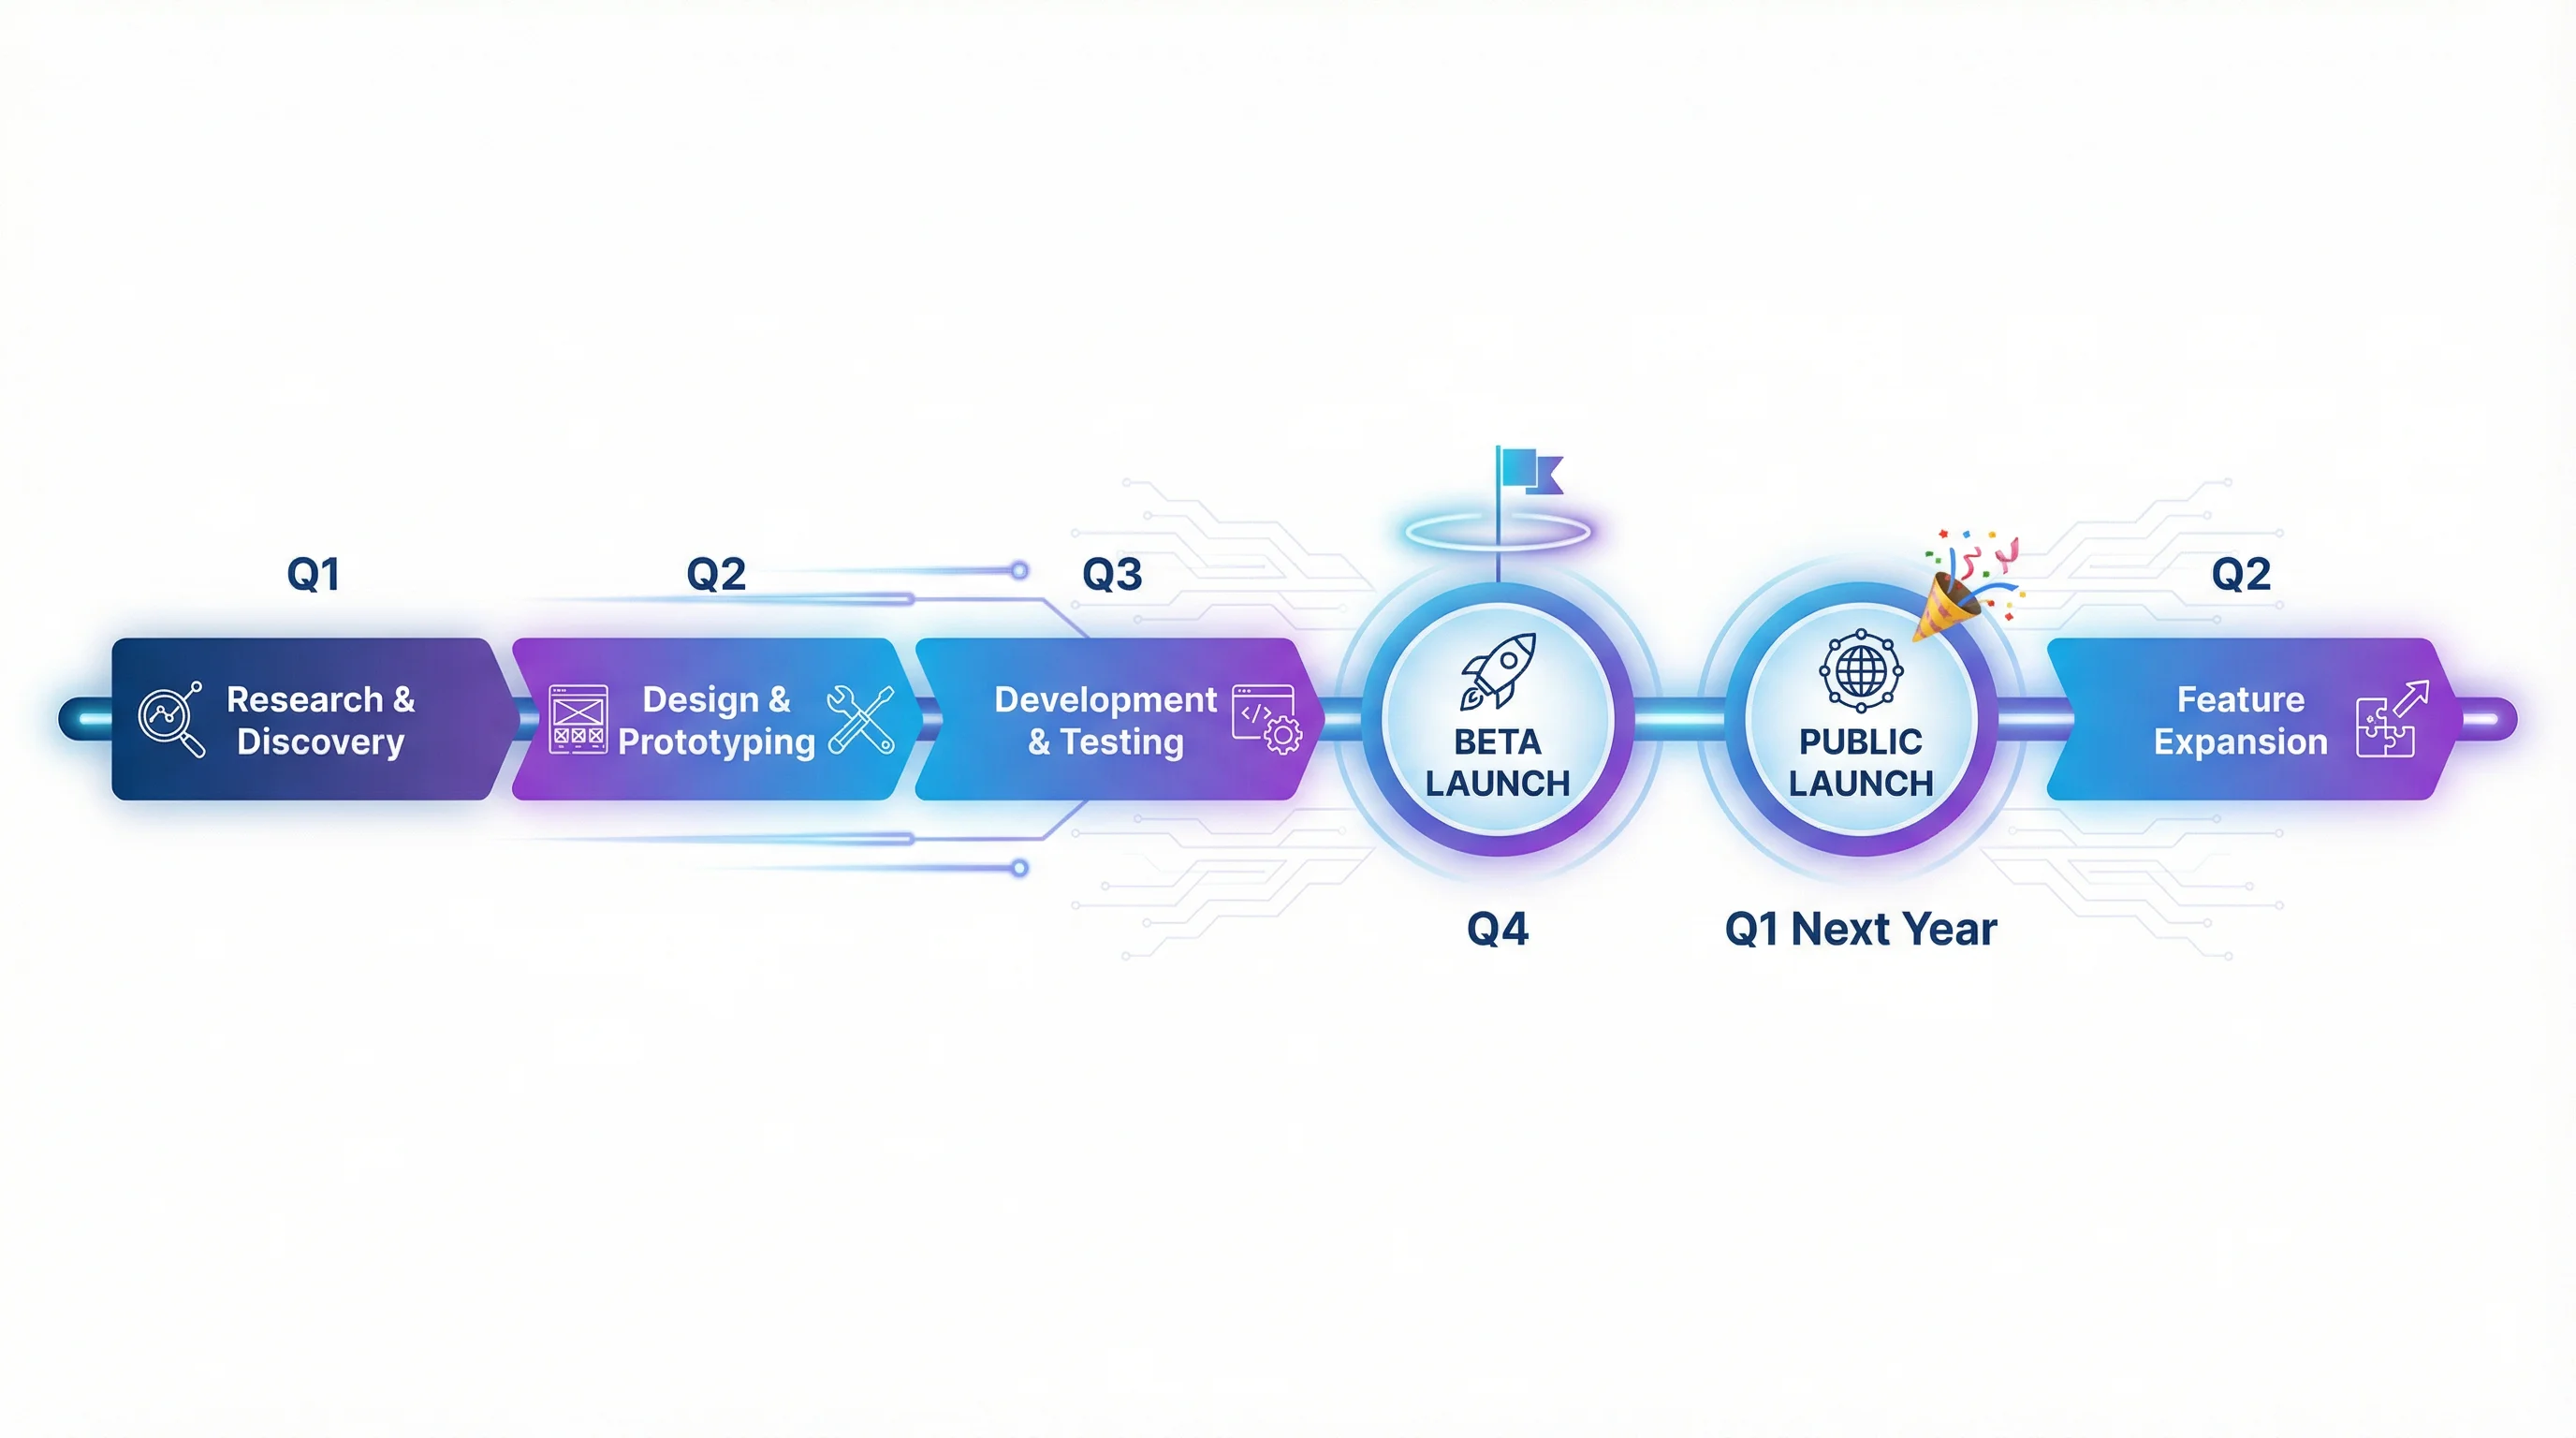
Timeline Generator
Generate clean project timelines and roadmaps from a text description — no manual bar formatting needed.
Frequently Asked Questions
Does Excel have a built-in Gantt chart?
No. Excel does not have a native Gantt chart type. You create one by adapting a stacked bar chart.
What is the easiest way to make a Gantt chart in Excel?
The easiest approach is to use a table with task names, start dates, and durations, insert a stacked bar chart, and hide the start-date series.
Should I use start date plus end date or start date plus duration?
Either works, but start date plus duration is usually easier for charting once duration is calculated consistently.
Can I show progress in an Excel Gantt chart?
Yes. Add a completed-work helper series and format it differently from the remaining duration.
Is Excel a good tool for project timelines?
Yes for simple or medium-complexity visual timelines. No for advanced multi-user project management.
How do I add milestones to an Excel Gantt chart?
Use one-day duration bars in a contrasting color, or create a dedicated helper series for milestone events like approvals, submissions, and launch dates.
Conclusion
Making a Gantt chart in Excel is really about translating project timing into three clear ingredients:
- task name
- start date
- duration
Once those are reliable, the rest is formatting:
- insert a stacked bar chart
- hide the start-date series
- reverse the task order
- clean up the date axis
- add progress and milestones only where they improve understanding
If you want the same project story without manually formatting every bar in Excel, ConceptViz Timeline Generator gives you a faster path to presentation-ready timeline visuals.
External Resources
カテゴリー
もっと読む
")
5 Best Free BioRender Alternatives in 2026 (For Science Illustrations)
Free BioRender alternatives for science illustrations. Compare Canva, ConceptViz AI, draw.io + Bioicons, Mind the Graph & more. No $420/year subscription needed.

7 Free BioRender Alternatives 2026: Tested for Science & Research
7 free BioRender alternatives tested for scientific illustration — pricing, quality, ease of use compared. Best picks for researchers, teachers, and students.

Best AI Scientific Illustration Tools in 2026: Complete Guide
Compare the best AI-powered scientific illustration tools for researchers in 2026. From BioRender to ConceptViz, find the right tool for publication-quality scientific figures.