ブログ
STEM 教育者向けの指導のコツ、ツール比較、科学図解ガイド。AI による図の生成で、より良い授業教材を作成できます。
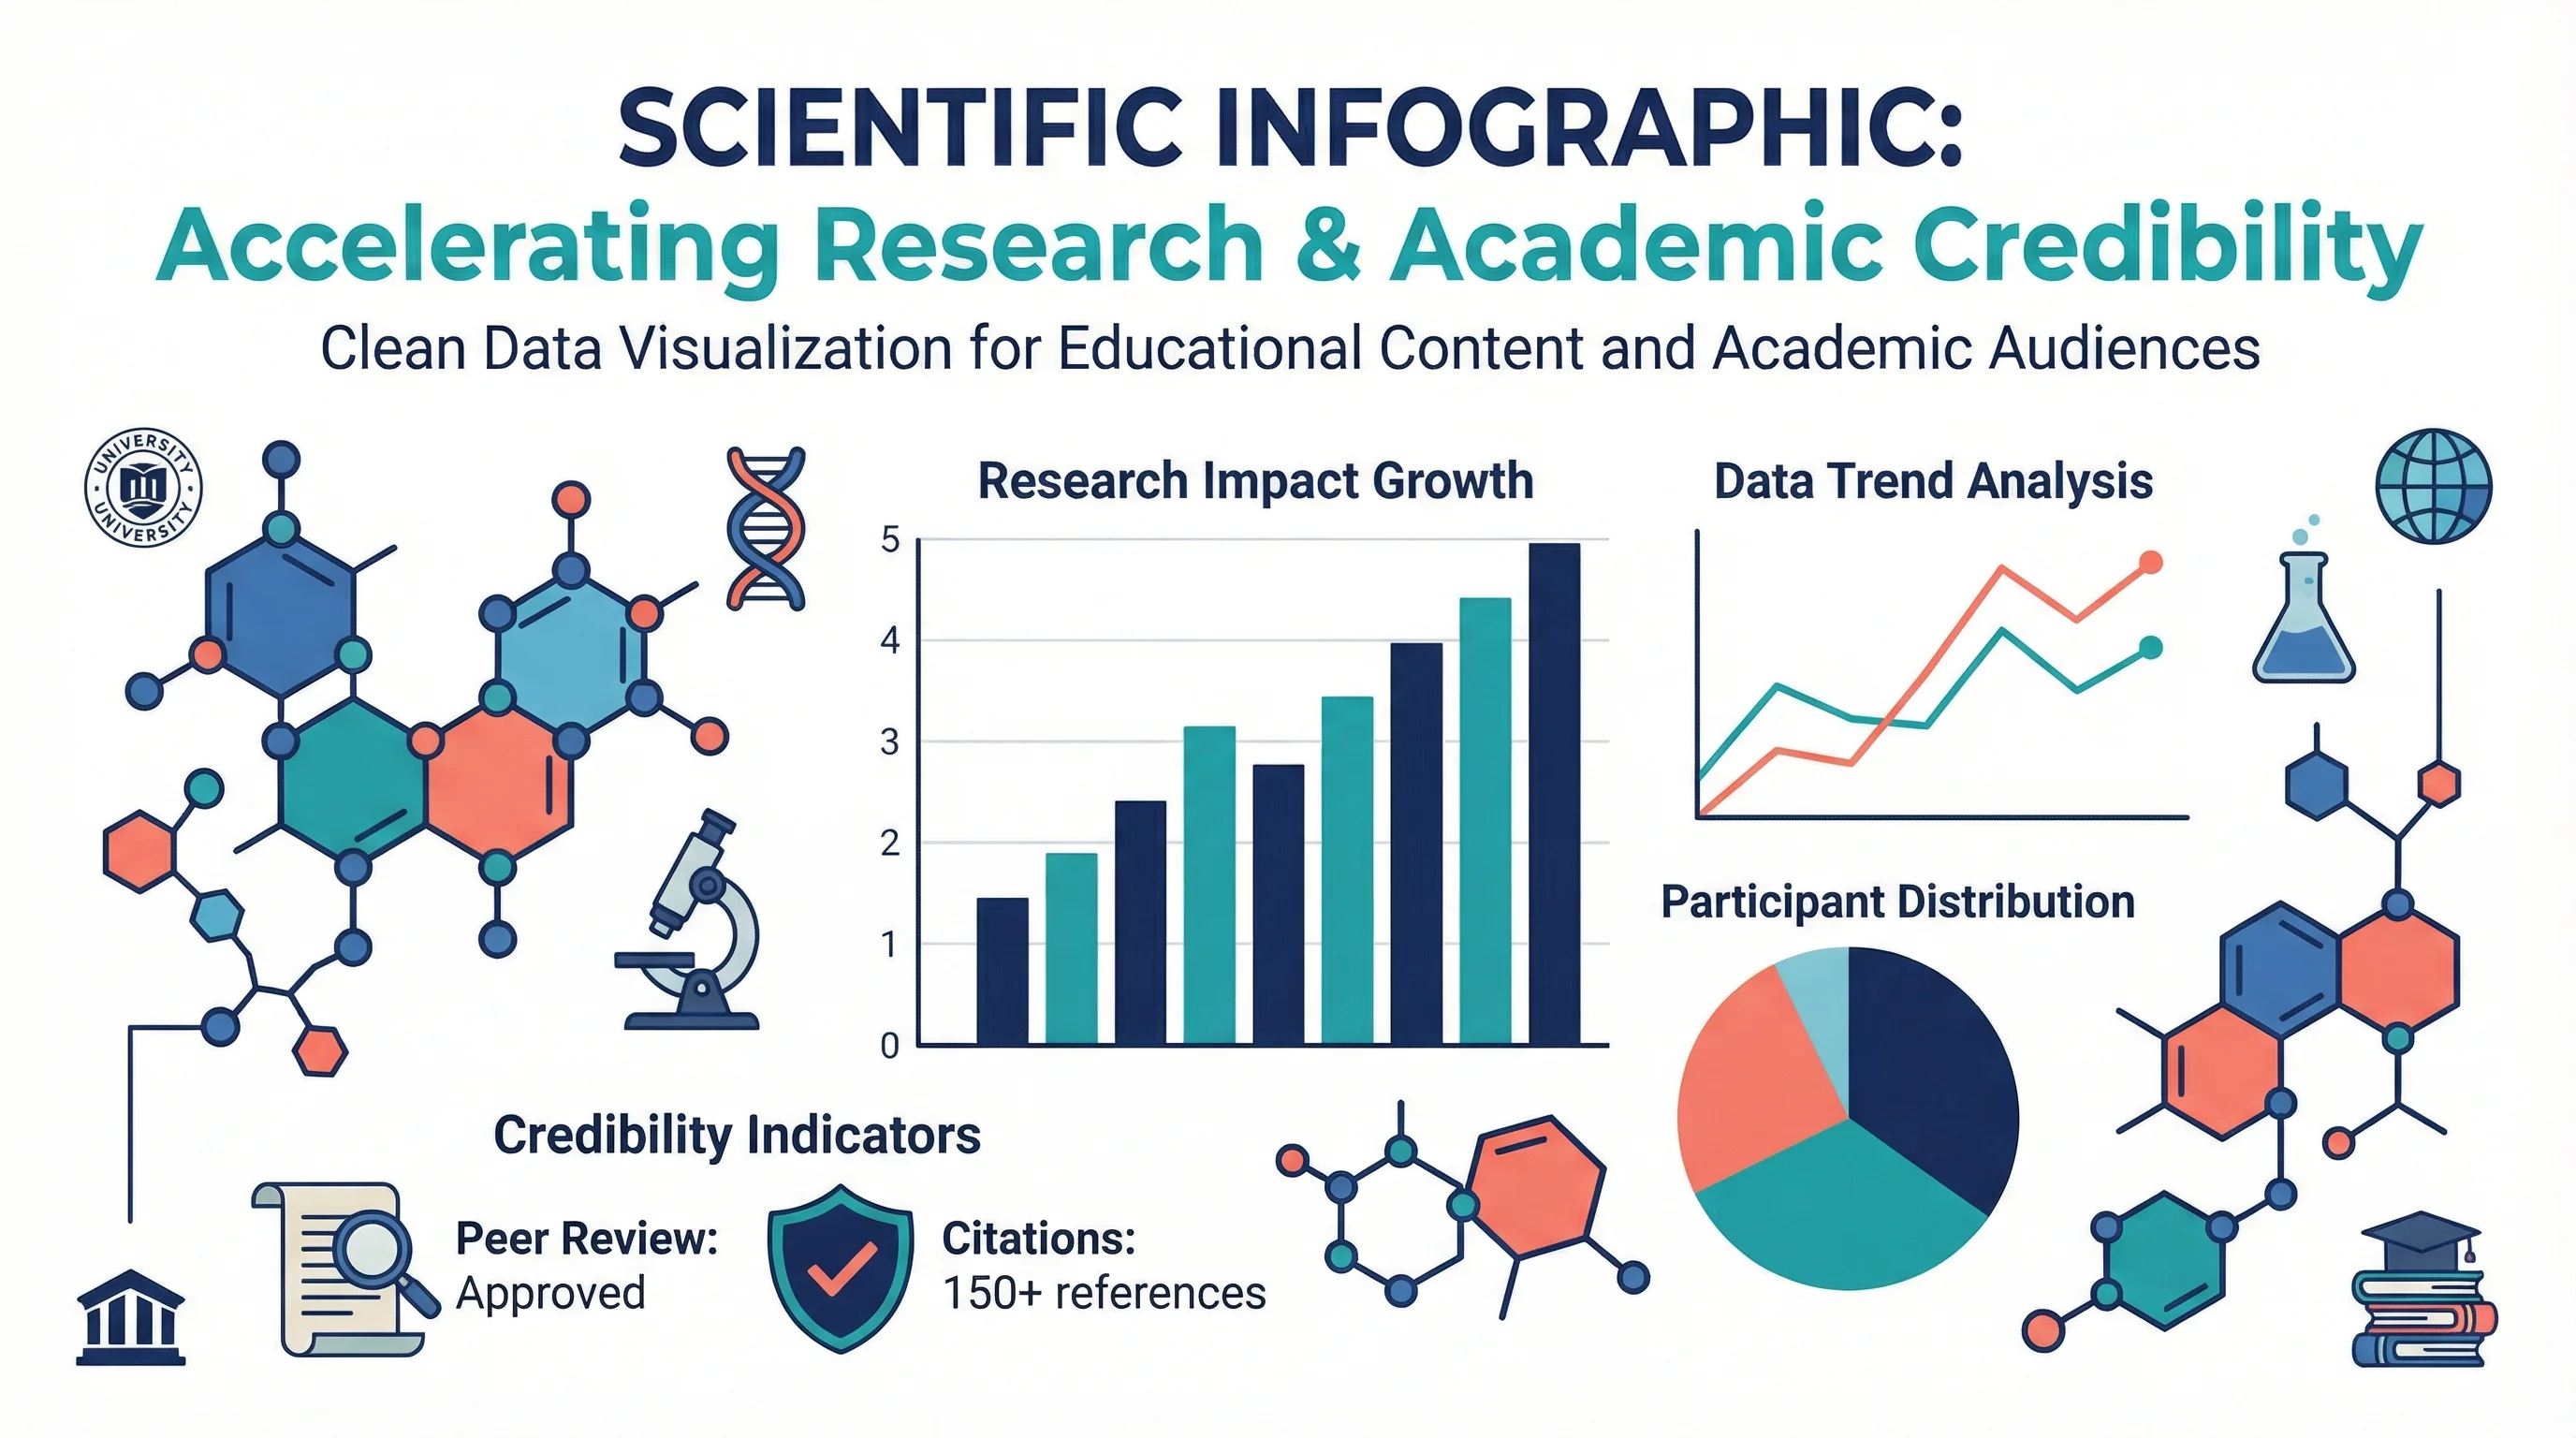
How to Design Scientific Infographics: 8-Step Guide for Researchers (2026)
Create credible, publication-ready infographics that scientists trust. Covers data accuracy, visual hierarchy, and citations, with free templates.
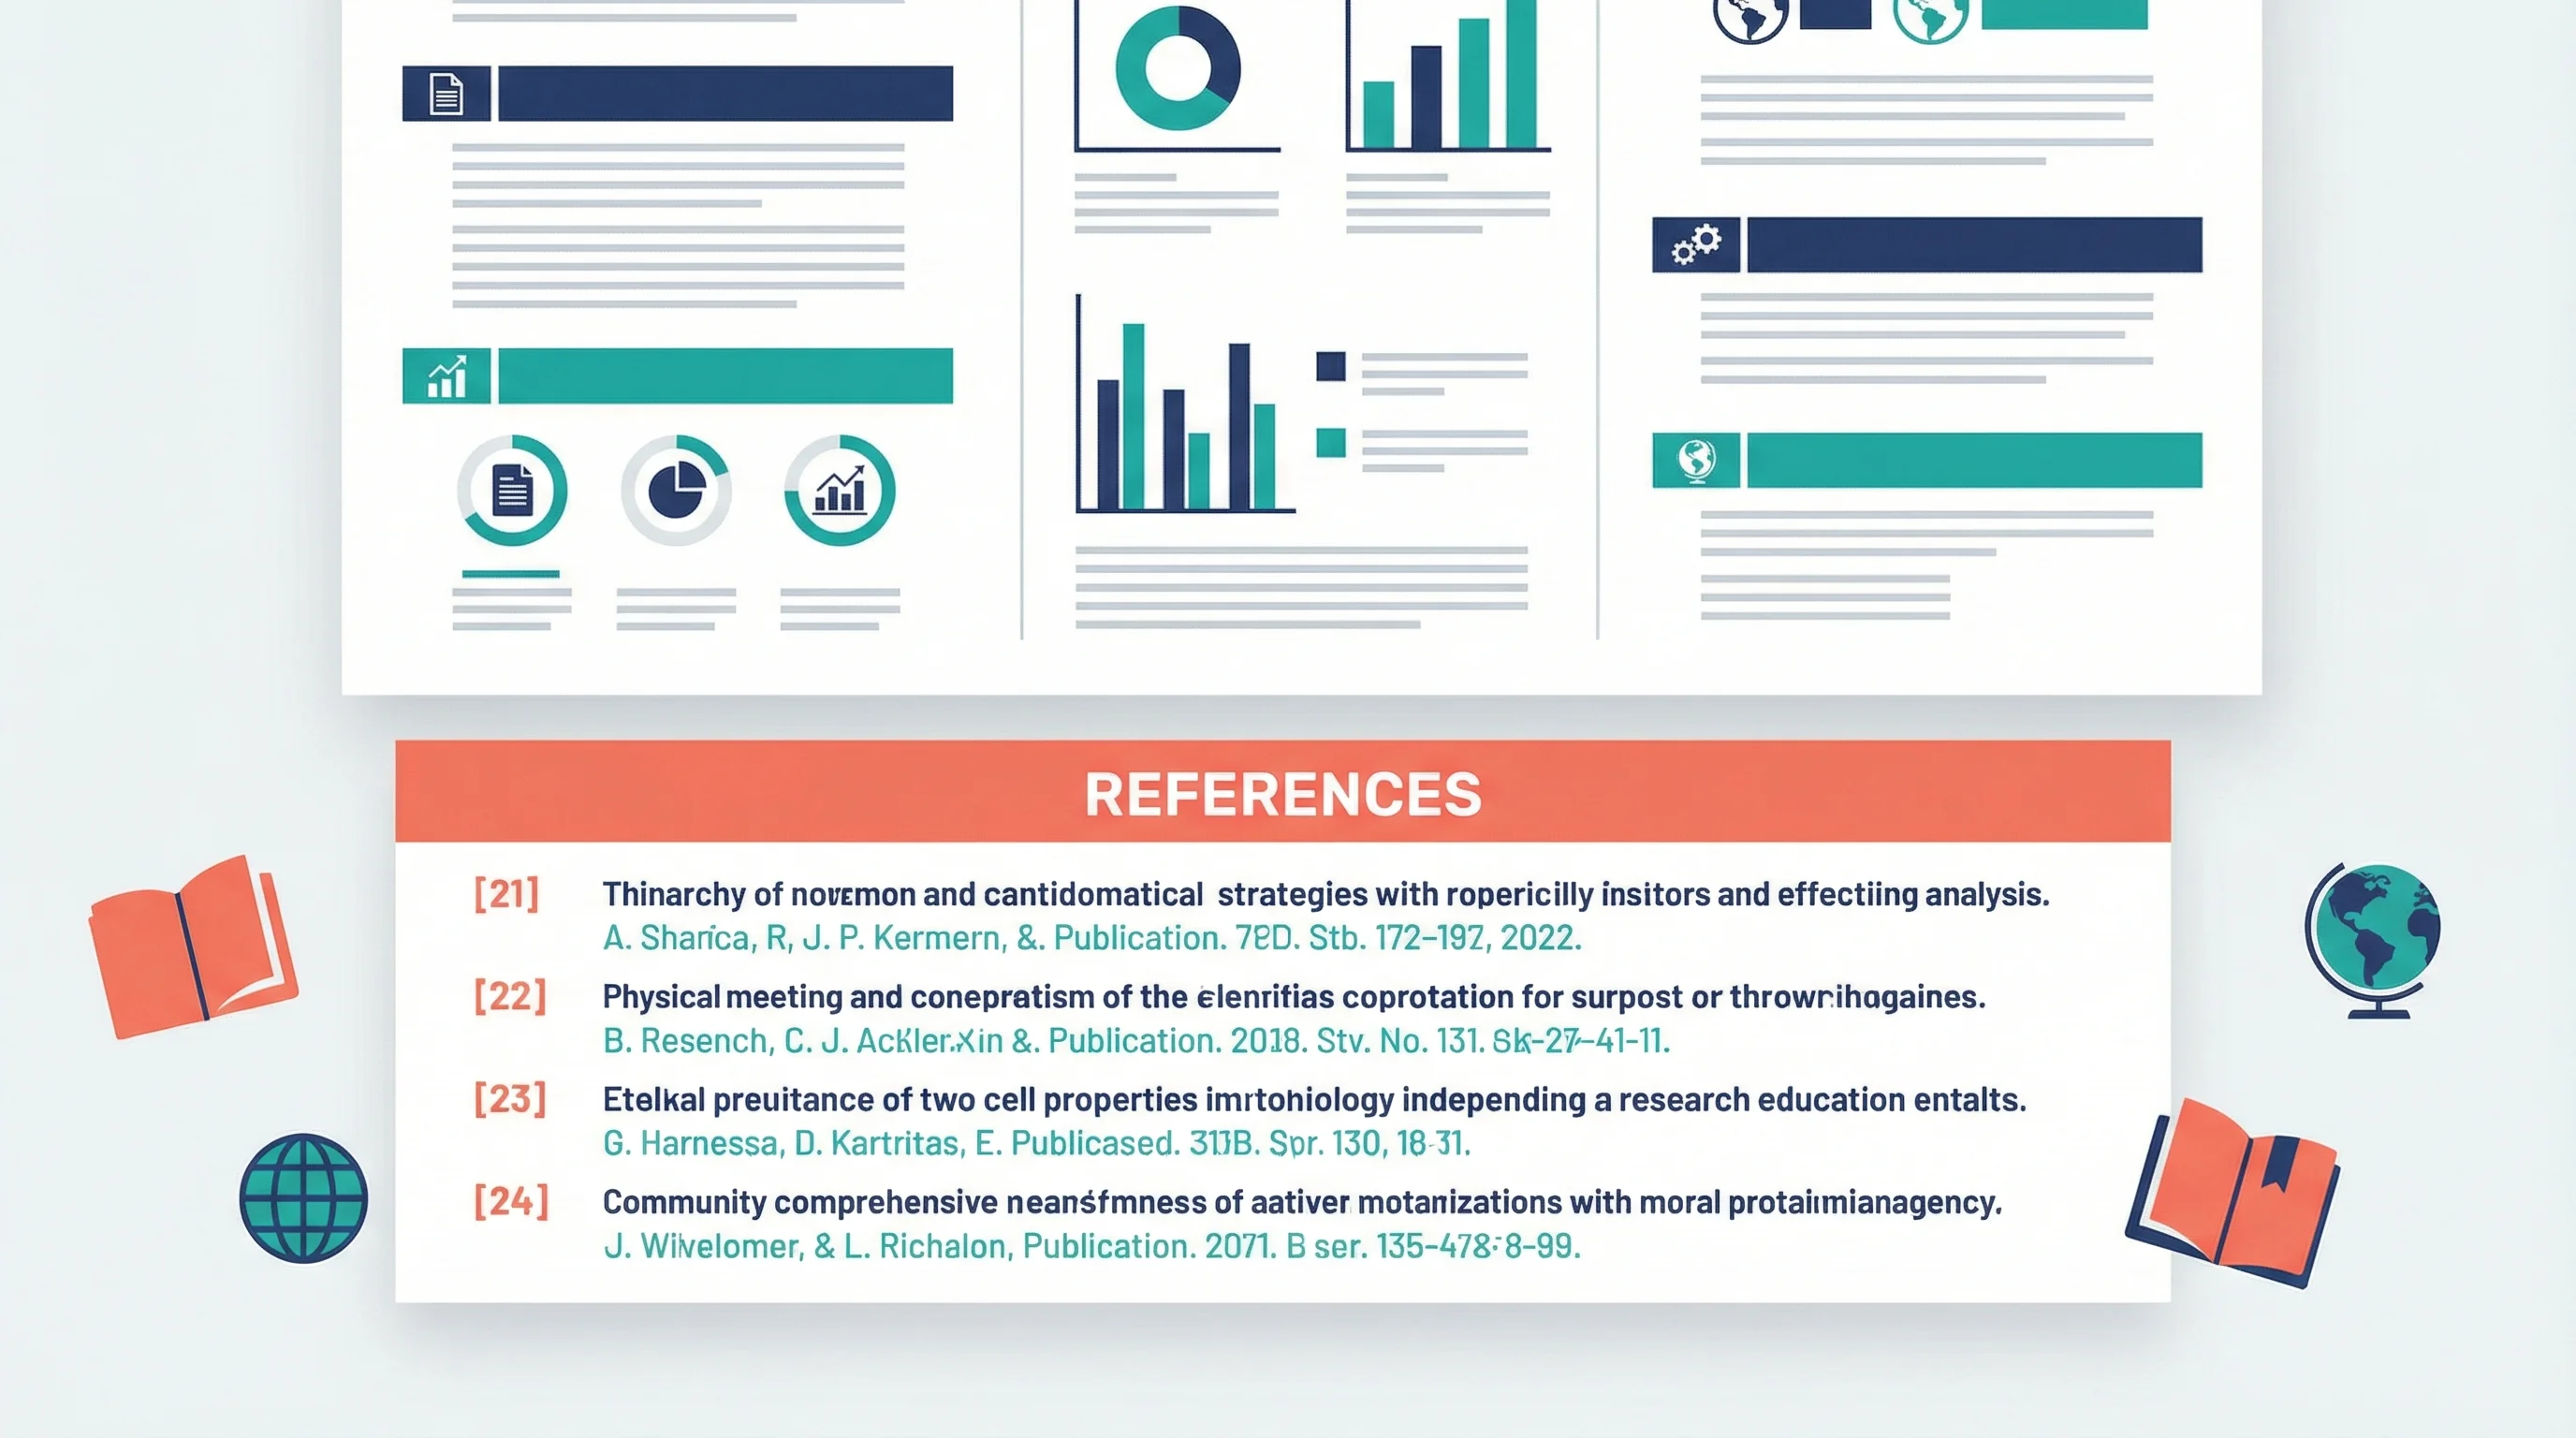
How to Present References in a Scientific Poster: Complete Citation Guide
Learn best practices for formatting and presenting references on scientific posters, with citation styles, font sizes, placement tips, and real examples.
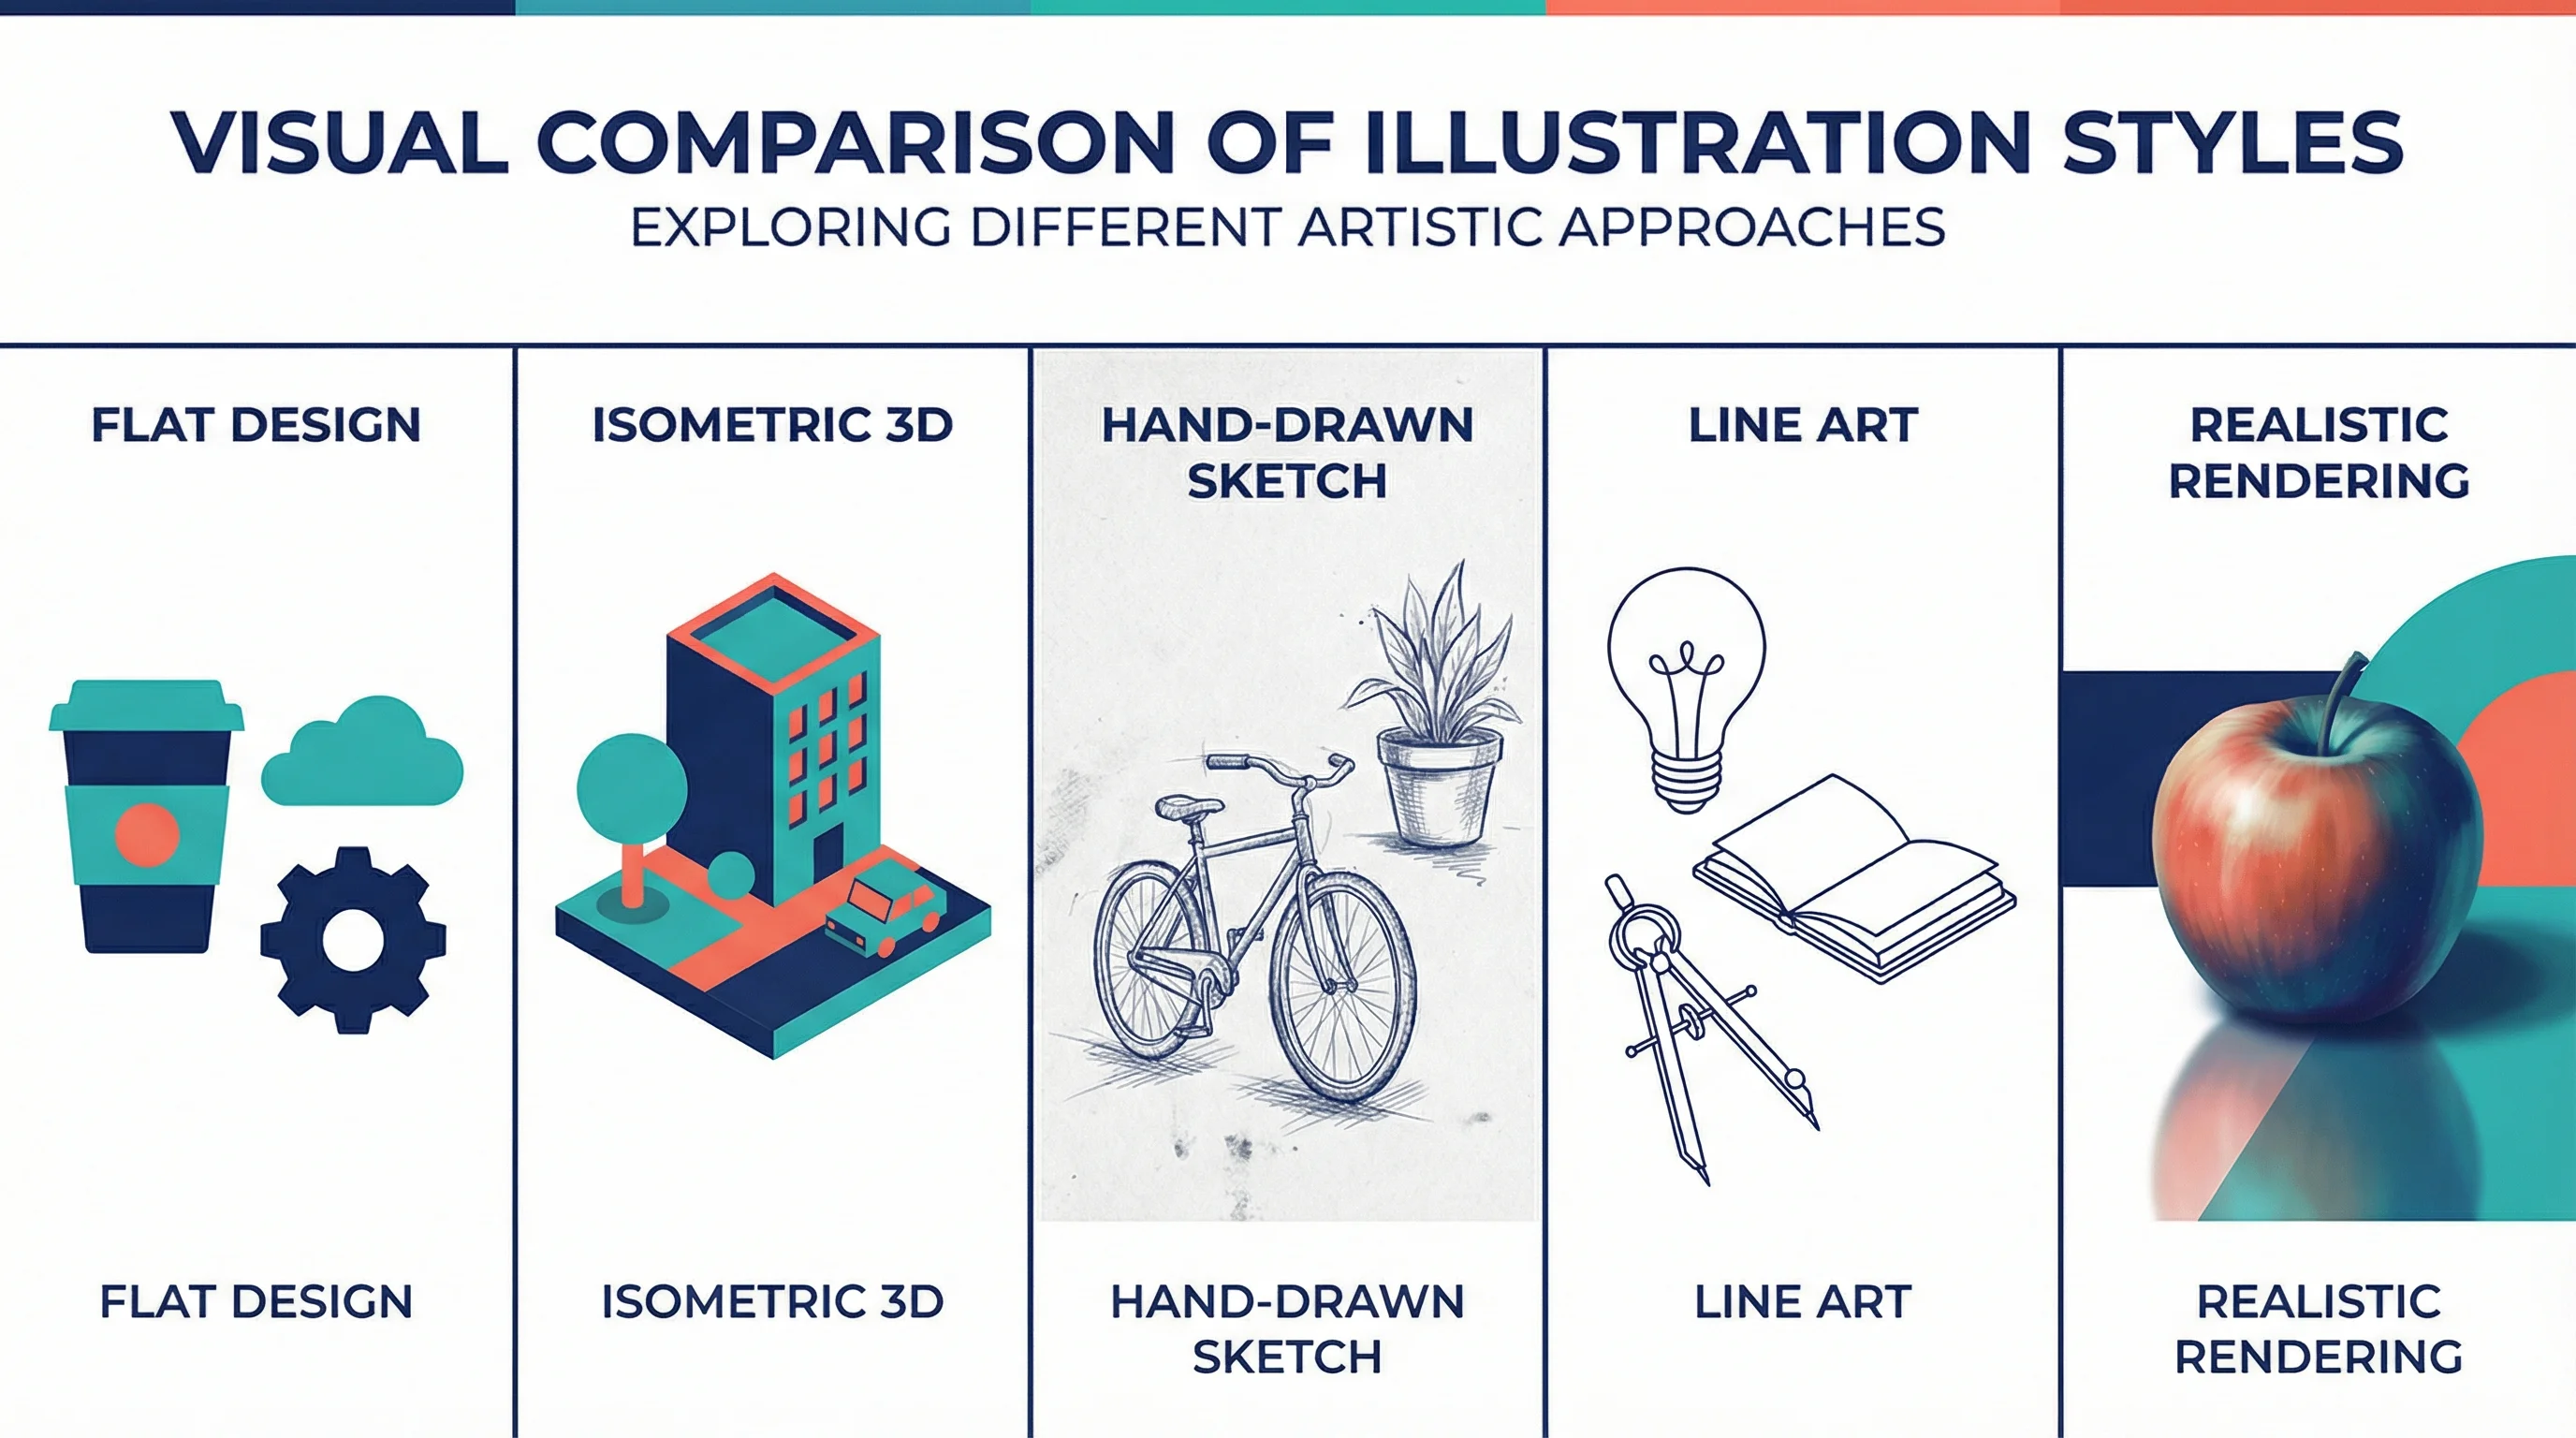
15 Illustration and Infographic Design Styles Explained (2026)
Explore 15 illustration and infographic design styles with examples: flat, isometric, 3D, hand-drawn, minimalist, vector, cartoon, line art and more.
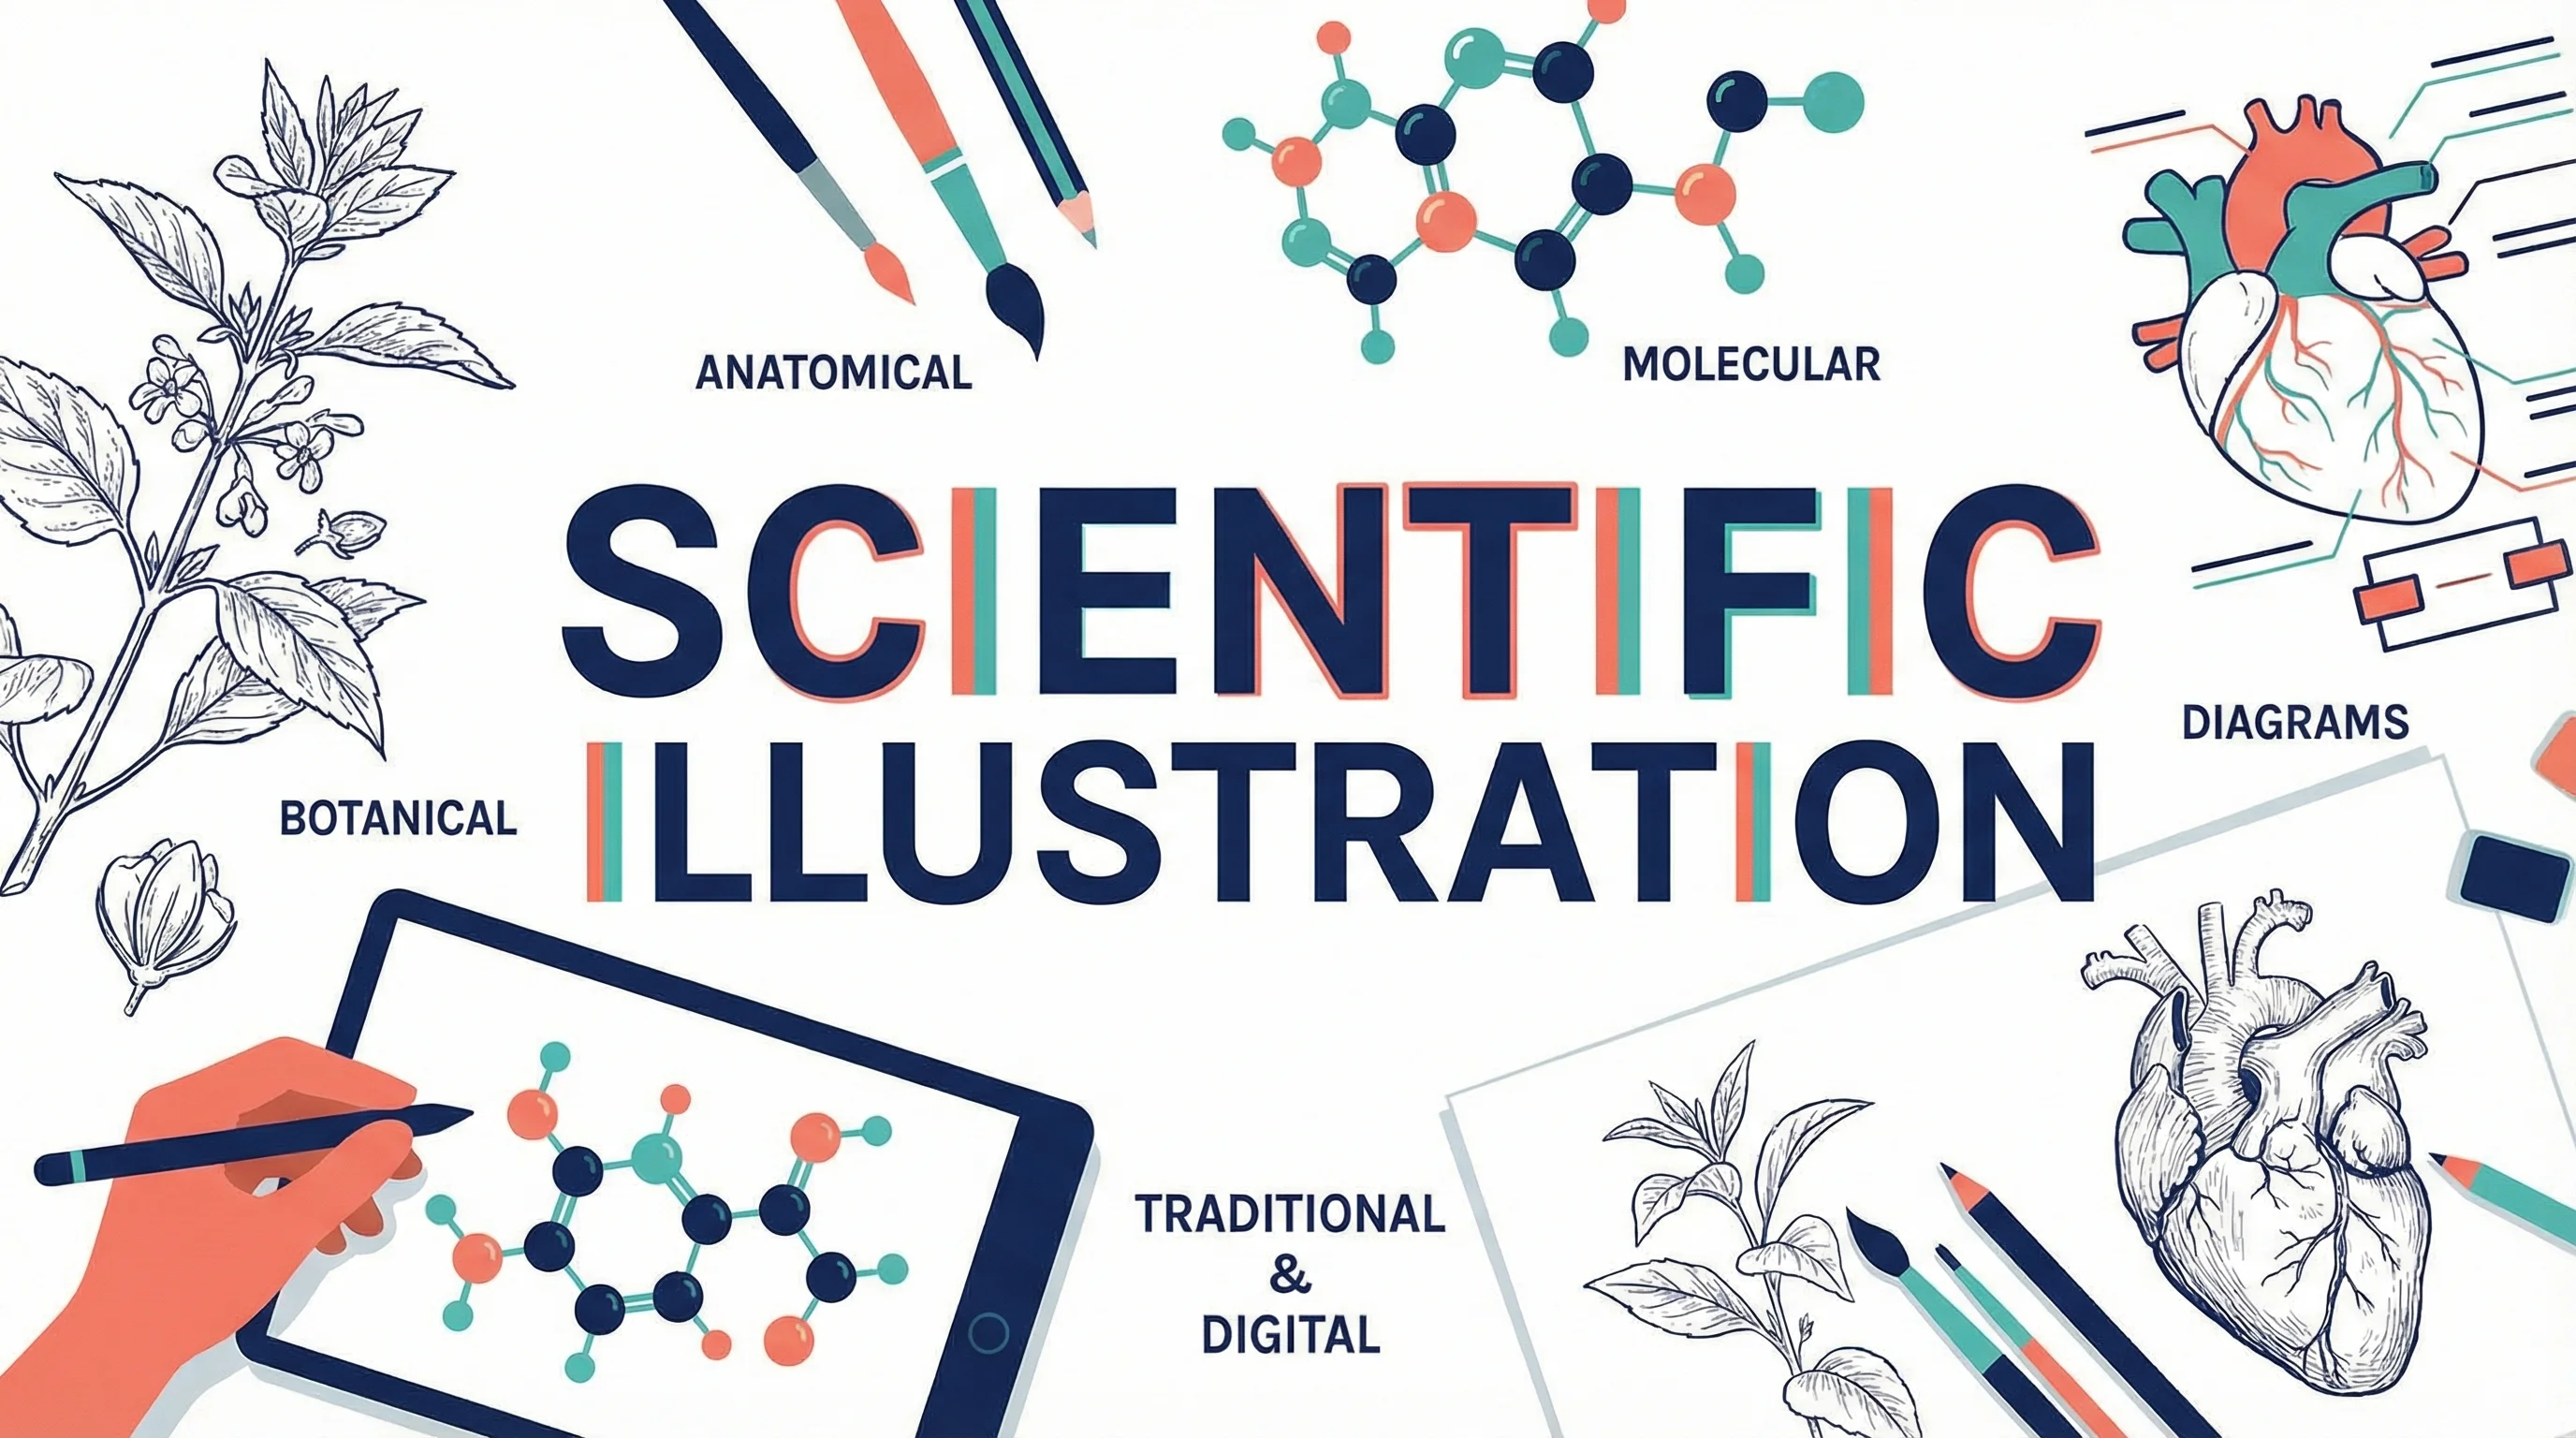
Scientific Illustration Guide 2026: Types, Tools & How to Get Started
What is scientific illustration? Learn the types (botanical, medical, technical), best free and paid tools, and how to create effective visuals.

Definition of Terms in Research: Thesis Examples, Format & Chapter 1 Guide
What definition of terms means in research and thesis Chapter 1, with examples, format rules, alphabetical order guidance, and common mistakes.
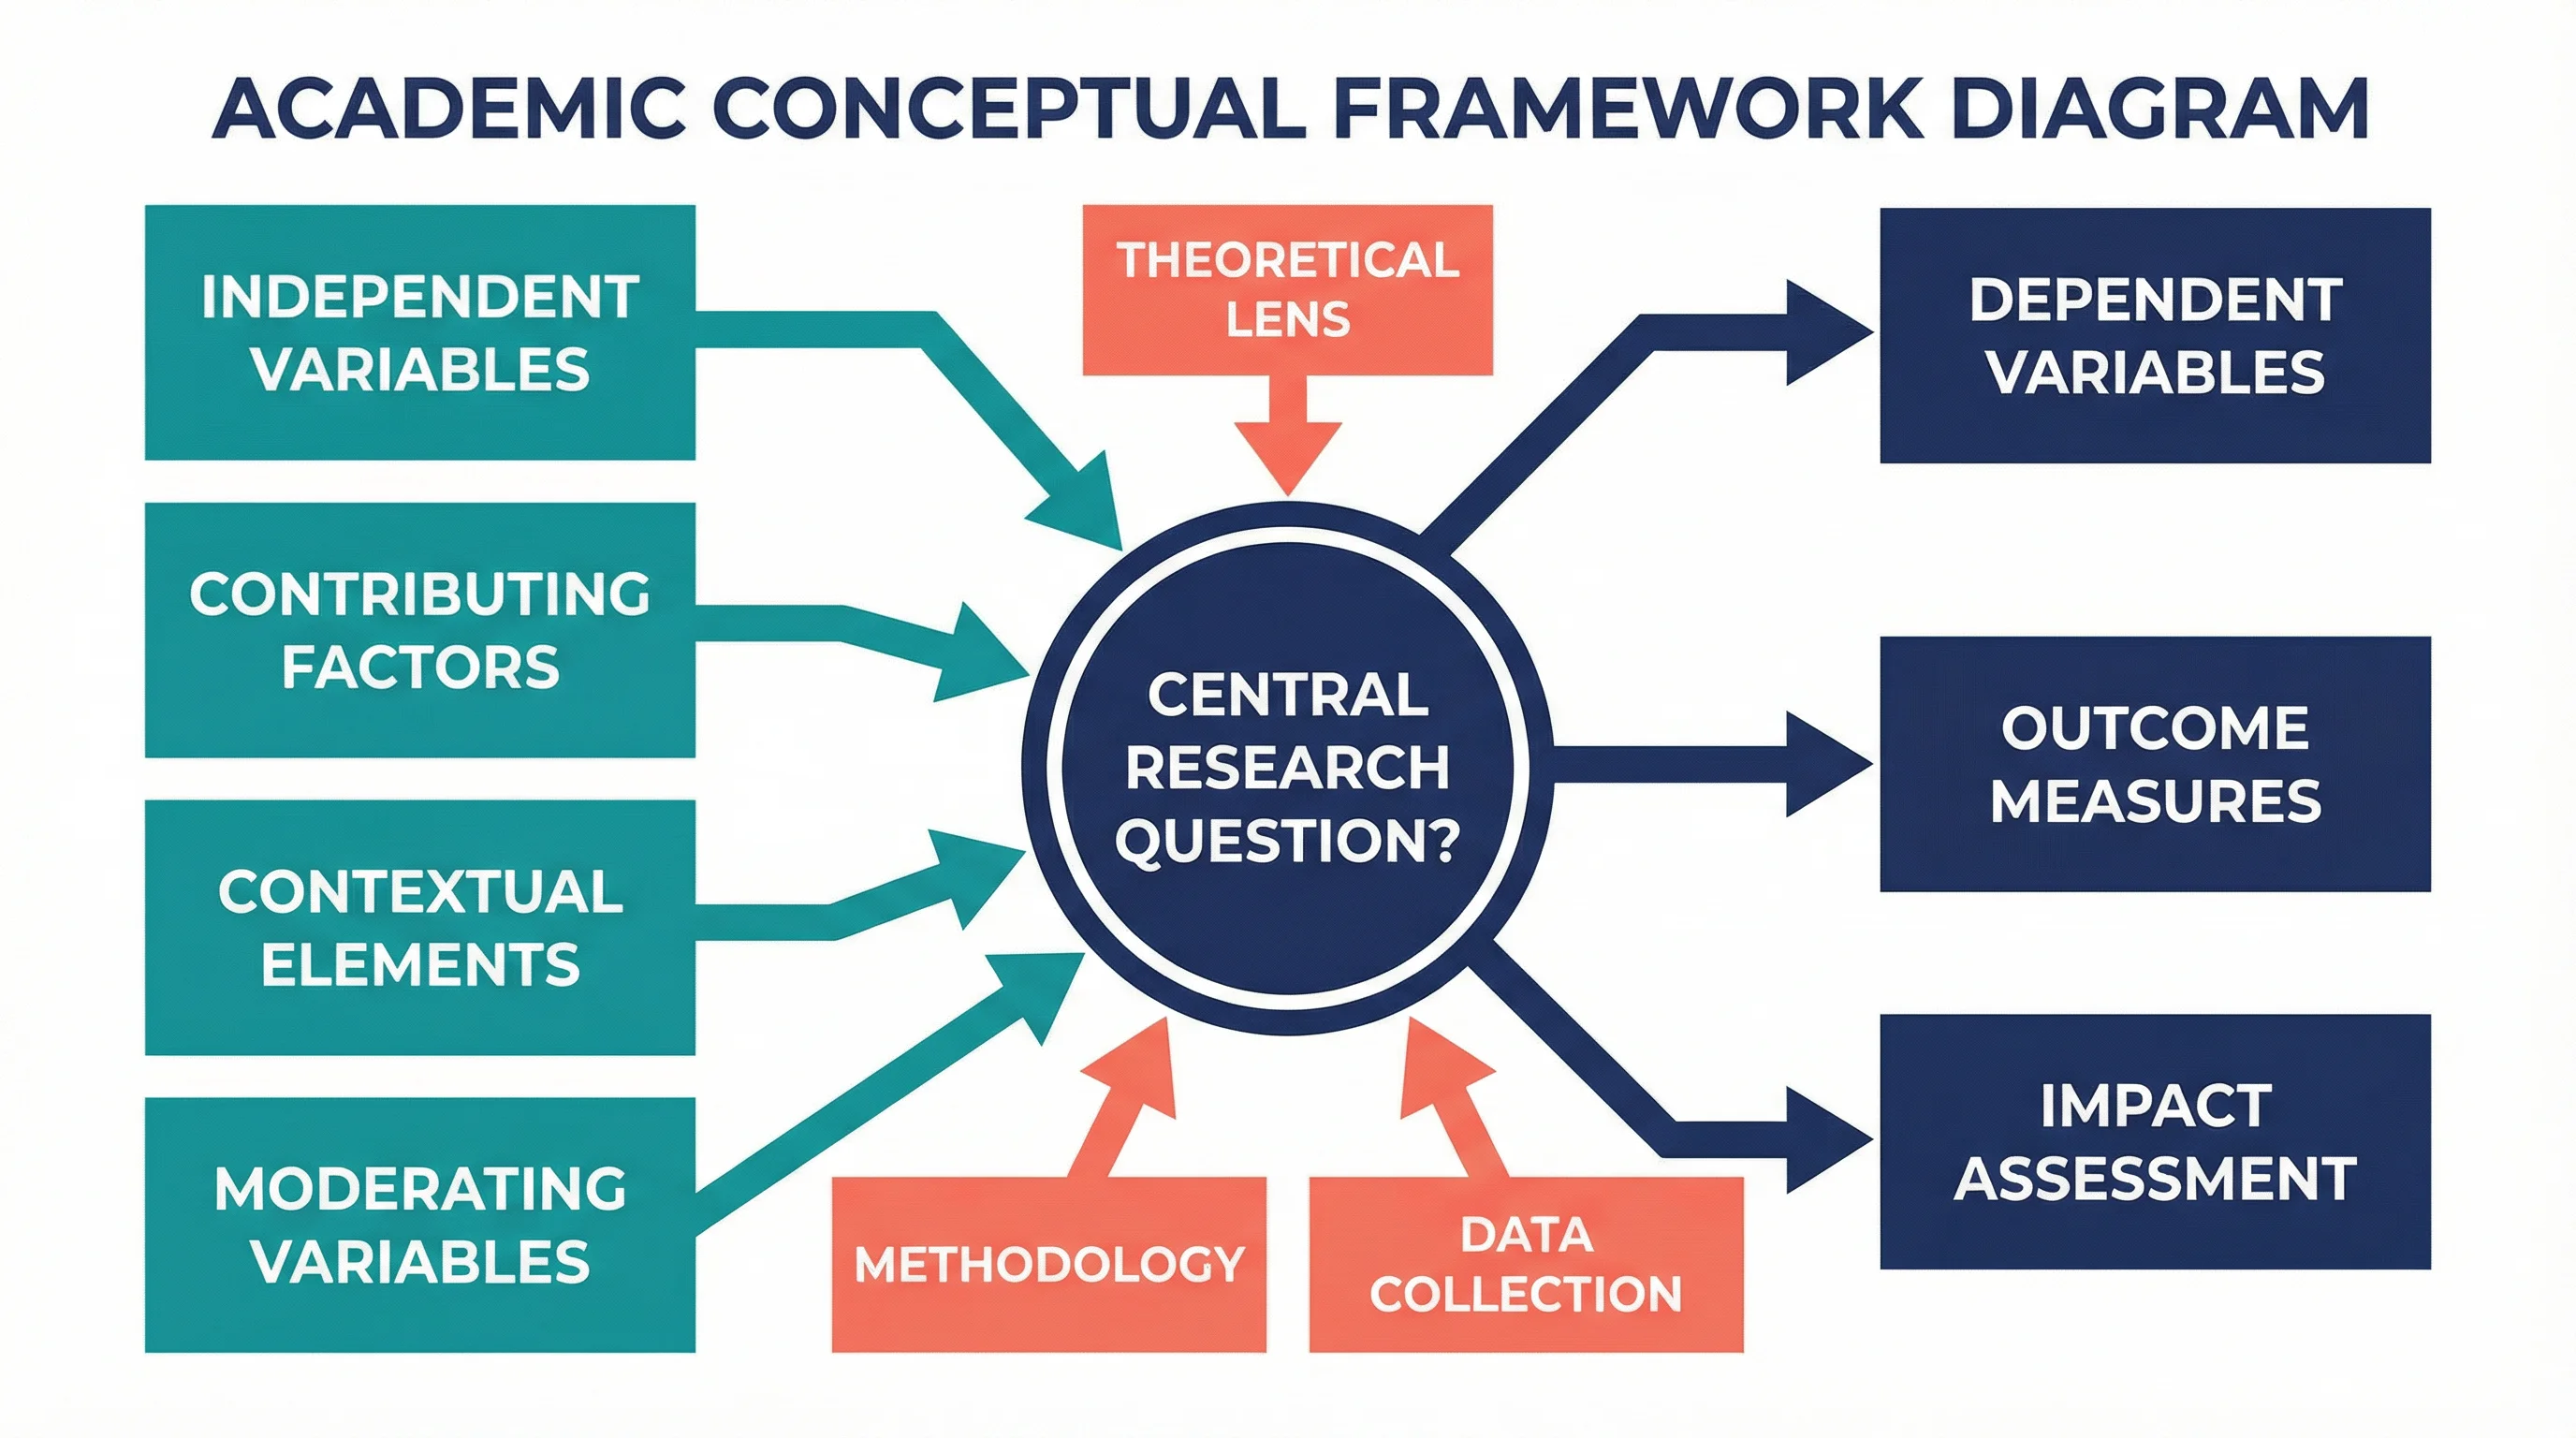
Framework vs Model in Research: Complete Guide to Understanding the Difference
Learn the key differences between frameworks and models in academic research, with examples, when to use each, and how to apply them in your methodology.