ブログ
STEM 教育者向けの指導のコツ、ツール比較、科学図解ガイド。AI による図の生成で、より良い授業教材を作成できます。

Infographic Design Styles & Trends: Flat, Isometric, Hand-Drawn and Minimalist
Compare infographic design styles and trends: flat, isometric, hand-drawn, minimalist, 3D and editorial layouts, with examples and selection rules.
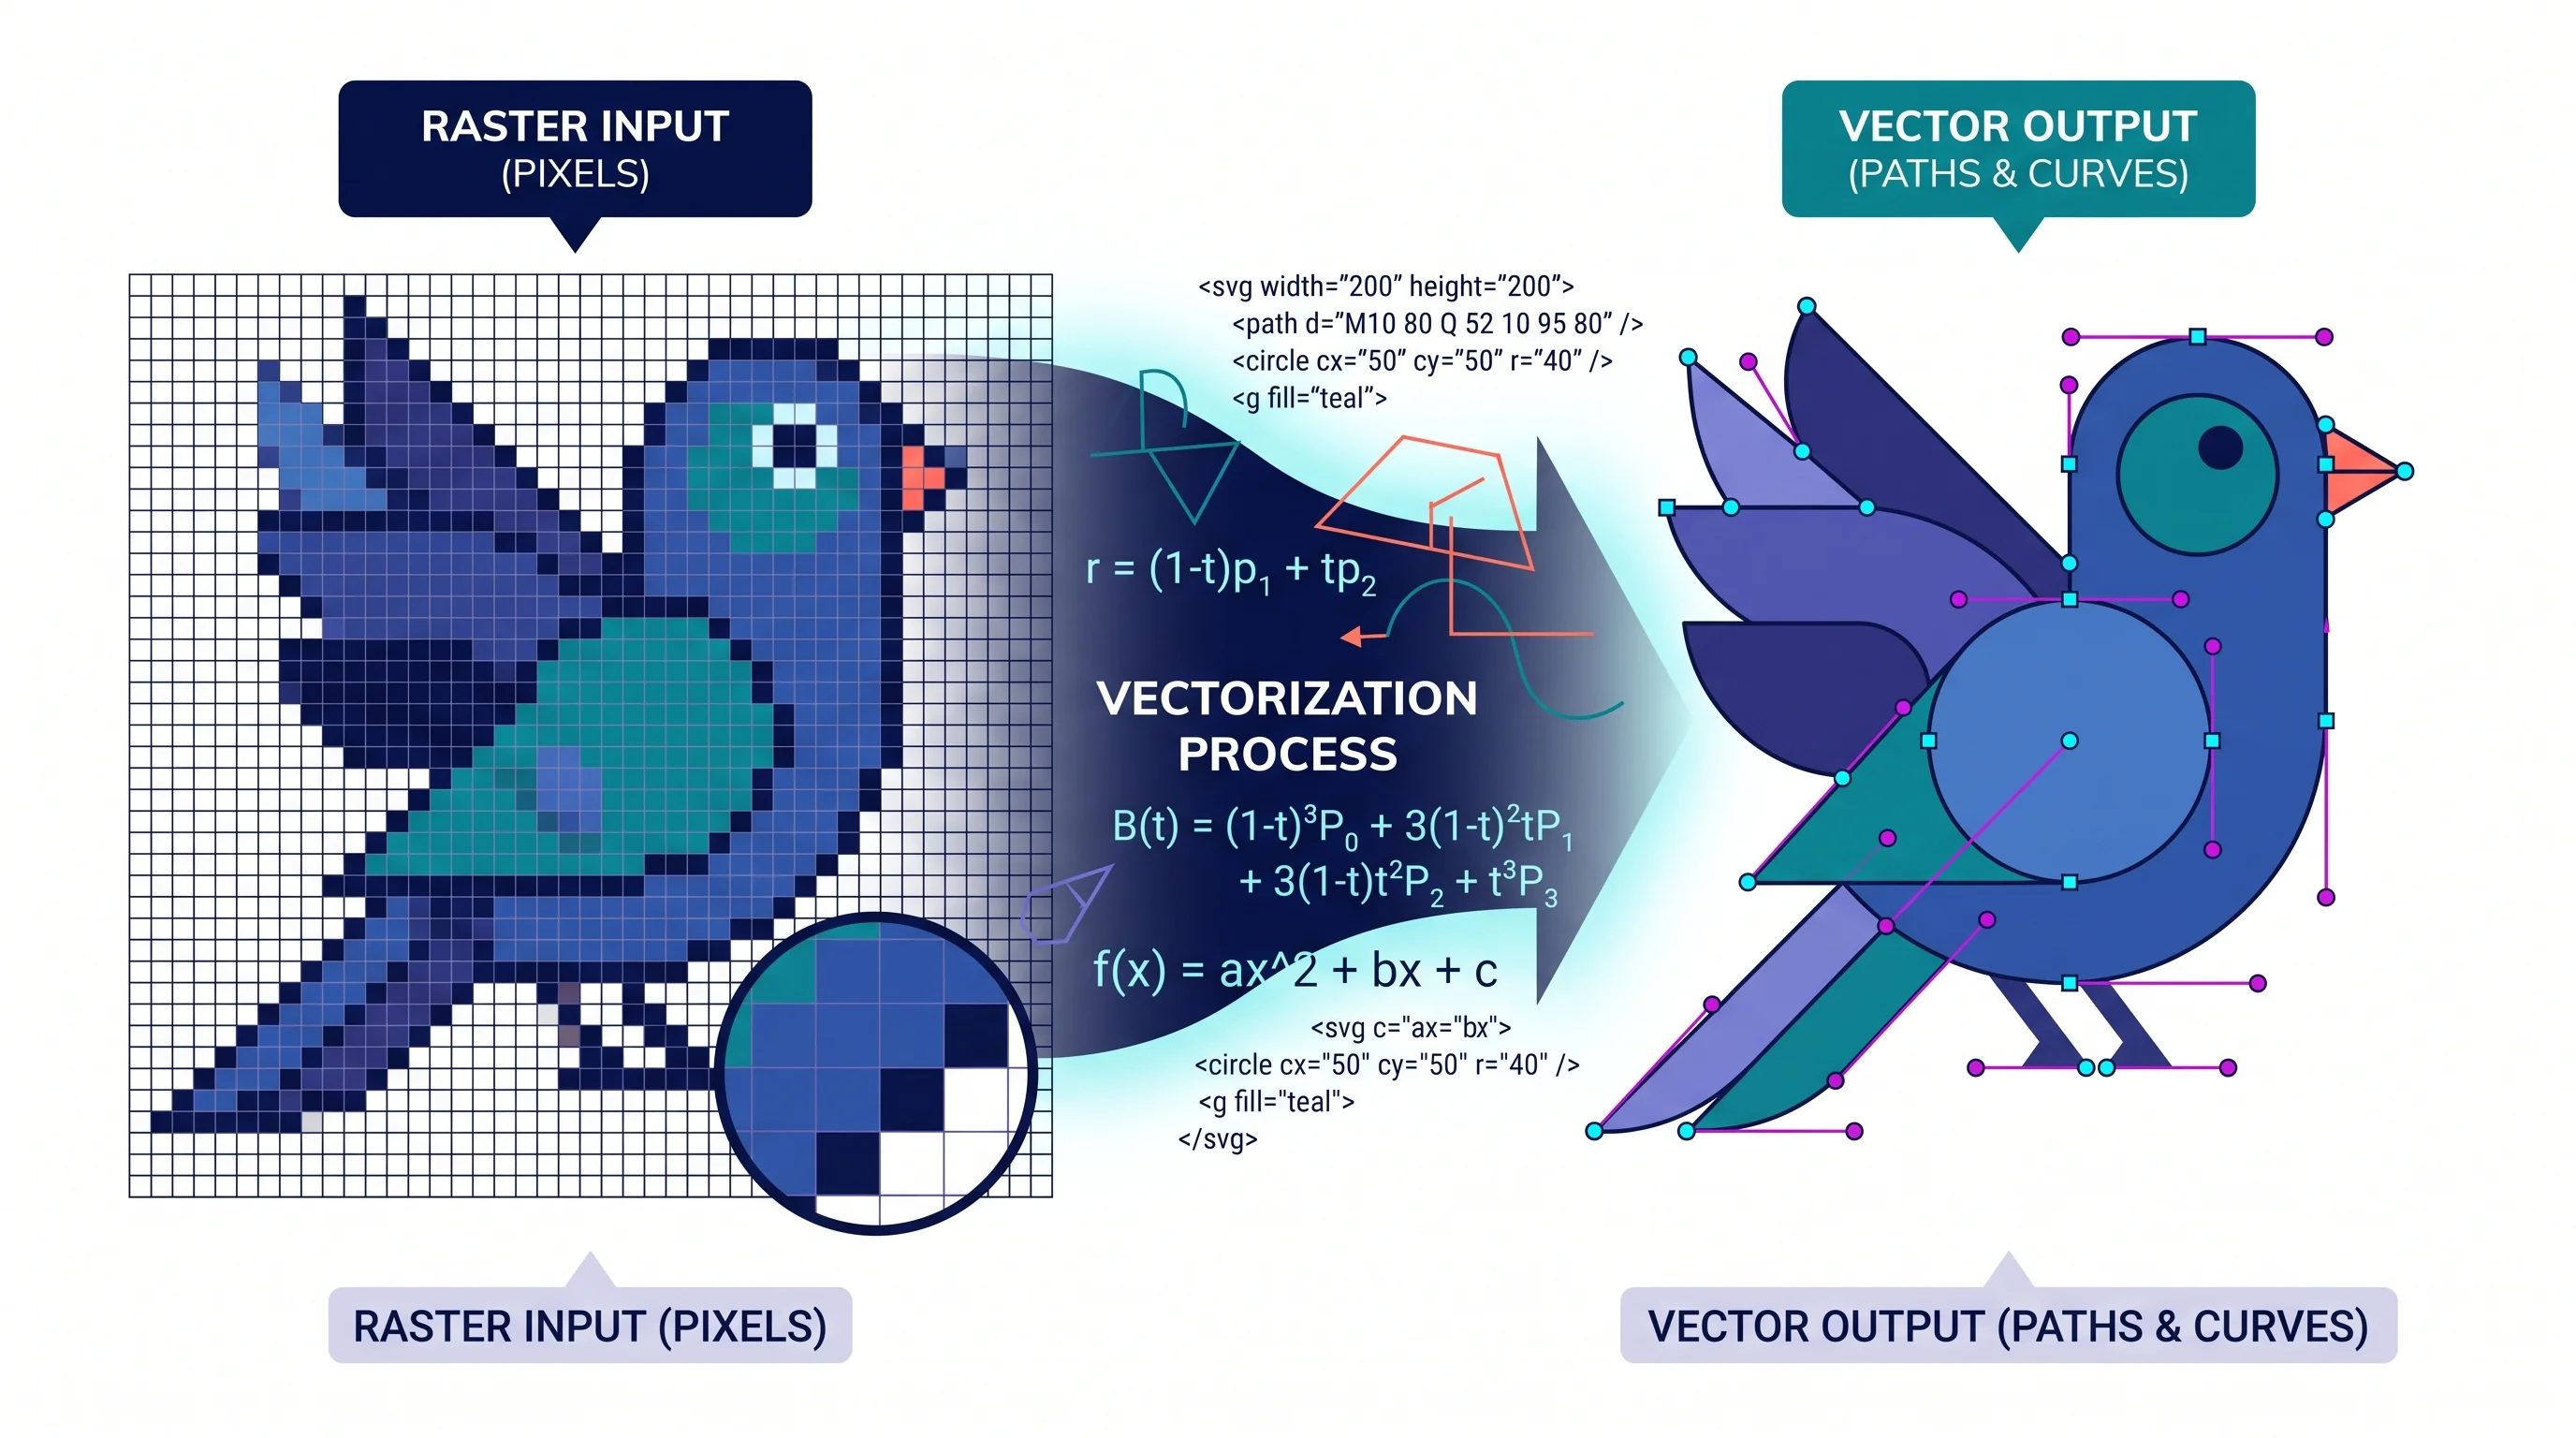
How to Create a Vector Image: A Complete Guide for Beginners and Researchers
Learn how to create vector images using Inkscape, Illustrator, and AI tools. Covers the SVG format, tracing raster images, and best practices for illustration.
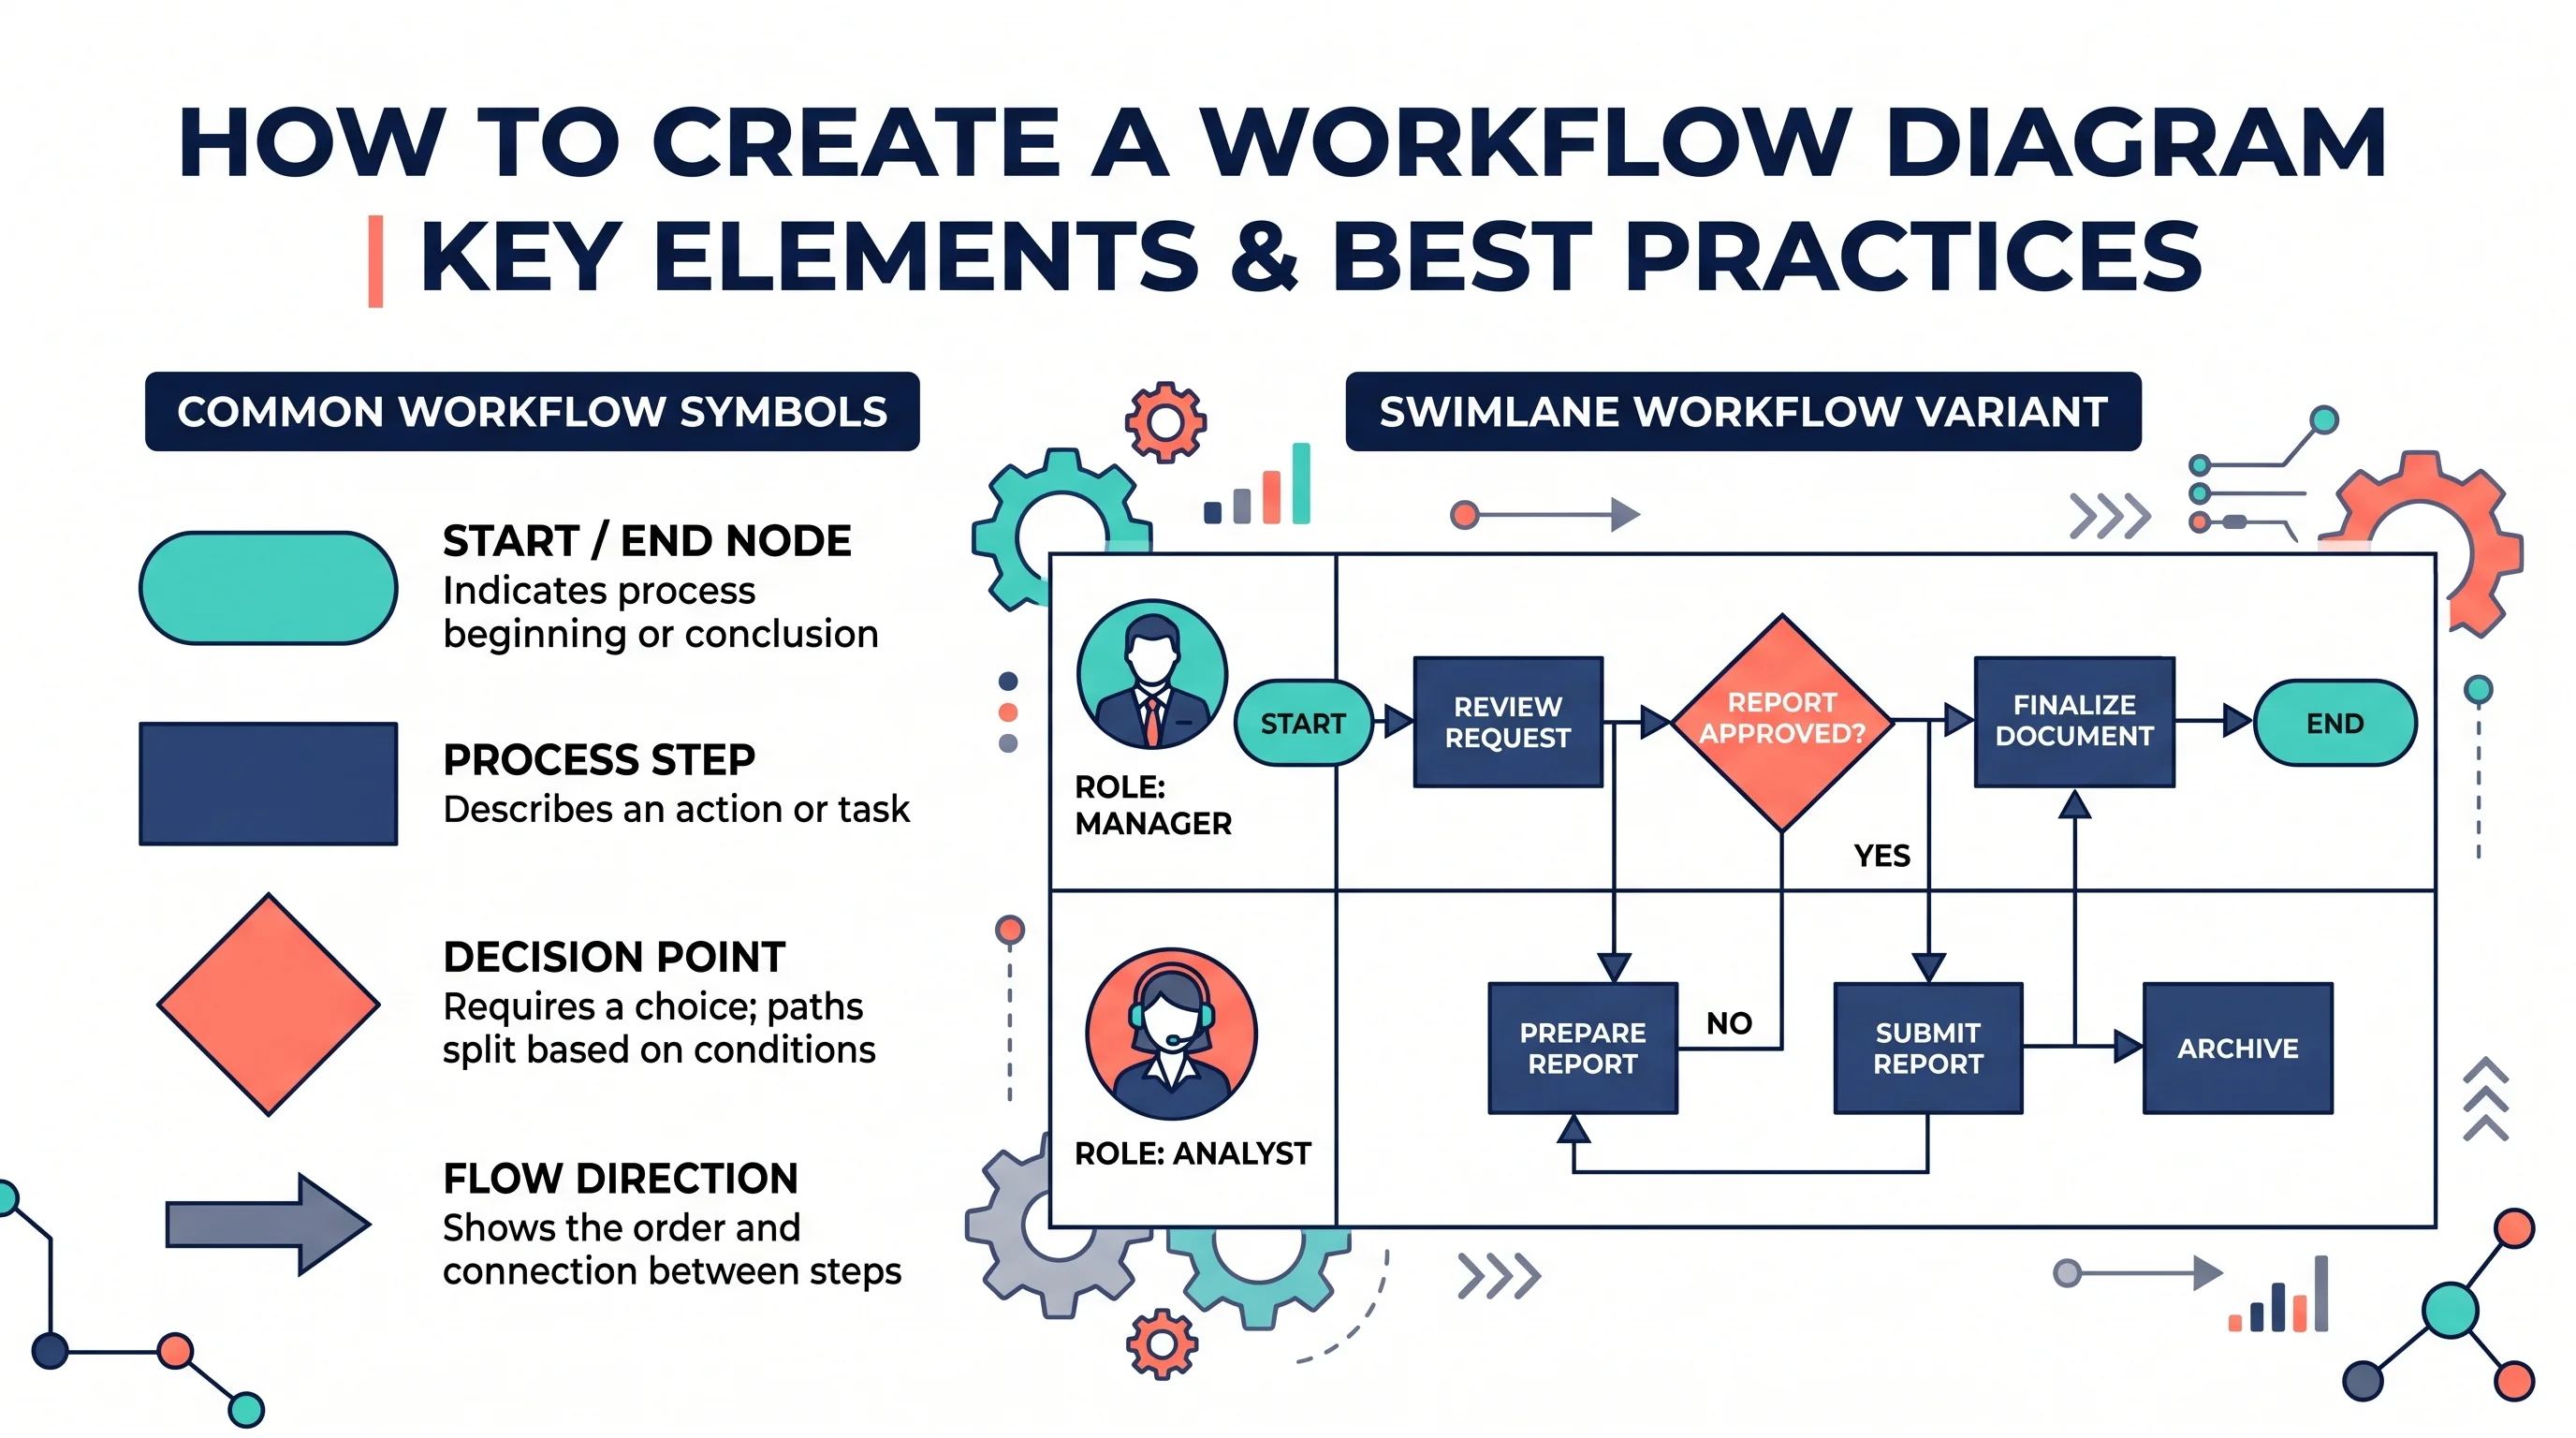
How to Create a Workflow Diagram: Step-by-Step Guide with Examples
Learn how to create a workflow diagram for research, business processes, and team projects, with symbols, types, best practices, and free tools.
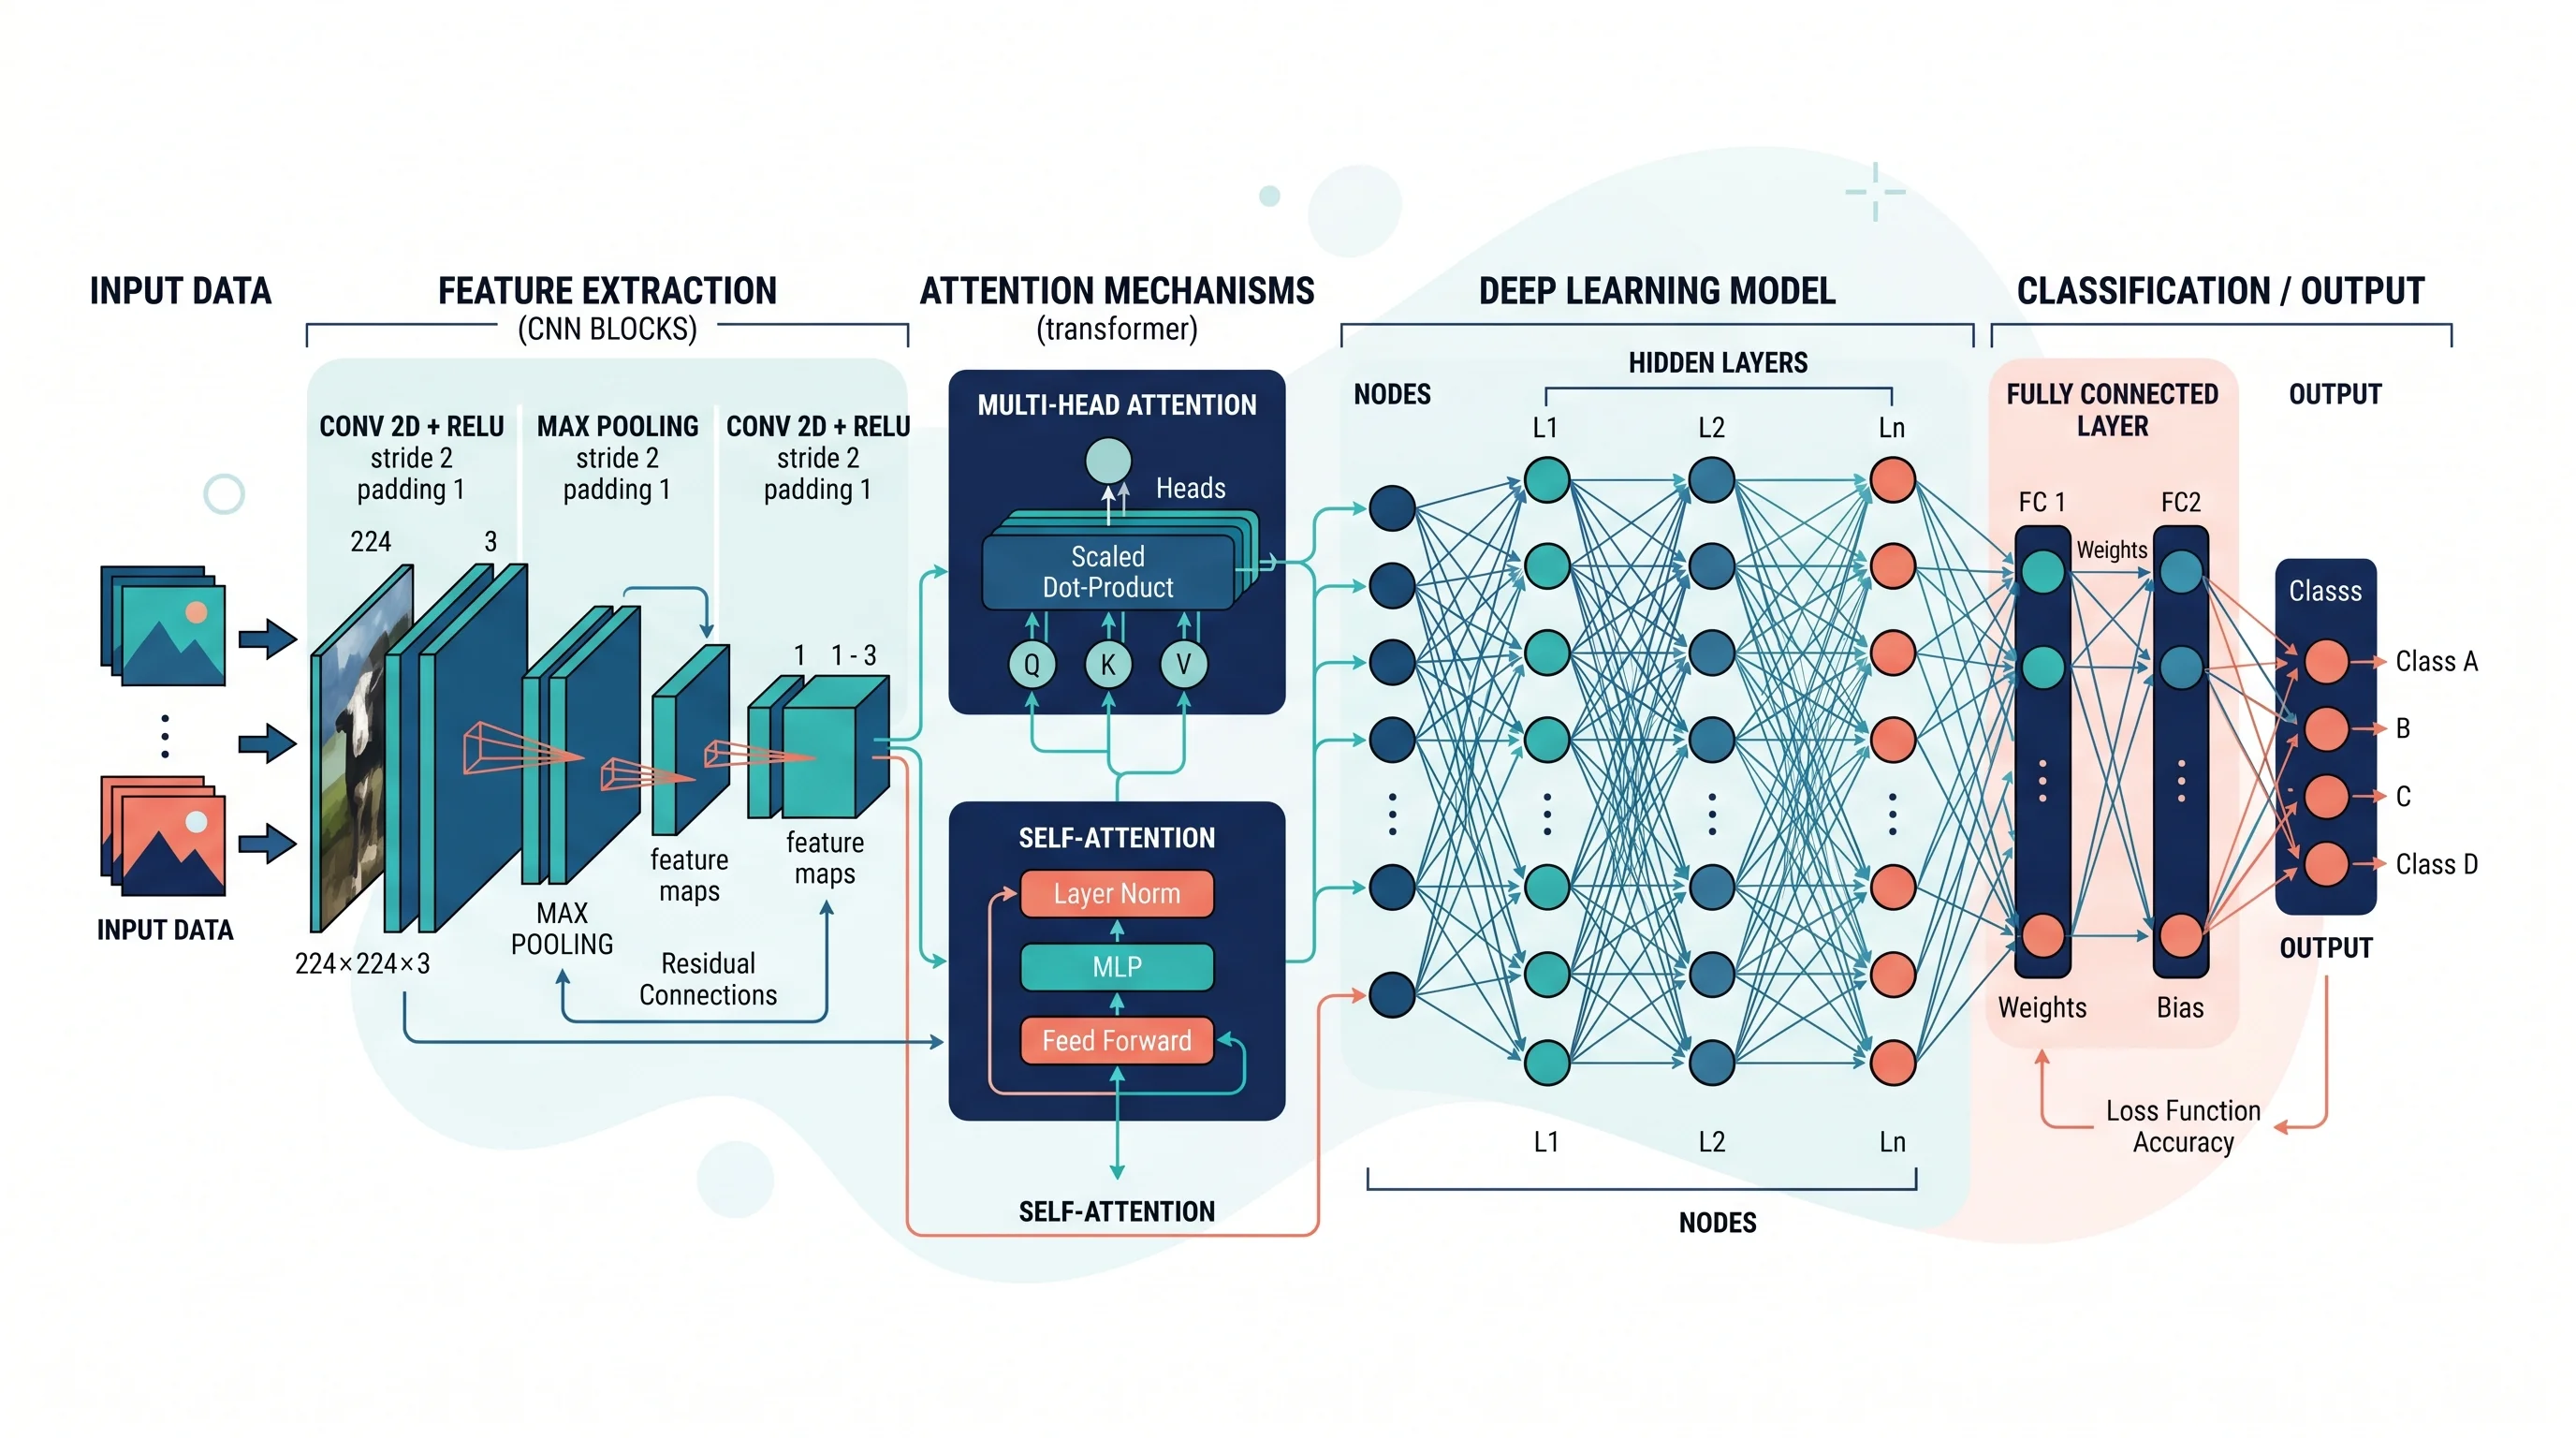
How to Draw a Neural Network Architecture Diagram: A Complete Guide
Learn how to draw neural network architecture diagrams for CNNs, RNNs, Transformers, and more. A step-by-step guide with tools, examples, and best practices.
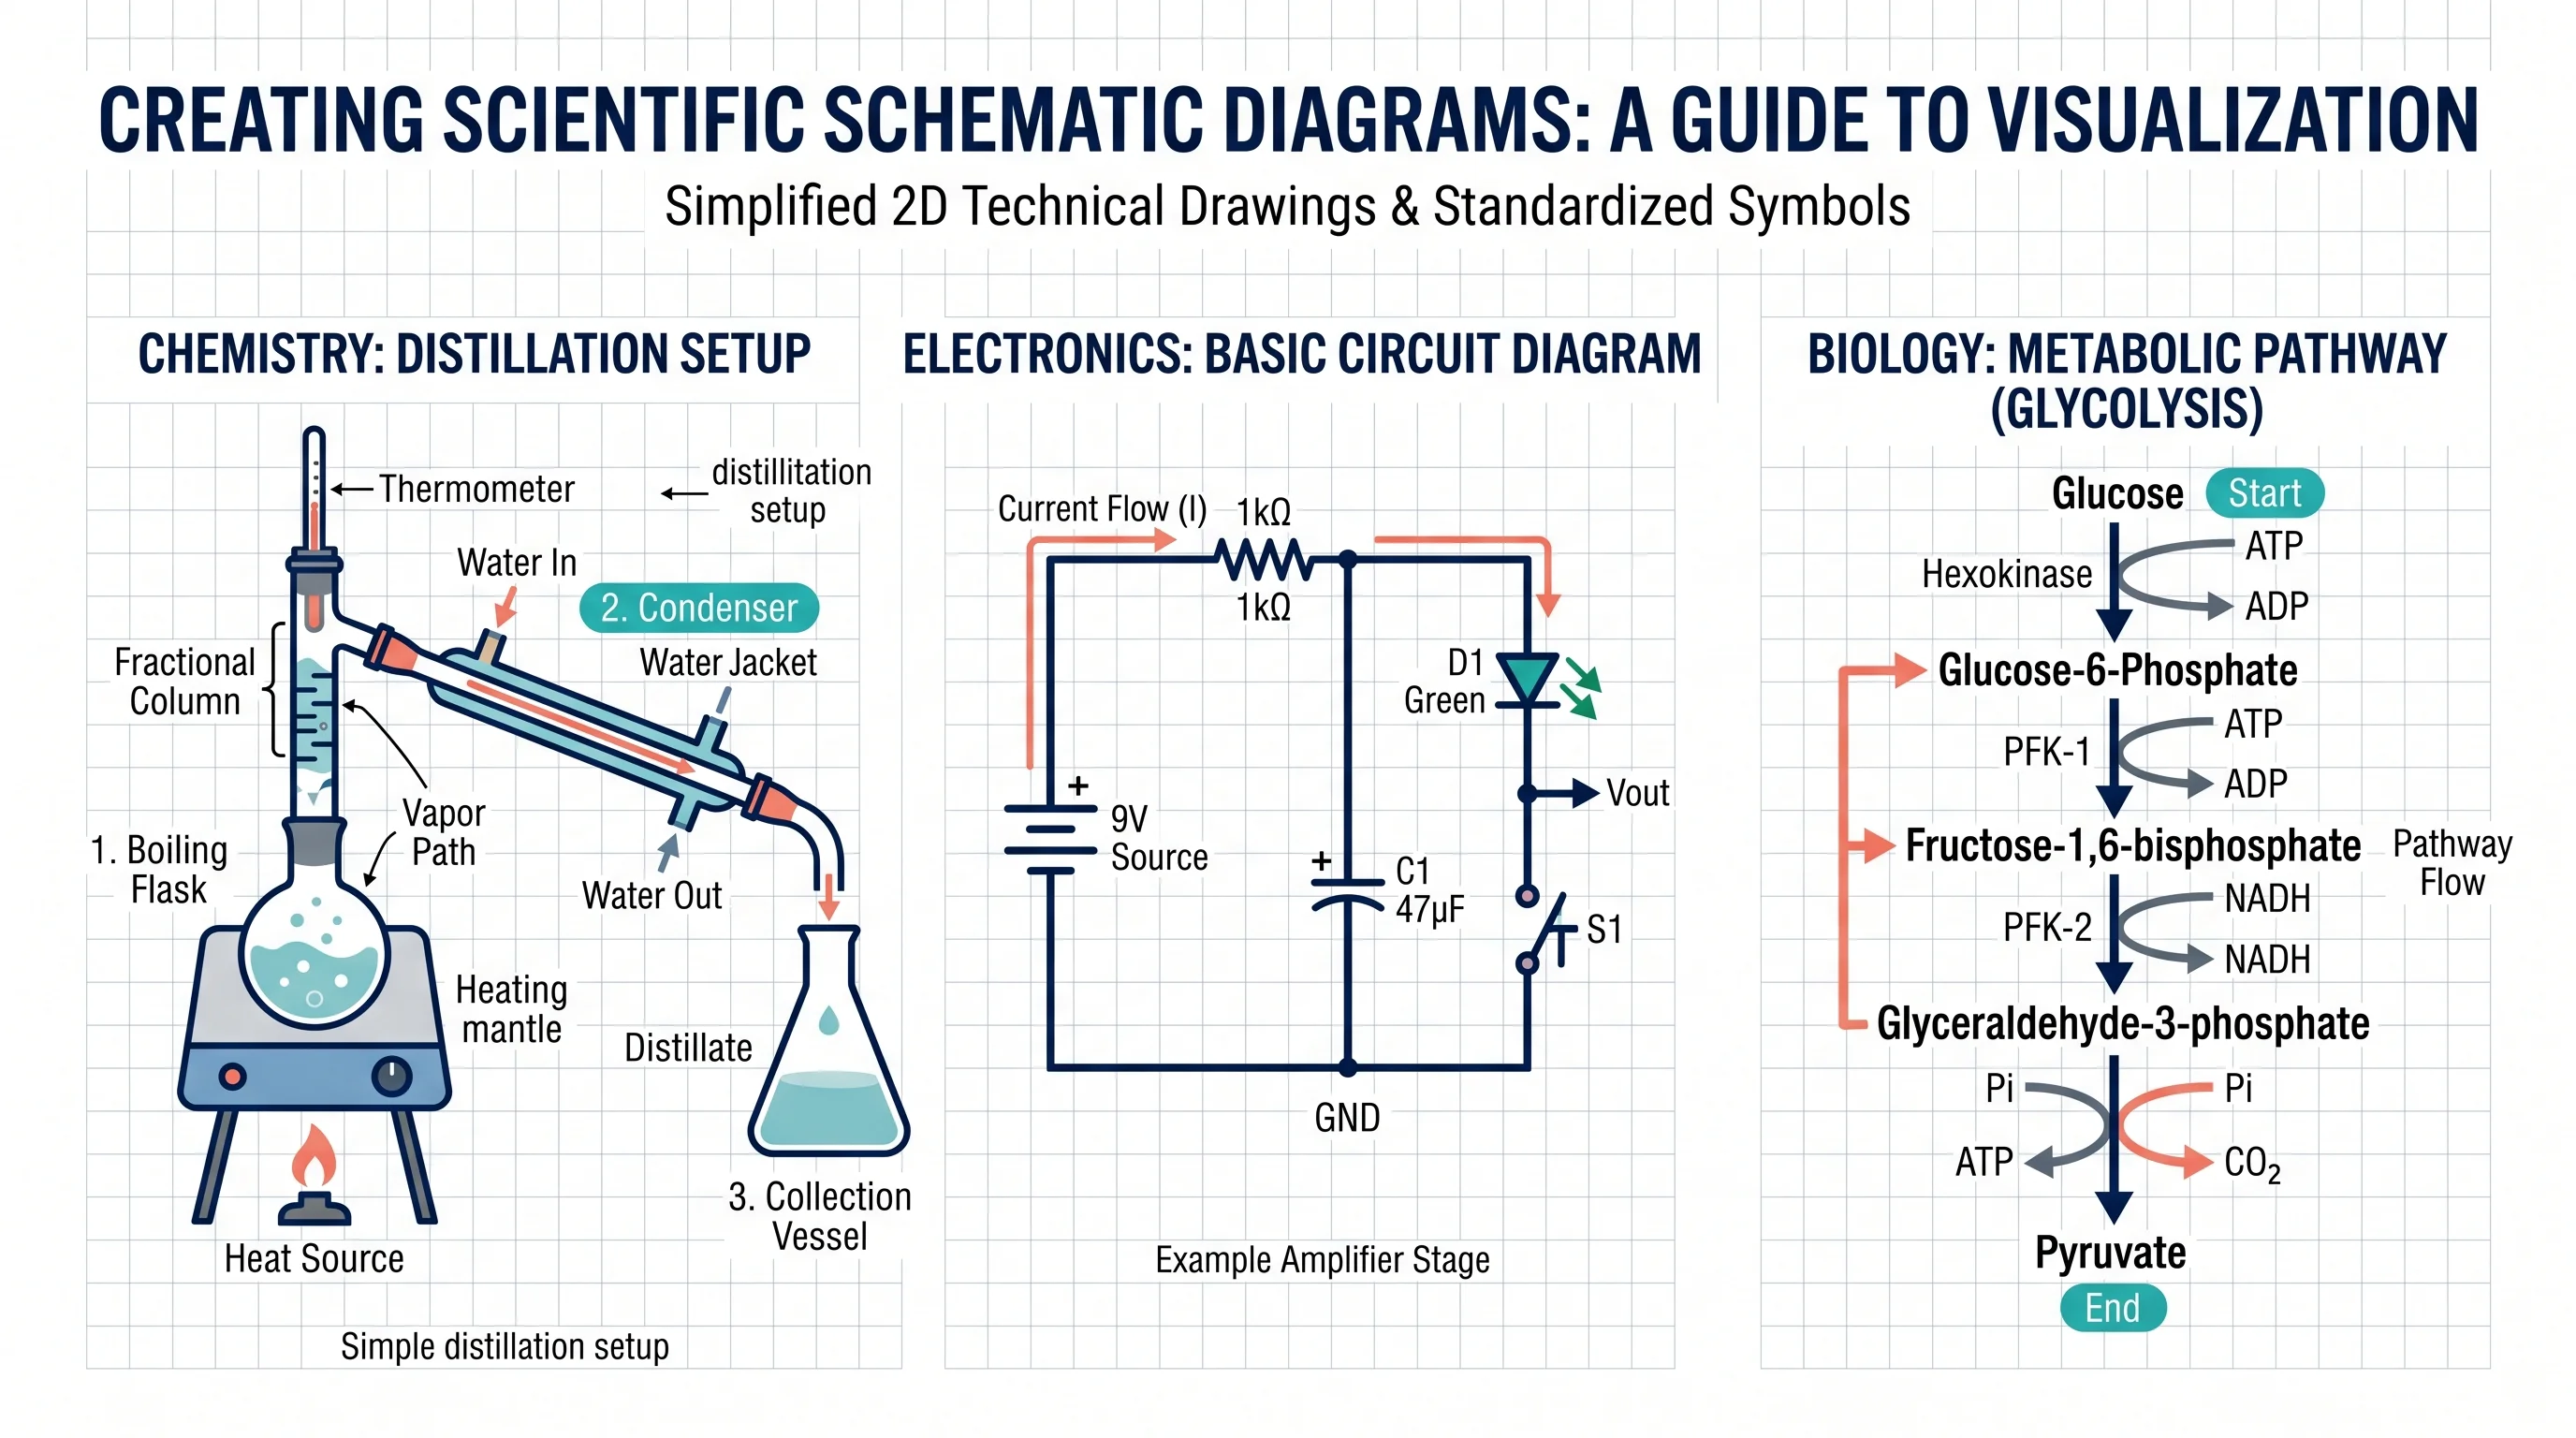
Schematic Diagram: Definition, Examples, How to Make One
What is a schematic diagram? Definition, lab and research examples, drawing rules and a step-by-step method, plus tools to make one quickly.
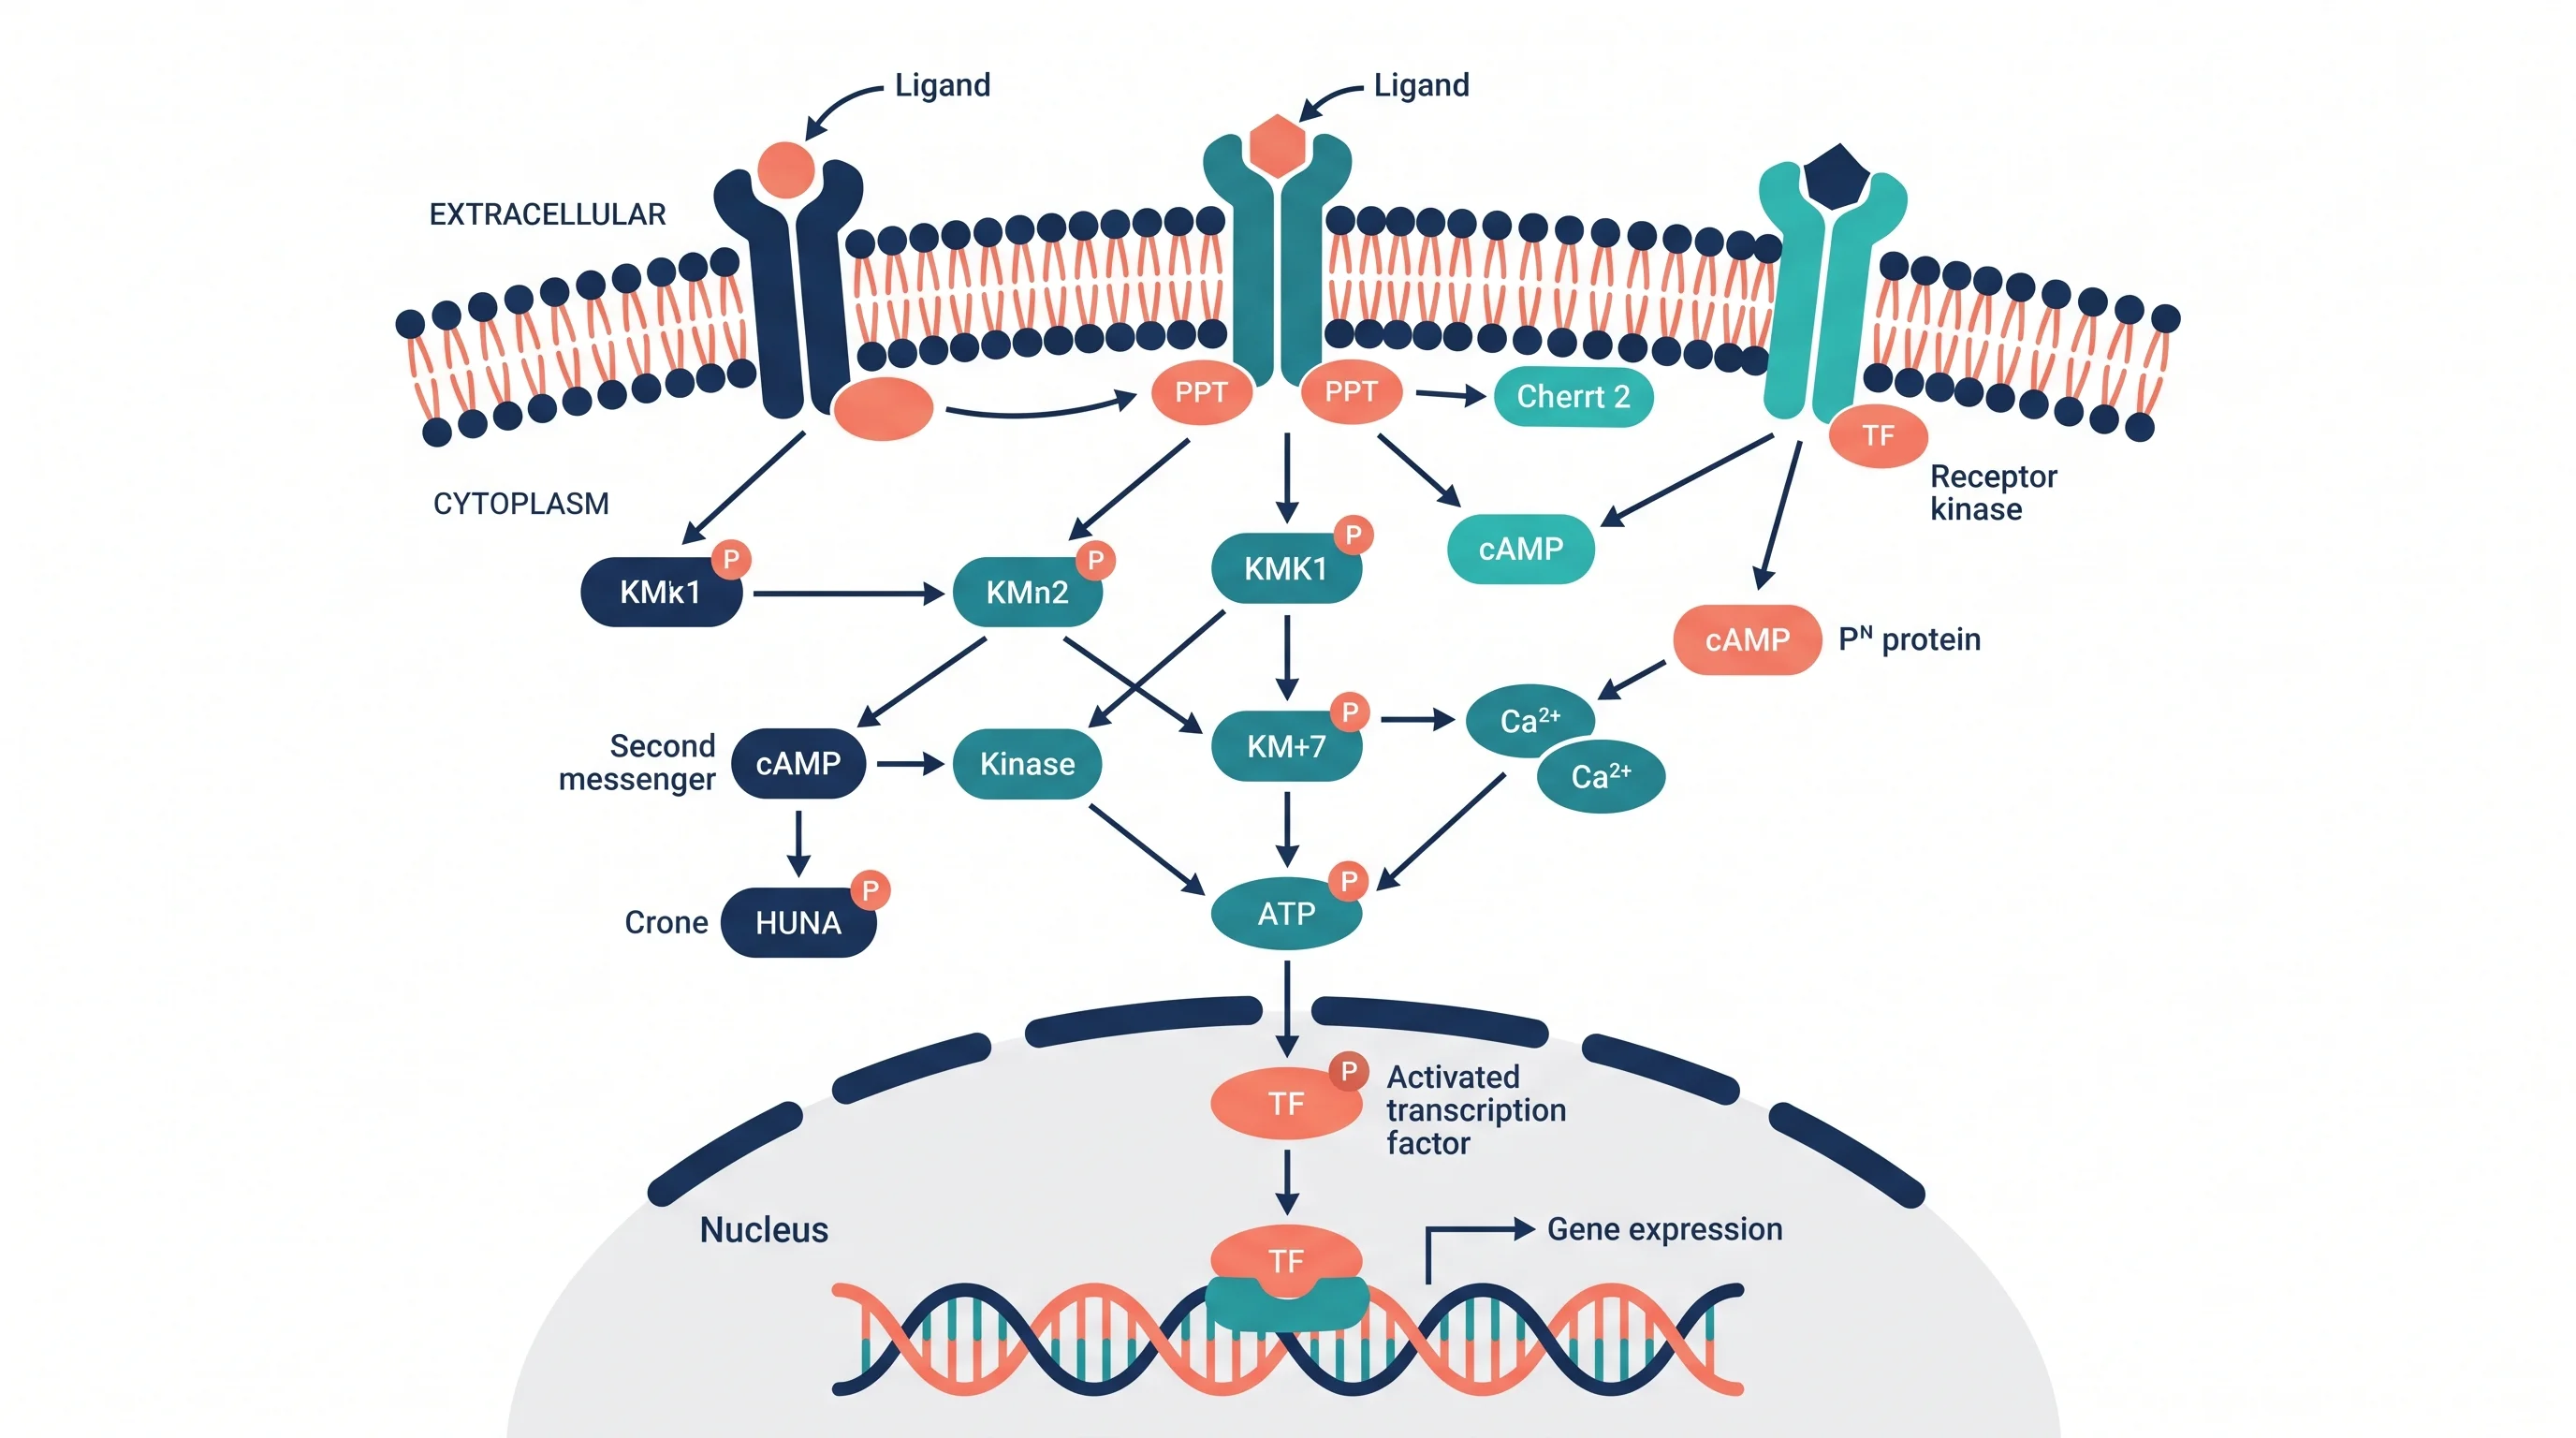
Signal Transduction Pathway Diagram: A Complete Guide for Biology Students and Researchers
Learn how to create signal transduction pathway diagrams for papers and presentations. Covers GPCR, RTK, MAPK, and Wnt pathways with tools and symbols.