ブログ
STEM 教育者向けの指導のコツ、ツール比較、科学図解ガイド。AI による図の生成で、より良い授業教材を作成できます。
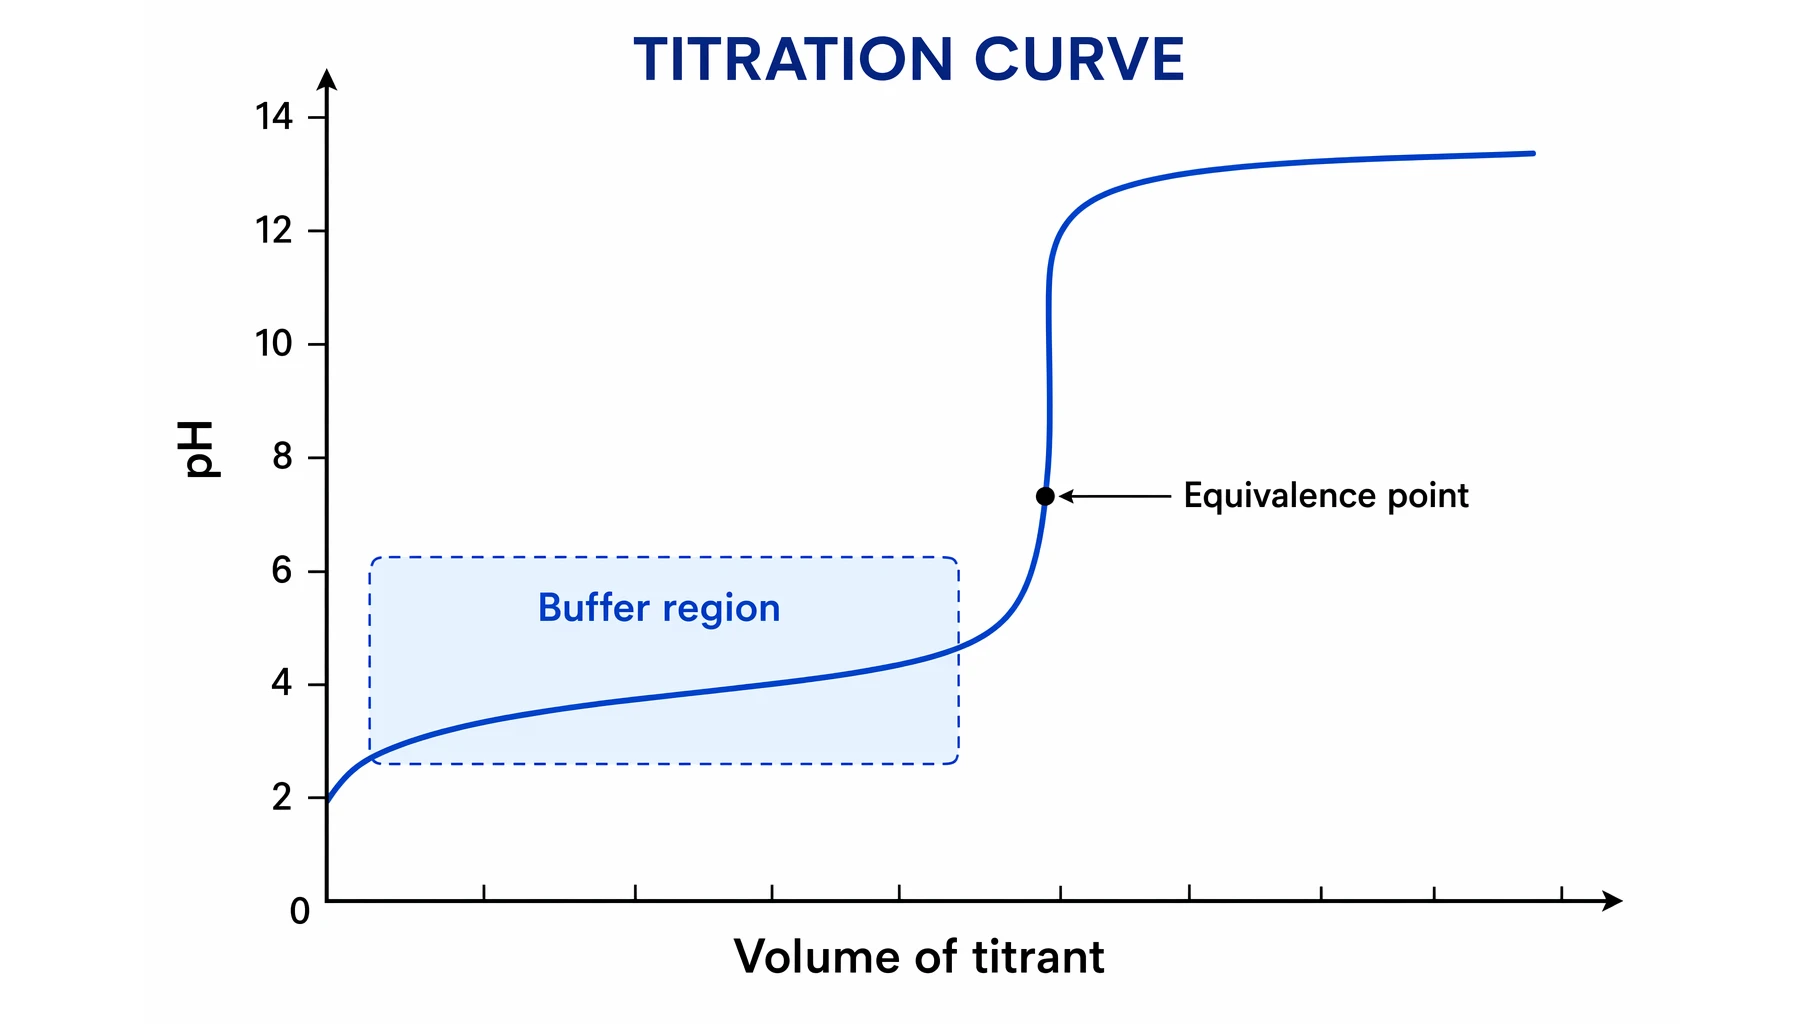
Titration Curve Explained: pH, Equivalence Point & pKa
A titration curve plots pH vs volume of titrant. Learn to read strong and weak acid curves, find the equivalence point, half-equivalence (pKa), and indicator.
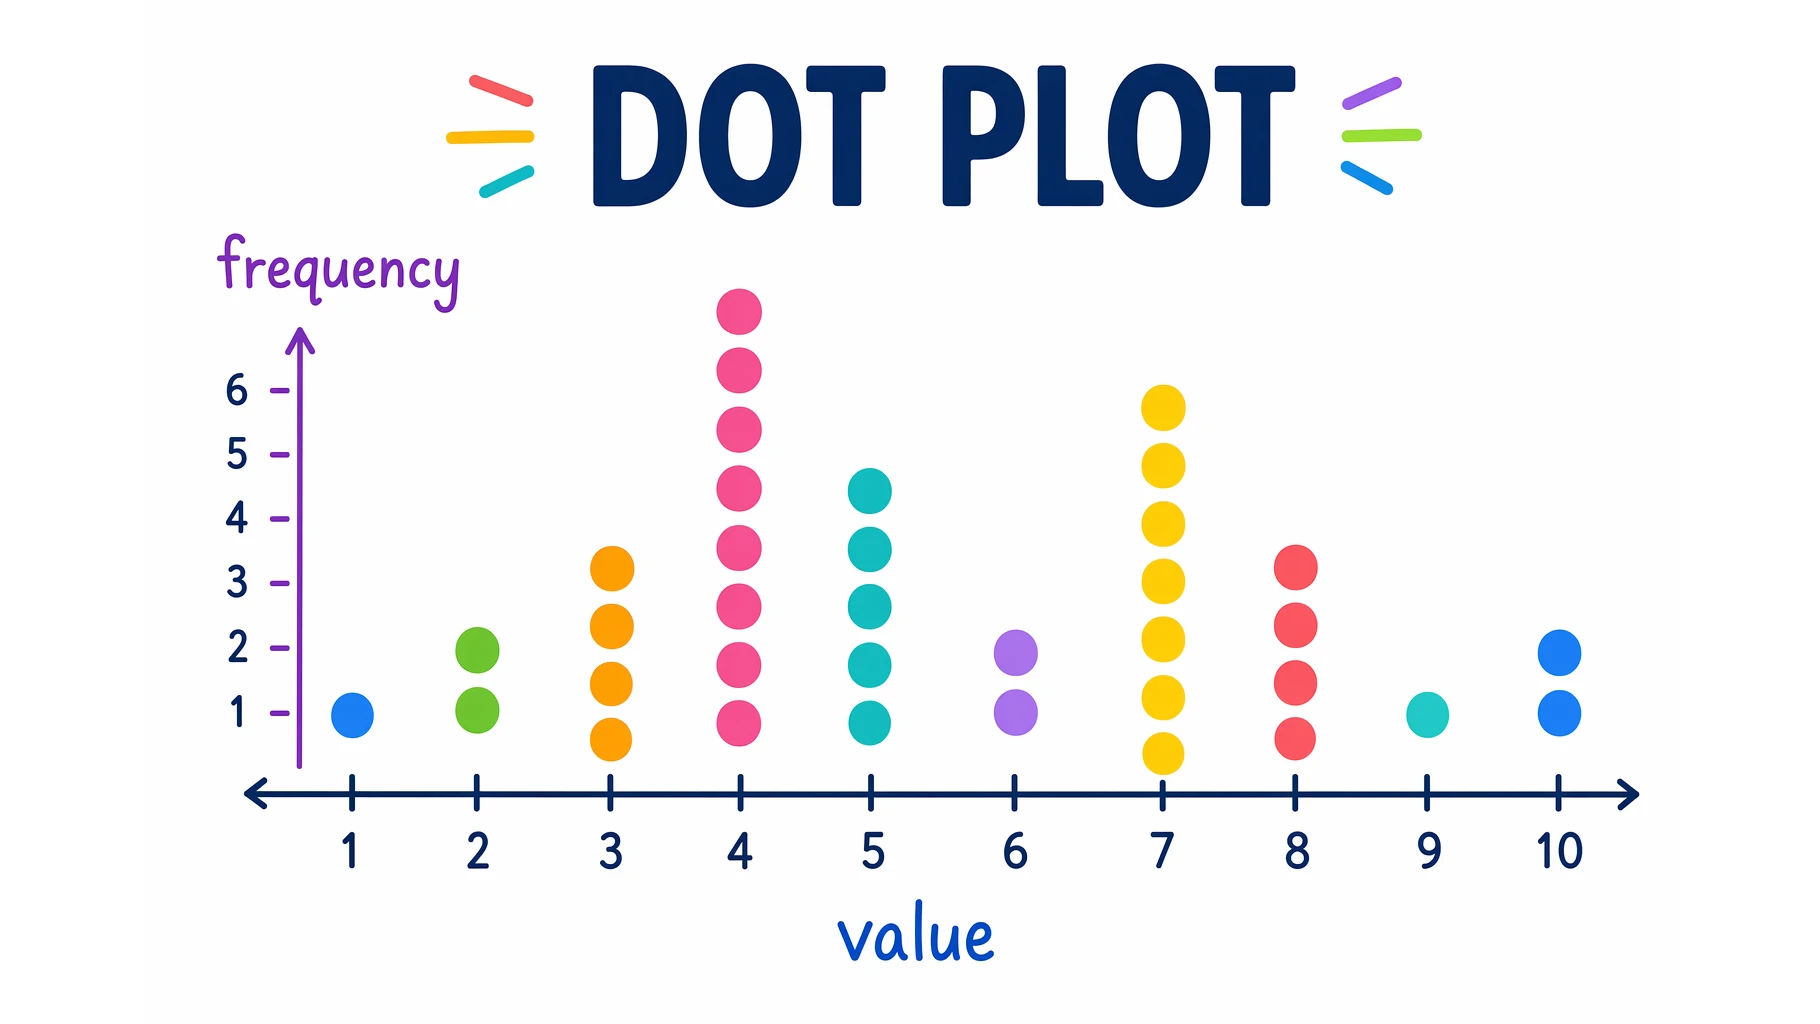
What Is a Dot Plot? Statistics Examples and How to Make One
A dot plot shows data frequency with stacked dots over a number line. Learn to make and read dot plots and find mean, median, mode, and range, with examples.
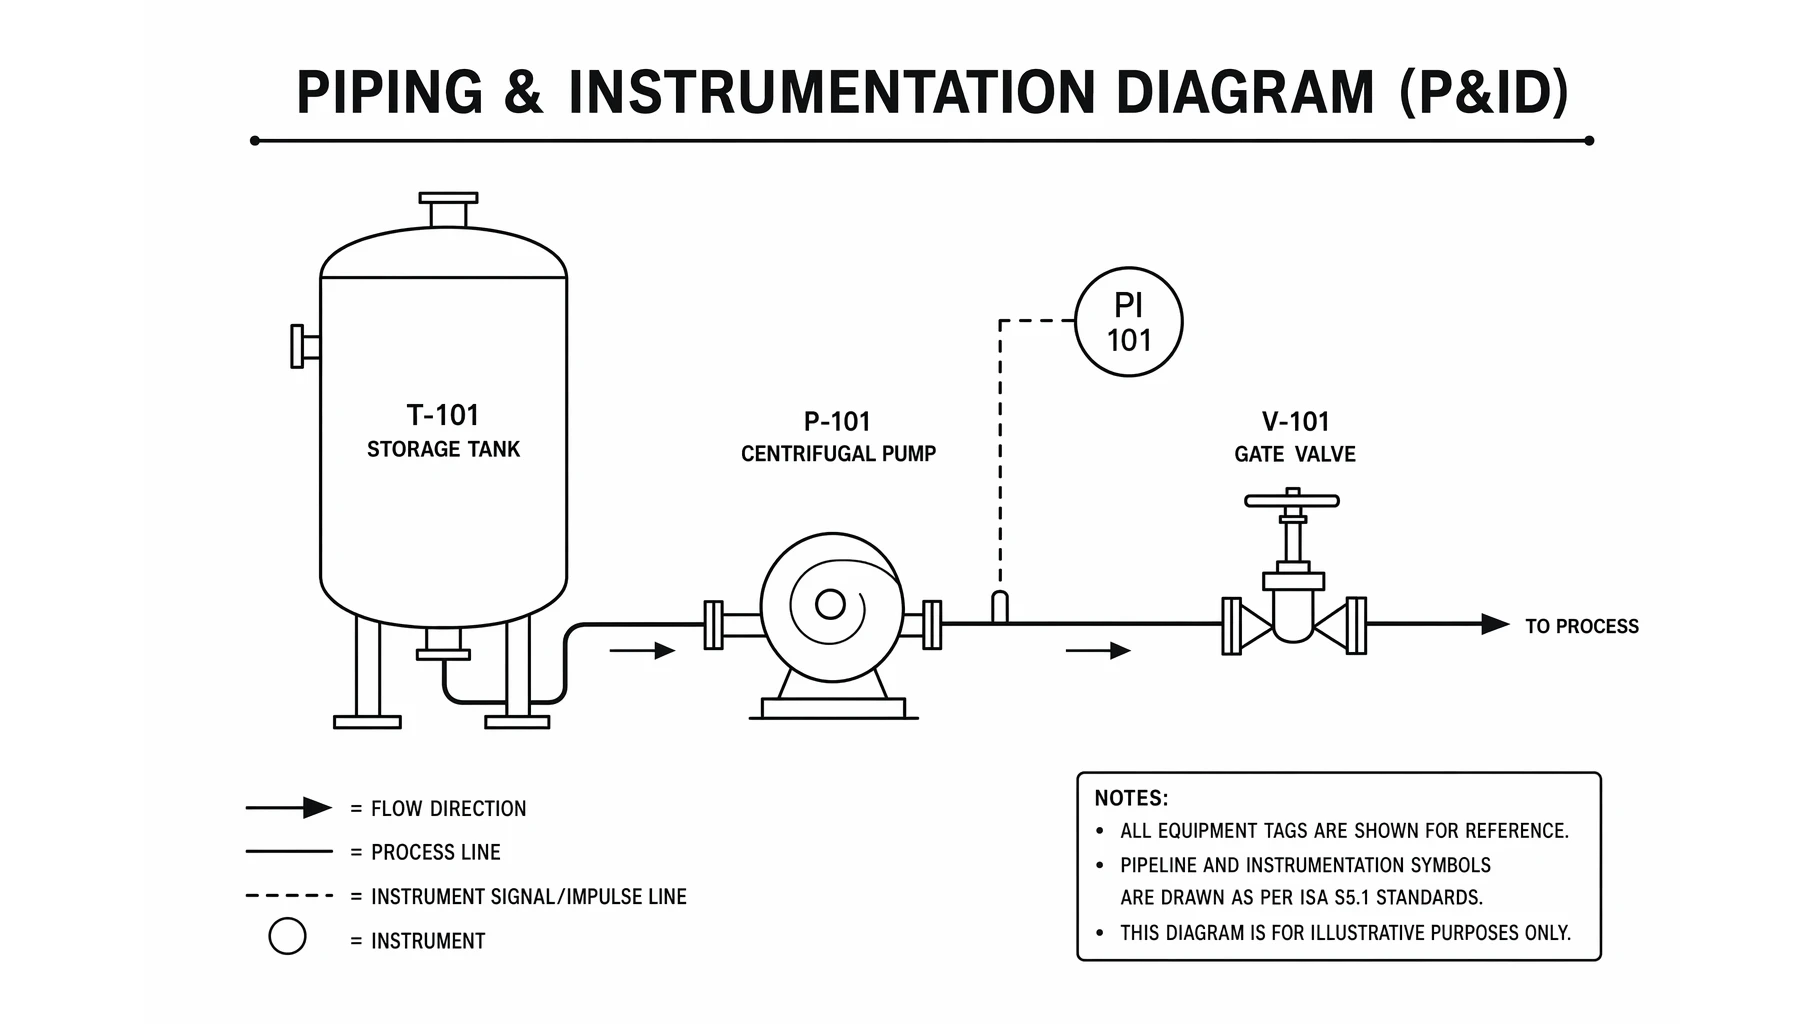
What Is a P&ID? Piping & Instrumentation Diagrams Explained
A P&ID shows every pipe, valve, and instrument in a process. Learn to read piping and instrumentation diagrams, ISA symbols, and how a P&ID differs from a PFD.
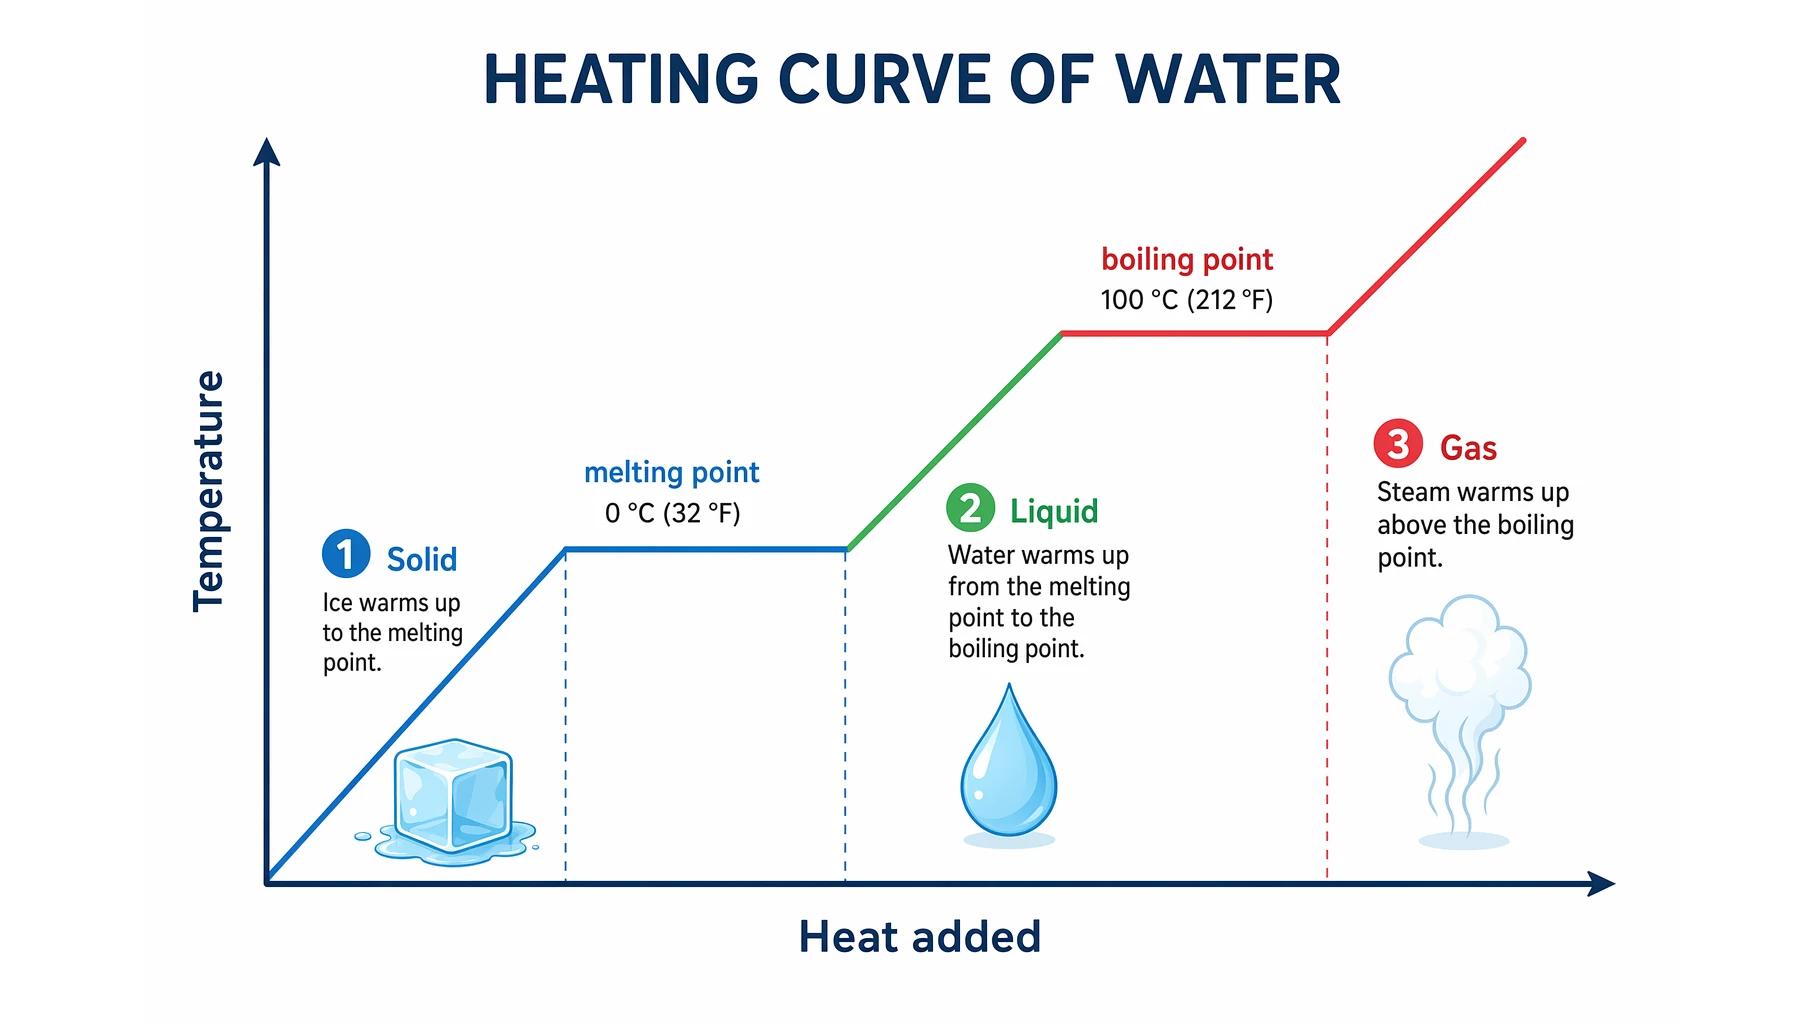
Heating Curve of Water Explained: The 5 Stages
Understand the heating curve of water step by step: what the axes mean, why the plateaus are flat, and how specific and latent heat shape each stage.
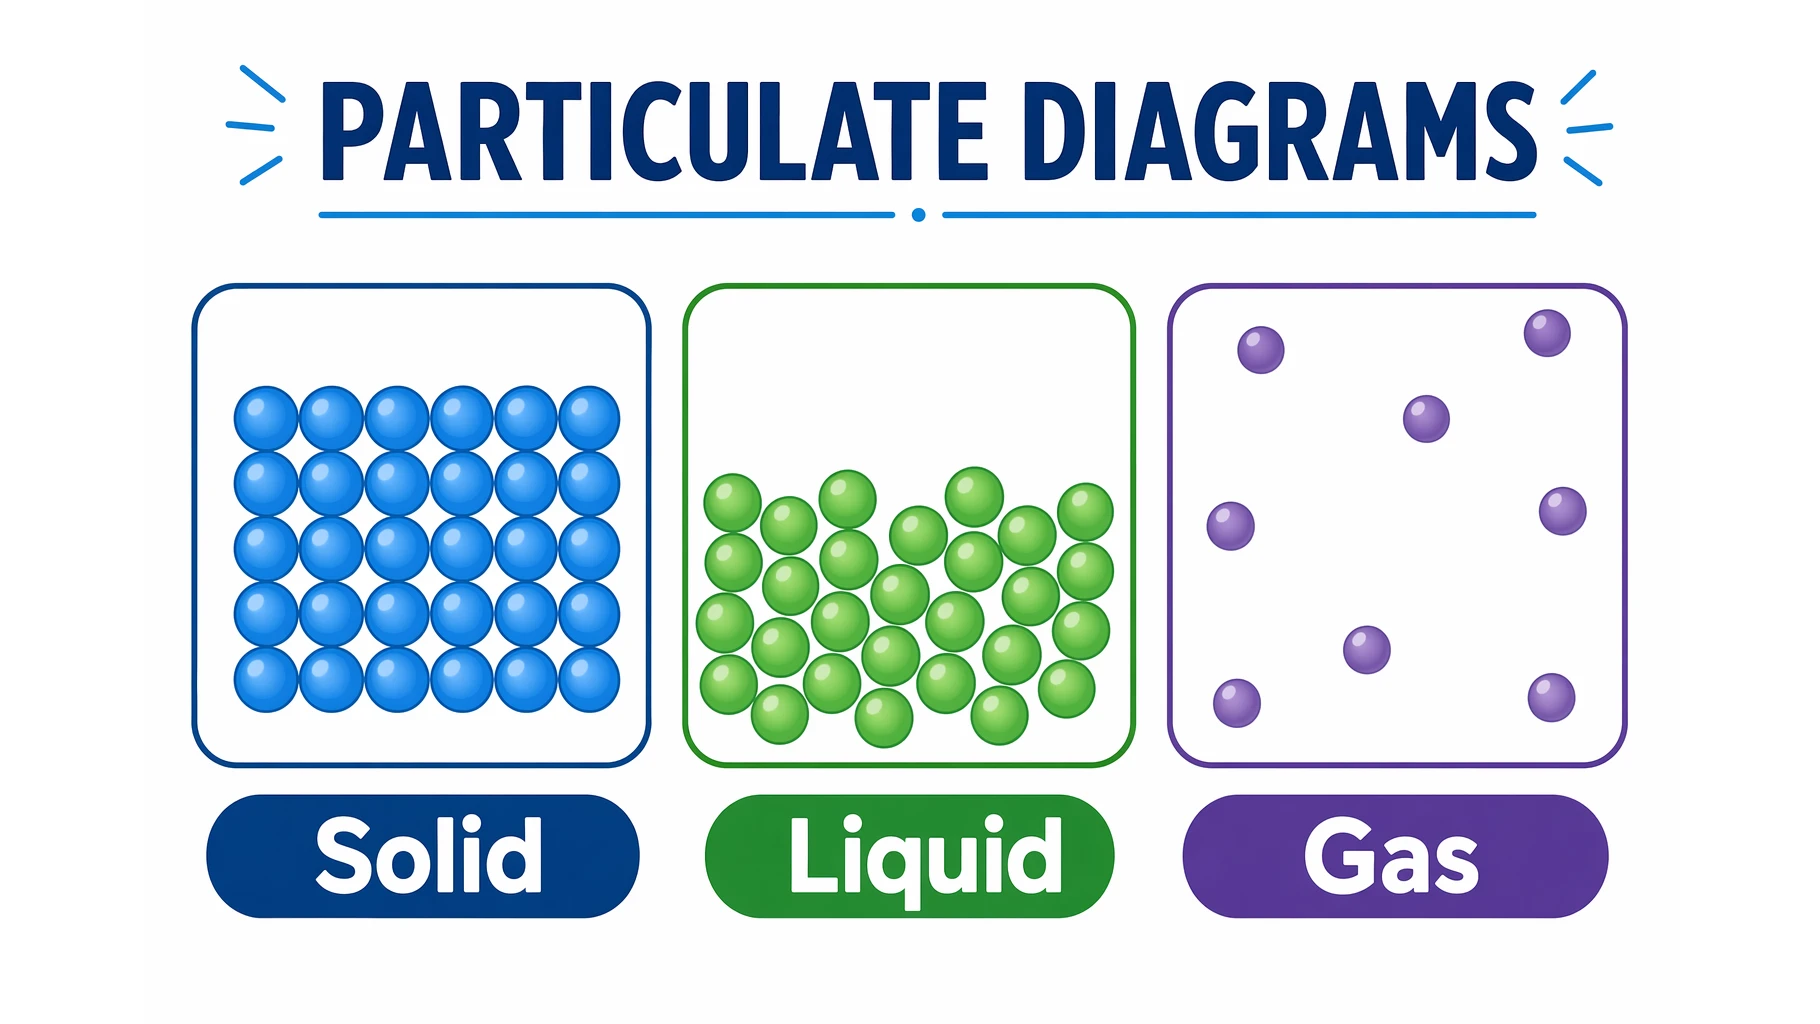
What Is a Particulate Diagram? Particle Models Explained
A particulate diagram shows matter as individual particles. Learn how particle diagrams represent solids, liquids, gases, elements, and mixtures, with examples.
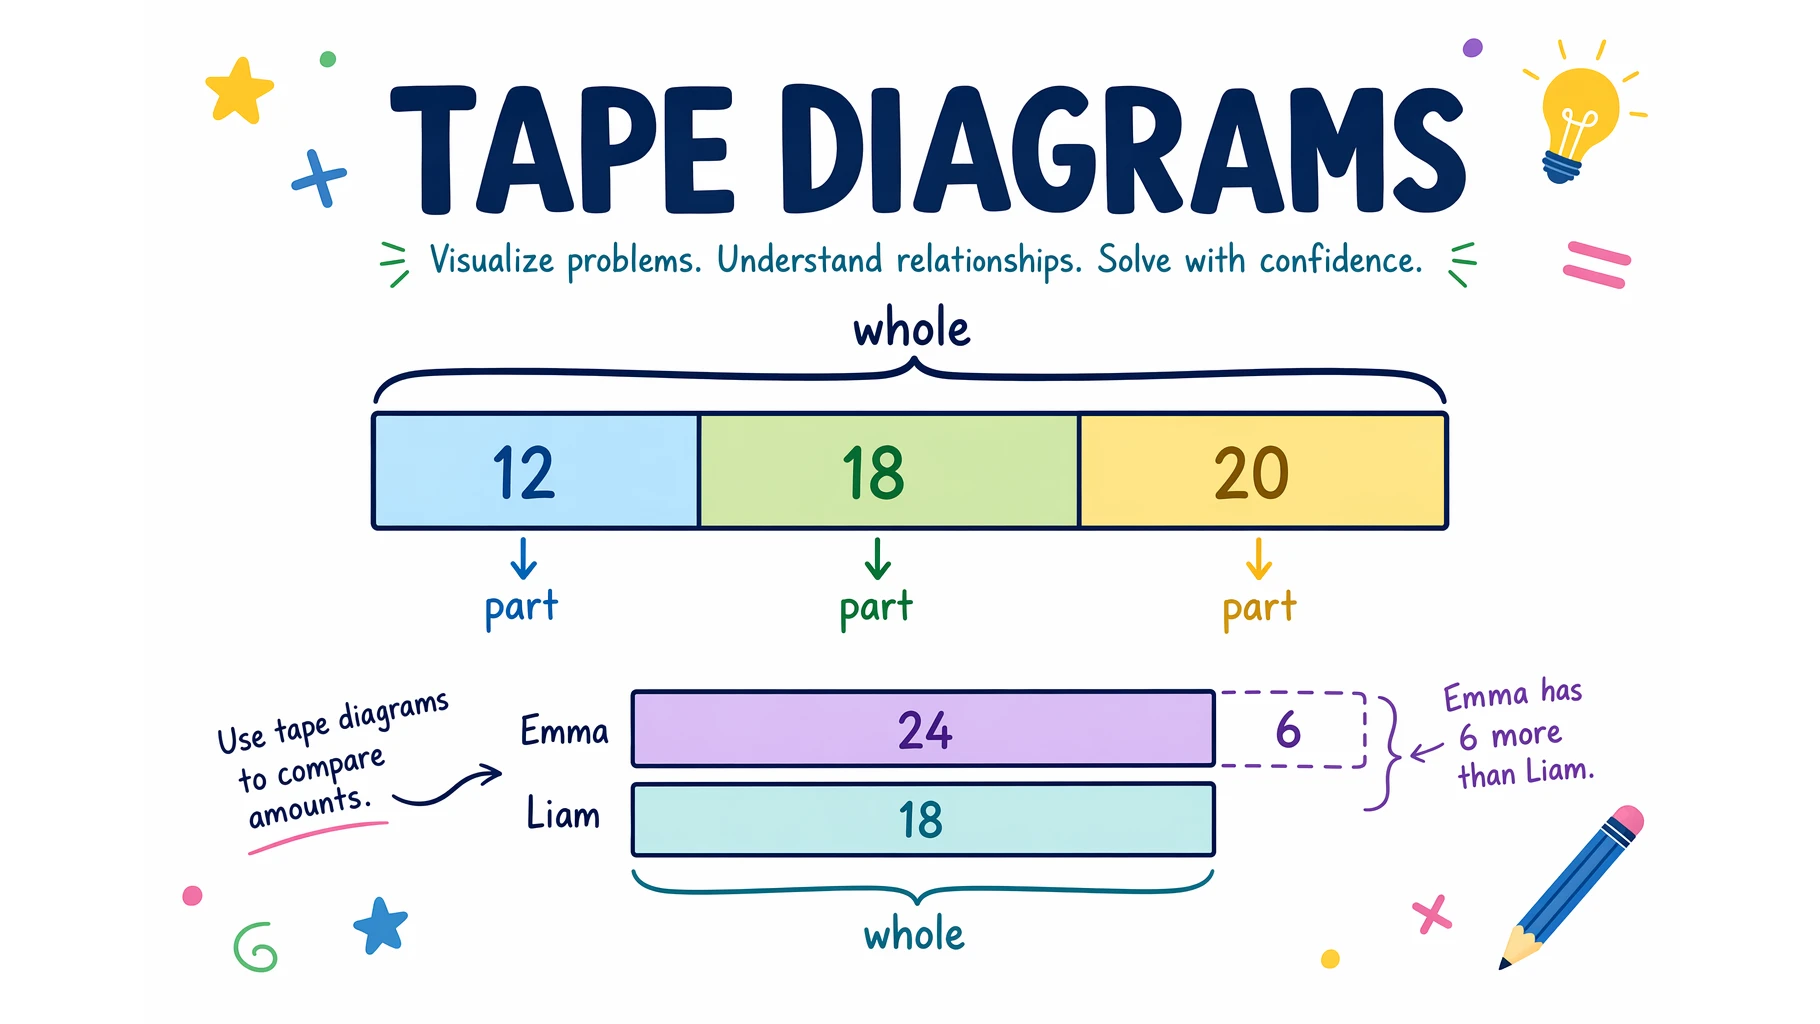
What Is a Tape Diagram? Examples for Every Operation
A tape diagram (bar model) makes word problems visual. See how it works for addition, subtraction, multiplication, division, ratios, and fractions.