
What Is a Tape Diagram? Examples for Every Operation
A tape diagram (bar model) makes word problems visual. See how tape diagrams work for addition, subtraction, multiplication, division, ratios, and fractions, with examples.
A tape diagram turns a word problem into a picture. By drawing a problem as labeled rectangles — "tapes" — students can see how the parts relate to the whole, which makes addition, subtraction, ratios, and fractions far easier to reason about.
This guide explains what a tape diagram is, how it works, and shows a worked example for every operation, from simple addition to ratios and fractions.
Quick Answer: What Is a Tape Diagram?
A tape diagram is a rectangular drawing, shaped like a strip of tape, that is divided into segments to show how quantities relate. The whole tape represents the total, and each segment represents a part. It is also called a bar model, strip diagram, or length model.
Tape diagrams are used from early elementary through middle school to model addition, subtraction, multiplication, division, ratios, and fractions — and especially to make sense of word problems.
How Tape Diagrams Work
Every tape diagram follows the same simple idea:
- The whole tape stands for the total amount.
- Each segment stands for a part of that total.
- Segment lengths are proportional to the values, so a bigger number is a longer bar.
- A label or brace shows what is known and what you are solving for.
Because the relationship between the parts and the whole is drawn to scale, the operation you need — add, subtract, multiply, or divide — becomes visible instead of hidden inside the words.
Tape Diagram Examples by Operation
Addition and subtraction (part-part-whole)
The most common tape diagram is the part-part-whole model: two parts join to make a whole. If you know the two parts, you add to find the whole; if you know the whole and one part, you subtract to find the other.

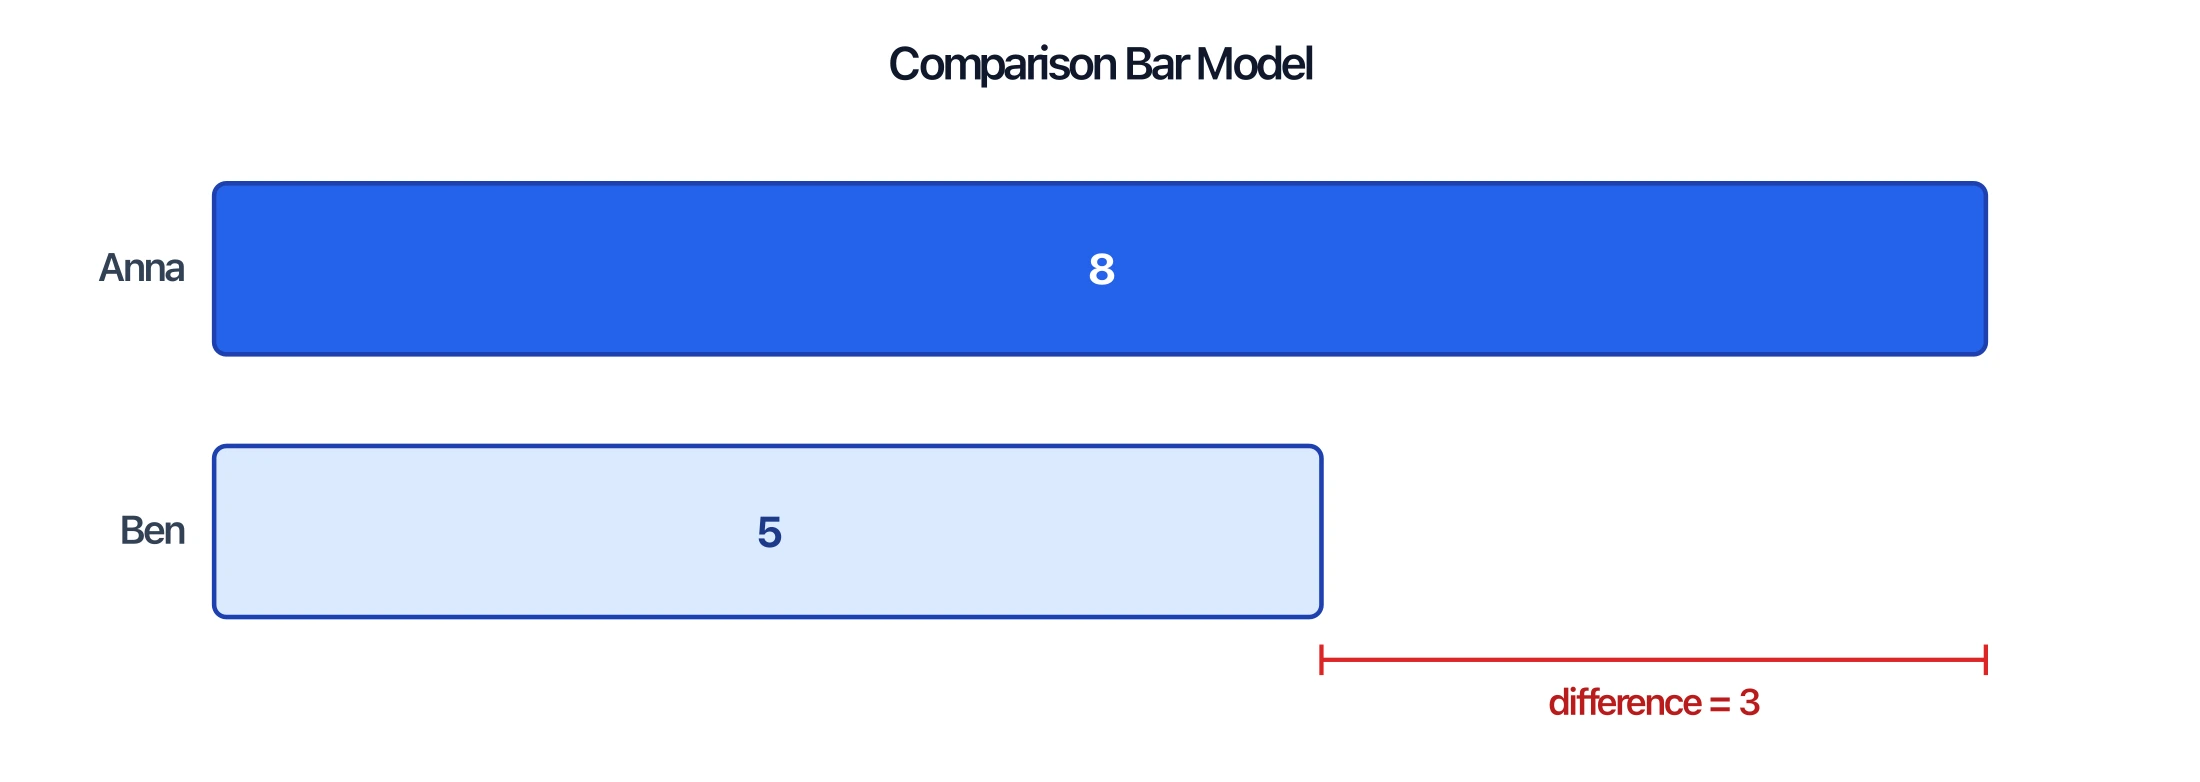
Comparison (how many more)
A comparison bar model stacks two bars so you can see the difference between them. This is perfect for "how many more / how many fewer" problems — the extra length of the longer bar is the answer.
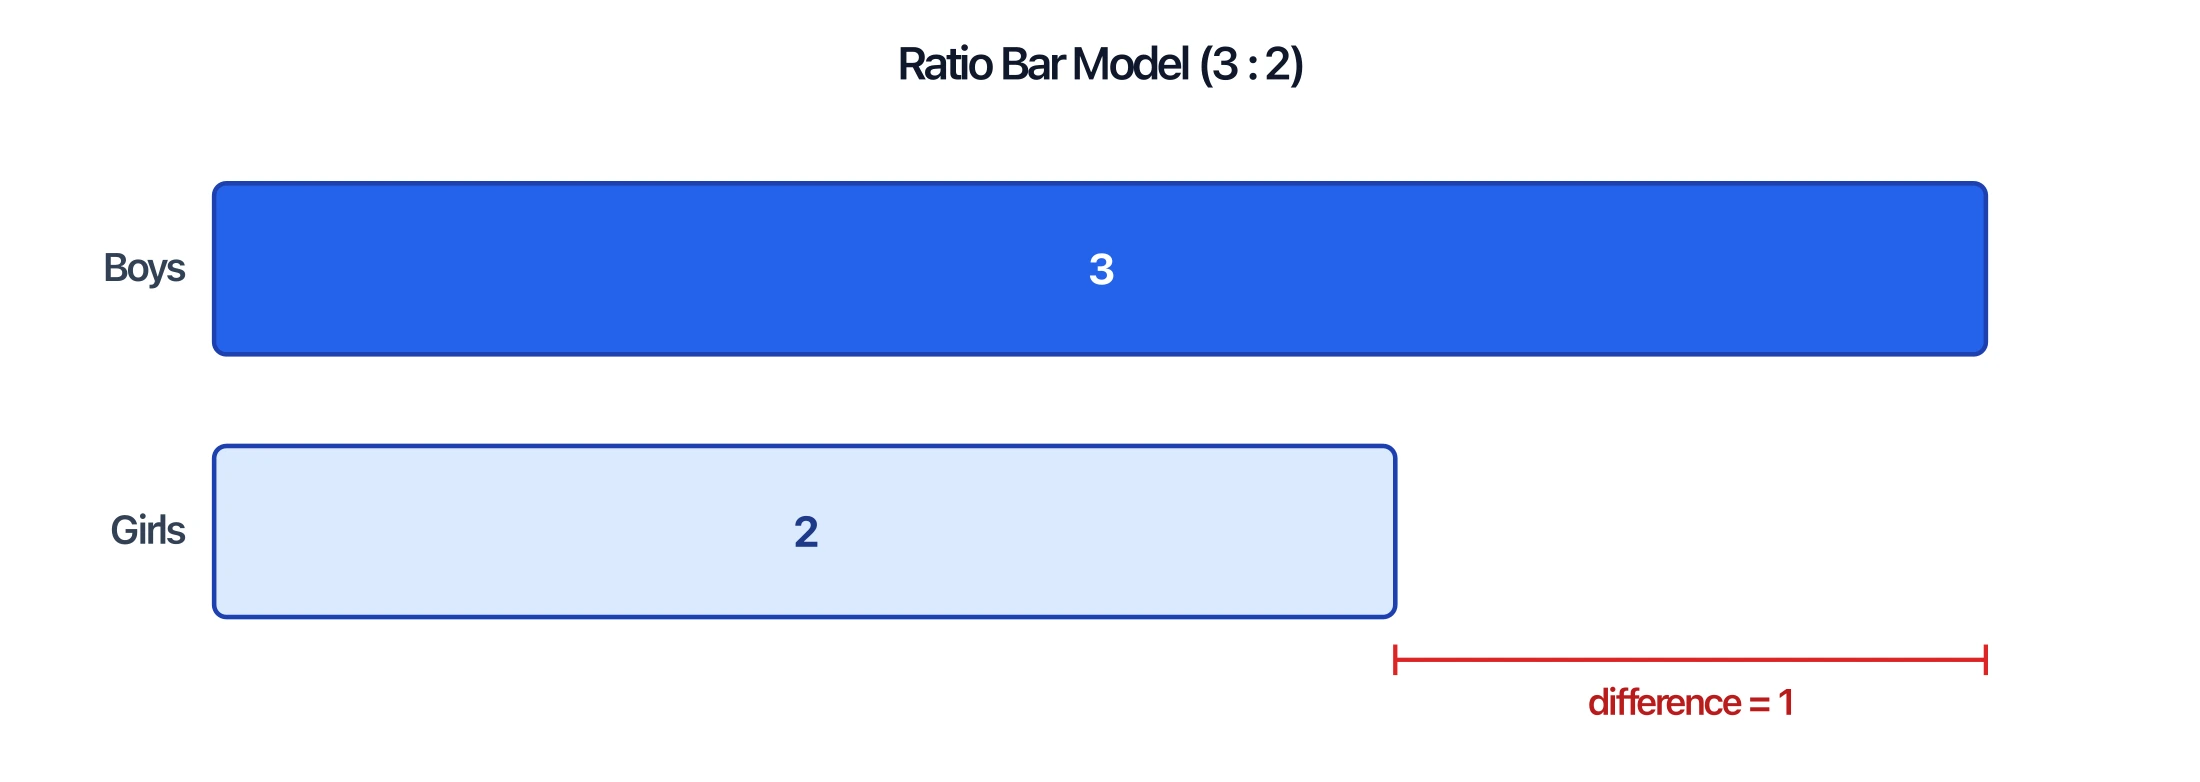
Ratios
For ratio problems, each unit of the ratio becomes one equal segment. A 3 : 2 ratio is drawn as 3 segments against 2 segments, so the total is 5 equal parts — making it easy to find the value of one part and scale up.
Fractions
A tape diagram is also a clean way to show a fraction of a whole: divide the bar into equal segments and shade the numerator. It makes equivalent fractions and "fraction of a quantity" problems concrete.

Tape Diagram Generator
Create part-part-whole, comparison, ratio, and fraction tape diagrams (bar models) and download them free as SVG or PNG.
Make a tape diagram ->How to Draw a Tape Diagram Step by Step
- Read the problem and find the quantities. Identify the parts, the whole, and what is unknown.
- Draw one bar for each quantity. Use one bar for part-part-whole; use stacked bars to compare.
- Divide the bar into segments that match the numbers or ratio units, keeping the lengths proportional.
- Label what you know and mark the unknown with a question mark or a brace.
- Decide the operation from the picture — combine for a total, find the gap for a difference, split equally for division.
- Solve and check that your answer fits the lengths in the diagram.
Tape Diagram vs Bar Model vs Number Line
"Tape diagram" and "bar model" are the same tool with different names — bar model is common in Singapore Math, while tape diagram is the term used in Eureka Math and the Common Core. A number line is related but different: it shows position and distance along a single line, while a tape diagram shows part-to-whole relationships as areas of a bar.
Why Teachers Use Tape Diagrams
Tape diagrams build the bridge between concrete counting and abstract equations. They:
- Make the structure of a word problem visible.
- Work across grades and operations, so students reuse one familiar model.
- Support algebraic thinking — a labeled bar with an unknown is a visual equation.
- Are central to curricula like Eureka Math and the Common Core.
Common Mistakes
- Segments not proportional. If 8 and 4 are drawn the same length, the diagram no longer shows the relationship.
- Mixing up the whole and the parts. Be clear about which bar (or brace) is the total.
- Forgetting to label the unknown. Mark what you are solving for so the operation is obvious.
- Using a tape diagram when a number line fits better. Tape diagrams show part-whole; number lines show distance and order.
FAQ
What is a tape diagram in math?
A tape diagram is a rectangular drawing divided into segments that shows how parts relate to a whole. The whole bar is the total and each segment is a part. It is used to model and solve word problems.
Is a tape diagram the same as a bar model?
Yes. "Tape diagram," "bar model," and "strip diagram" all refer to the same tool. Bar model is common in Singapore Math; tape diagram is the term used in Eureka Math and the Common Core.
What grades use tape diagrams?
Tape diagrams are used from early elementary (addition and subtraction) through middle school (ratios, fractions, and equations), because the same model scales up to harder problems.
How do tape diagrams help with word problems?
They make the structure of the problem visible. By drawing the parts and the whole to scale, students can see whether to add, subtract, multiply, or divide instead of guessing from the wording.
Can tape diagrams be used for ratios and fractions?
Yes. For ratios, each unit becomes one equal segment (a 3:2 ratio is 5 equal parts). For fractions, the bar is divided into equal segments and the numerator is shaded.
Further Reading
カテゴリー
もっと読む

Floral Diagram Guide: Floral Formula Symbols, Examples, and How to Draw One
Learn how to read floral diagrams, understand floral formula symbols, draw whorls from a formula, and use examples like Brassicaceae.

How to Create Science Drawings: Easy Step-by-Step Guide for Students
Learn how to create clear, labeled science drawings for biology, chemistry, and physics class. Step-by-step guide with tips, examples, and free AI tools for students.

7 Best Free Lucidchart Alternatives 2026: No 3-Doc Limit
Lucidchart limits free accounts to 3 documents. These 7 alternatives offer unlimited diagrams free: draw.io, Canva, Miro, Excalidraw & ConceptViz.