")
How to Create a Tree Diagram: 5 Types, Examples & Free AI Generator (2026)
Learn how to create tree diagrams for probability, decisions, org charts, and more. Step-by-step guide with real examples — plus a free AI tree diagram maker.
Tree diagrams are one of the most versatile and widely used visualization tools across mathematics, science, business, and computer science. At their core, they represent hierarchical relationships -- branching structures where a single starting point (the root) splits into progressively more specific categories, outcomes, or decisions. You have almost certainly encountered tree diagrams before: probability trees in statistics class, decision trees in business strategy meetings, organizational charts showing company hierarchy, phylogenetic trees mapping evolutionary relationships, or file system trees on your computer. Their power lies in making complex branching logic visually intuitive, allowing you to trace every possible path from beginning to end in a single glance.
Tree Diagram Generator
Create professional tree diagrams instantly with AI. Describe your hierarchy or decision — get a publication-ready diagram in seconds.
Try it free →What Is a Tree Diagram?
A tree diagram is a graphical representation of hierarchical or sequential relationships that uses a branching structure to display all possible outcomes, categories, or decision paths from a single starting point. The diagram fans outward (typically top-to-bottom or left-to-right) from a central root, with each branch representing a choice, category, or event that leads to further sub-branches.
Tree diagrams are used whenever data or logic has an inherently nested, parent-child structure -- situations where one element gives rise to multiple sub-elements, which in turn may branch further.
Key Terminology
Understanding tree diagram vocabulary is essential before creating one:
- Root node -- the topmost (or leftmost) node where the tree begins. Every tree has exactly one root. In a probability tree, this is the starting event; in an org chart, this is the CEO or top-level entity.
- Parent node -- any node that has one or more child nodes beneath it. A parent represents a category, event, or decision that branches into sub-items.
- Child node -- a node that descends from a parent. Each child inherits context from its parent and adds its own specificity.
- Leaf node (terminal node) -- a node with no children. Leaves represent final outcomes, lowest-level categories, or endpoints of a path.
- Branch -- the connection (line or edge) between a parent and a child. Branches may be labeled with probabilities, decisions, or category names.
- Level (depth) -- the distance from the root. The root is at level 0, its children at level 1, their children at level 2, and so on. The depth of the tree is the number of levels from root to the deepest leaf.
- Subtree -- any node and all of its descendants. Every non-leaf node is the root of its own subtree.
Key Properties
- Acyclic -- a tree never loops back on itself. Following any path from the root, you will never revisit the same node.
- Connected -- every node can be reached from the root by following branches.
- Single parent -- every node (except the root) has exactly one parent. This is what distinguishes a tree from a more general graph or network.
- Branching factor -- the number of children per node. Binary trees have at most two children per node, but tree diagrams in practice often have three, four, or more branches.
5 Types of Tree Diagrams
Tree diagrams take many forms depending on the domain and purpose. Here are the five most common types, each with distinct conventions and use cases.
1. Probability Tree Diagram
A probability tree diagram maps out all possible outcomes of a sequence of random events, with probabilities assigned to each branch. By multiplying probabilities along a path and adding across paths, you can calculate the likelihood of any compound event.
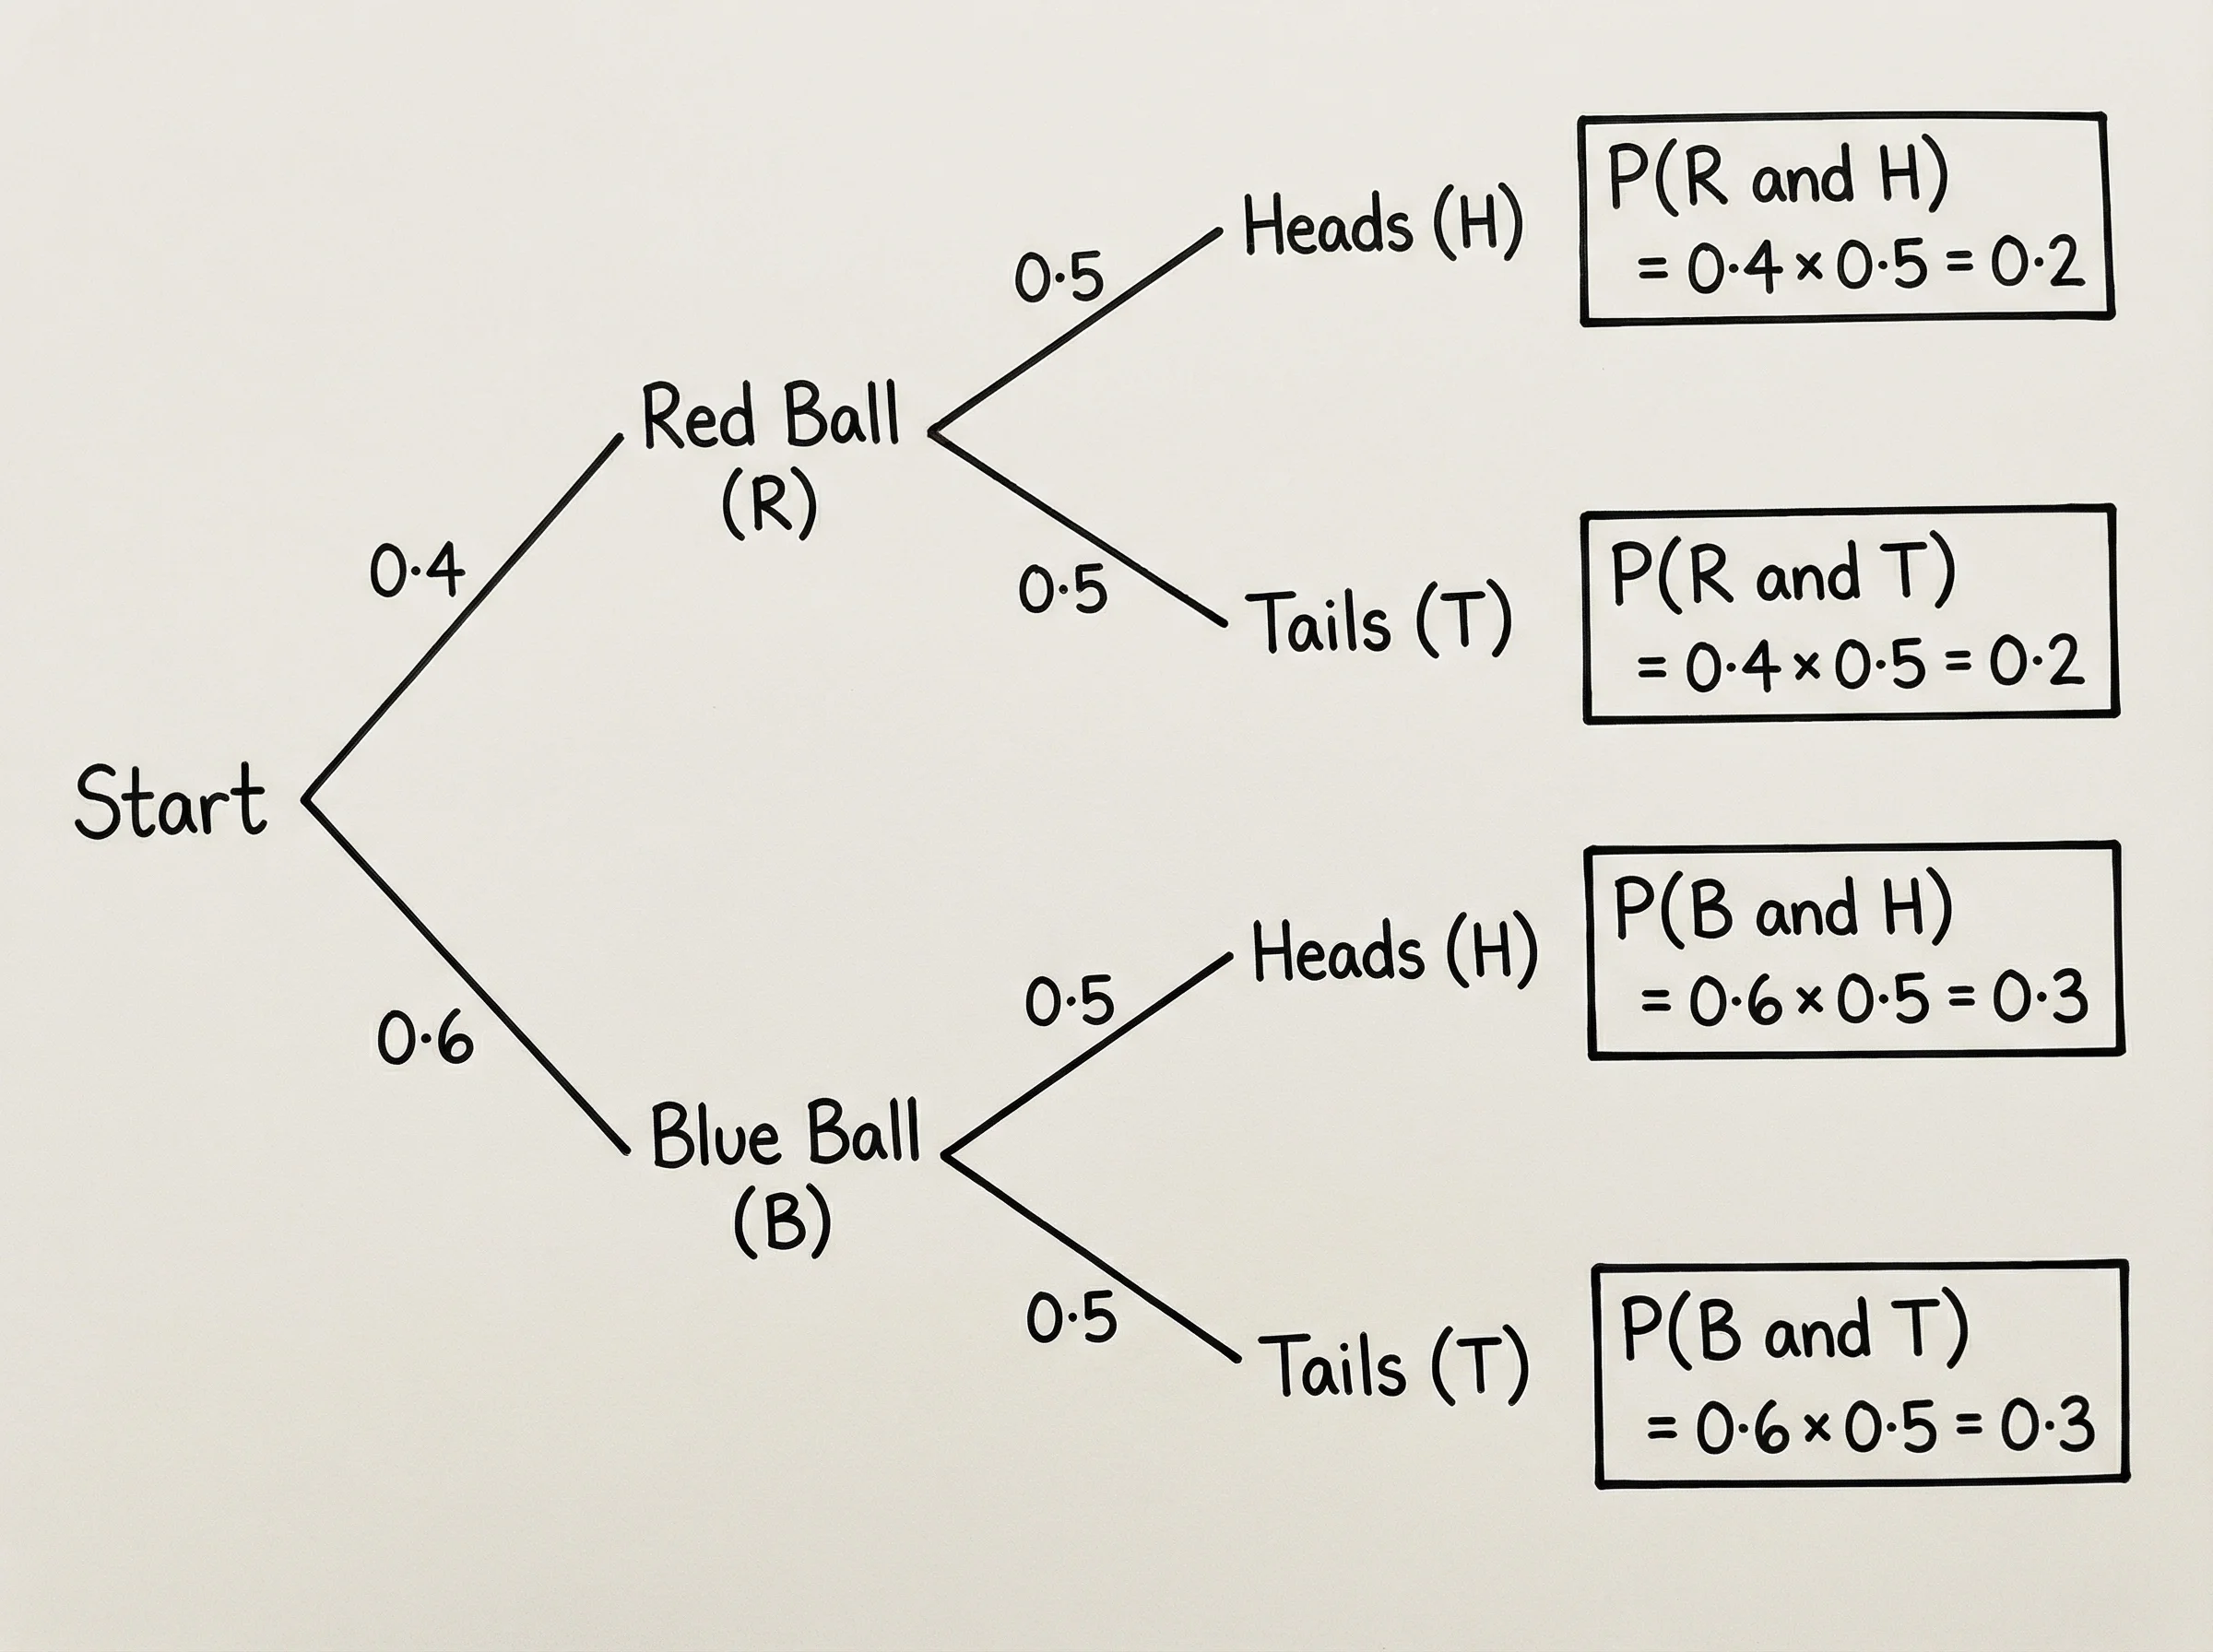 A probability tree diagram illustrating how probabilities multiply along branches and add across paths to determine compound event likelihoods.
When to use it:
- Calculating compound probabilities in statistics and probability courses
- Modeling sequential events (coin flips, dice rolls, drawing cards without replacement)
- Bayesian analysis and conditional probability problems
- Risk assessment in engineering and insurance
How it works: Each level of the tree represents one event in a sequence. The branches from each node show all possible outcomes of that event, labeled with their probabilities. The probabilities from each node must sum to 1. To find the probability of a specific sequence of outcomes, you multiply the probabilities along that path. To find the probability of an event that can occur via multiple paths, you add the probabilities of all qualifying paths.
2. Decision Tree Diagram
A decision tree maps out choices and their consequences in a structured, visual format. Each internal node represents a decision point, each branch represents a possible choice or outcome, and each leaf represents a final result -- often with an associated value, payoff, or classification.
A decision tree for selecting research methodology, branching from the research question into qualitative, quantitative, and mixed-methods approaches.
When to use it:
- Strategic business decision-making (investment decisions, product launches)
- Machine learning classification and regression
- Medical diagnosis and treatment planning
- Research methodology selection
- Game theory and competitive analysis
How it works: Decision trees alternate between two types of nodes: decision nodes (squares) where the decision-maker chooses a path, and chance nodes (circles) where outcomes occur probabilistically. Terminal nodes show the final payoff or classification. In machine learning, decision trees are trained on data and use features like information gain or Gini impurity to determine the optimal splitting criteria at each node.
3. Organizational / Hierarchy Tree
An organizational tree (often called an org chart) represents the hierarchical structure of an organization, institution, or system. Each node represents a person, department, or entity, and the branches show reporting relationships or structural containment.
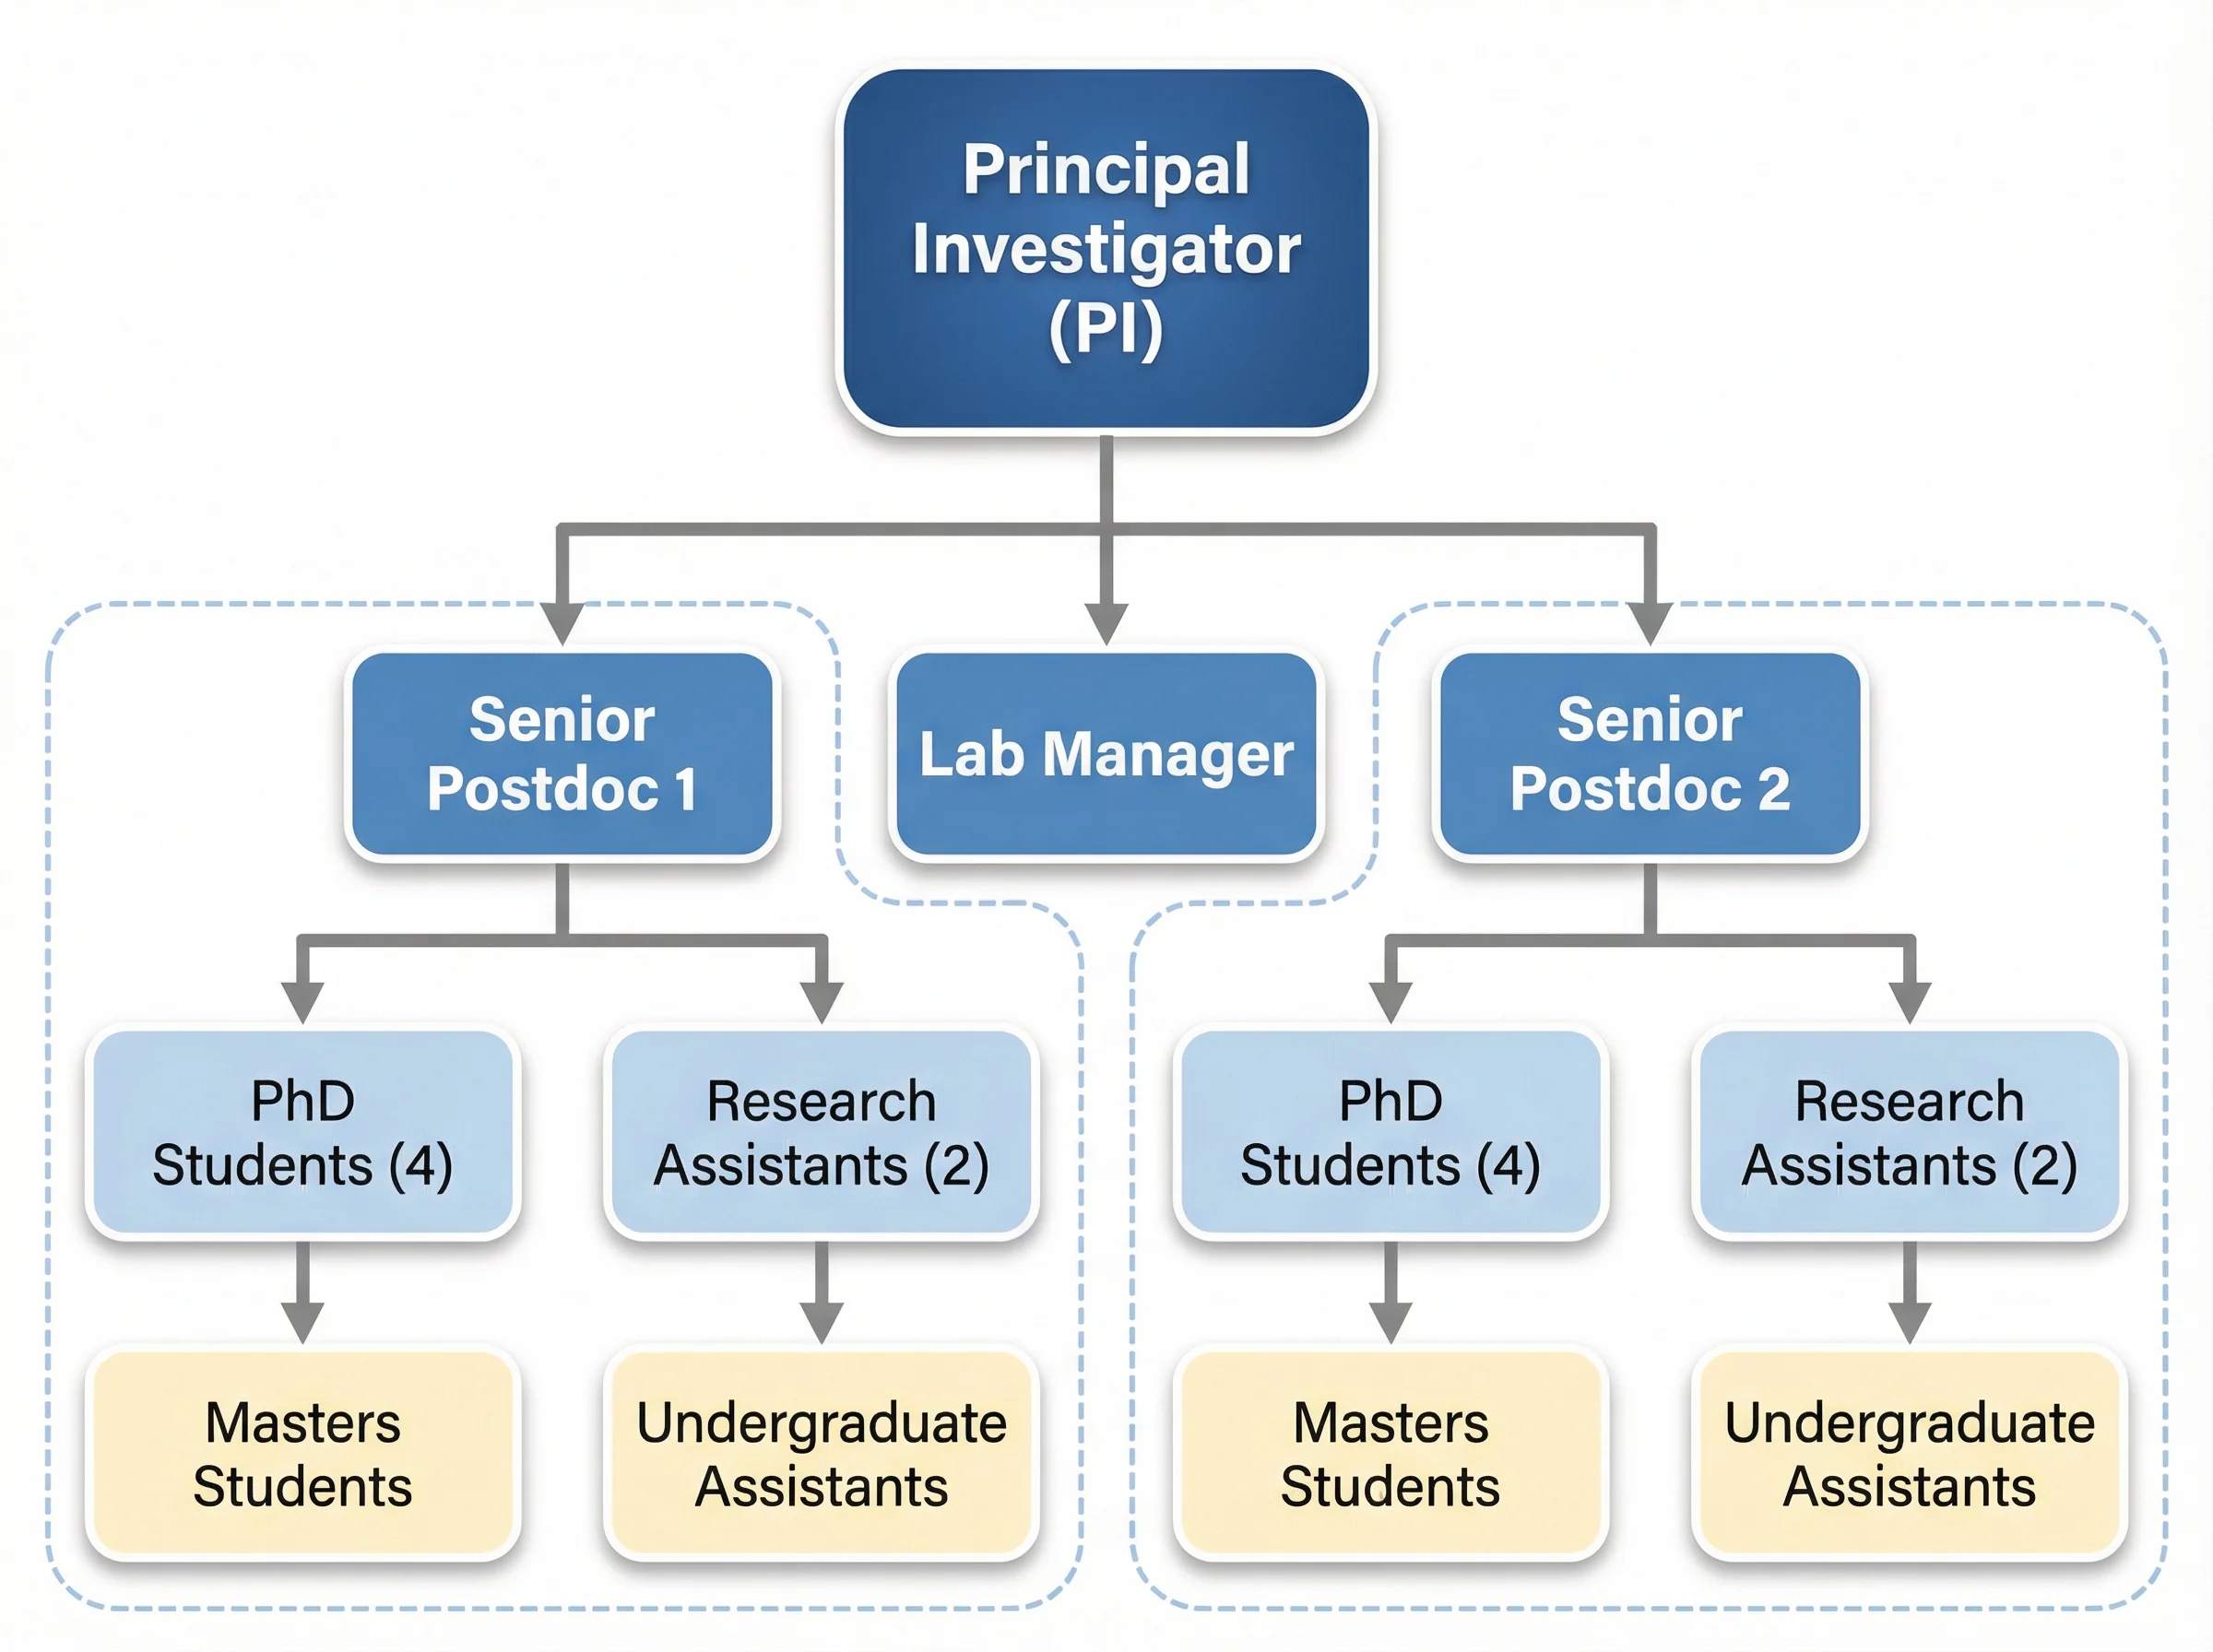 An organizational hierarchy tree for a research laboratory, showing the chain of command from lab director through principal investigators to graduate students and technicians.
When to use it:
- Displaying company or department structures
- Mapping research lab or university hierarchies
- Government agency organizational charts
- Project team structures and work breakdown structures (WBS)
- File system or database schema visualization
How it works: The root represents the highest-level entity (CEO, director, root folder). Each branch descends to a subordinate entity. The depth of the tree reflects the number of management layers or structural levels. Organizational trees typically have variable branching factors -- a CEO might oversee five VPs, while a team lead manages three engineers.
4. Classification / Taxonomy Tree
A classification tree (also called a taxonomy tree) organizes items into hierarchical categories based on shared characteristics. This is the classic Linnaean system used in biology, but the same structure applies to product categorization, document classification, and knowledge management.
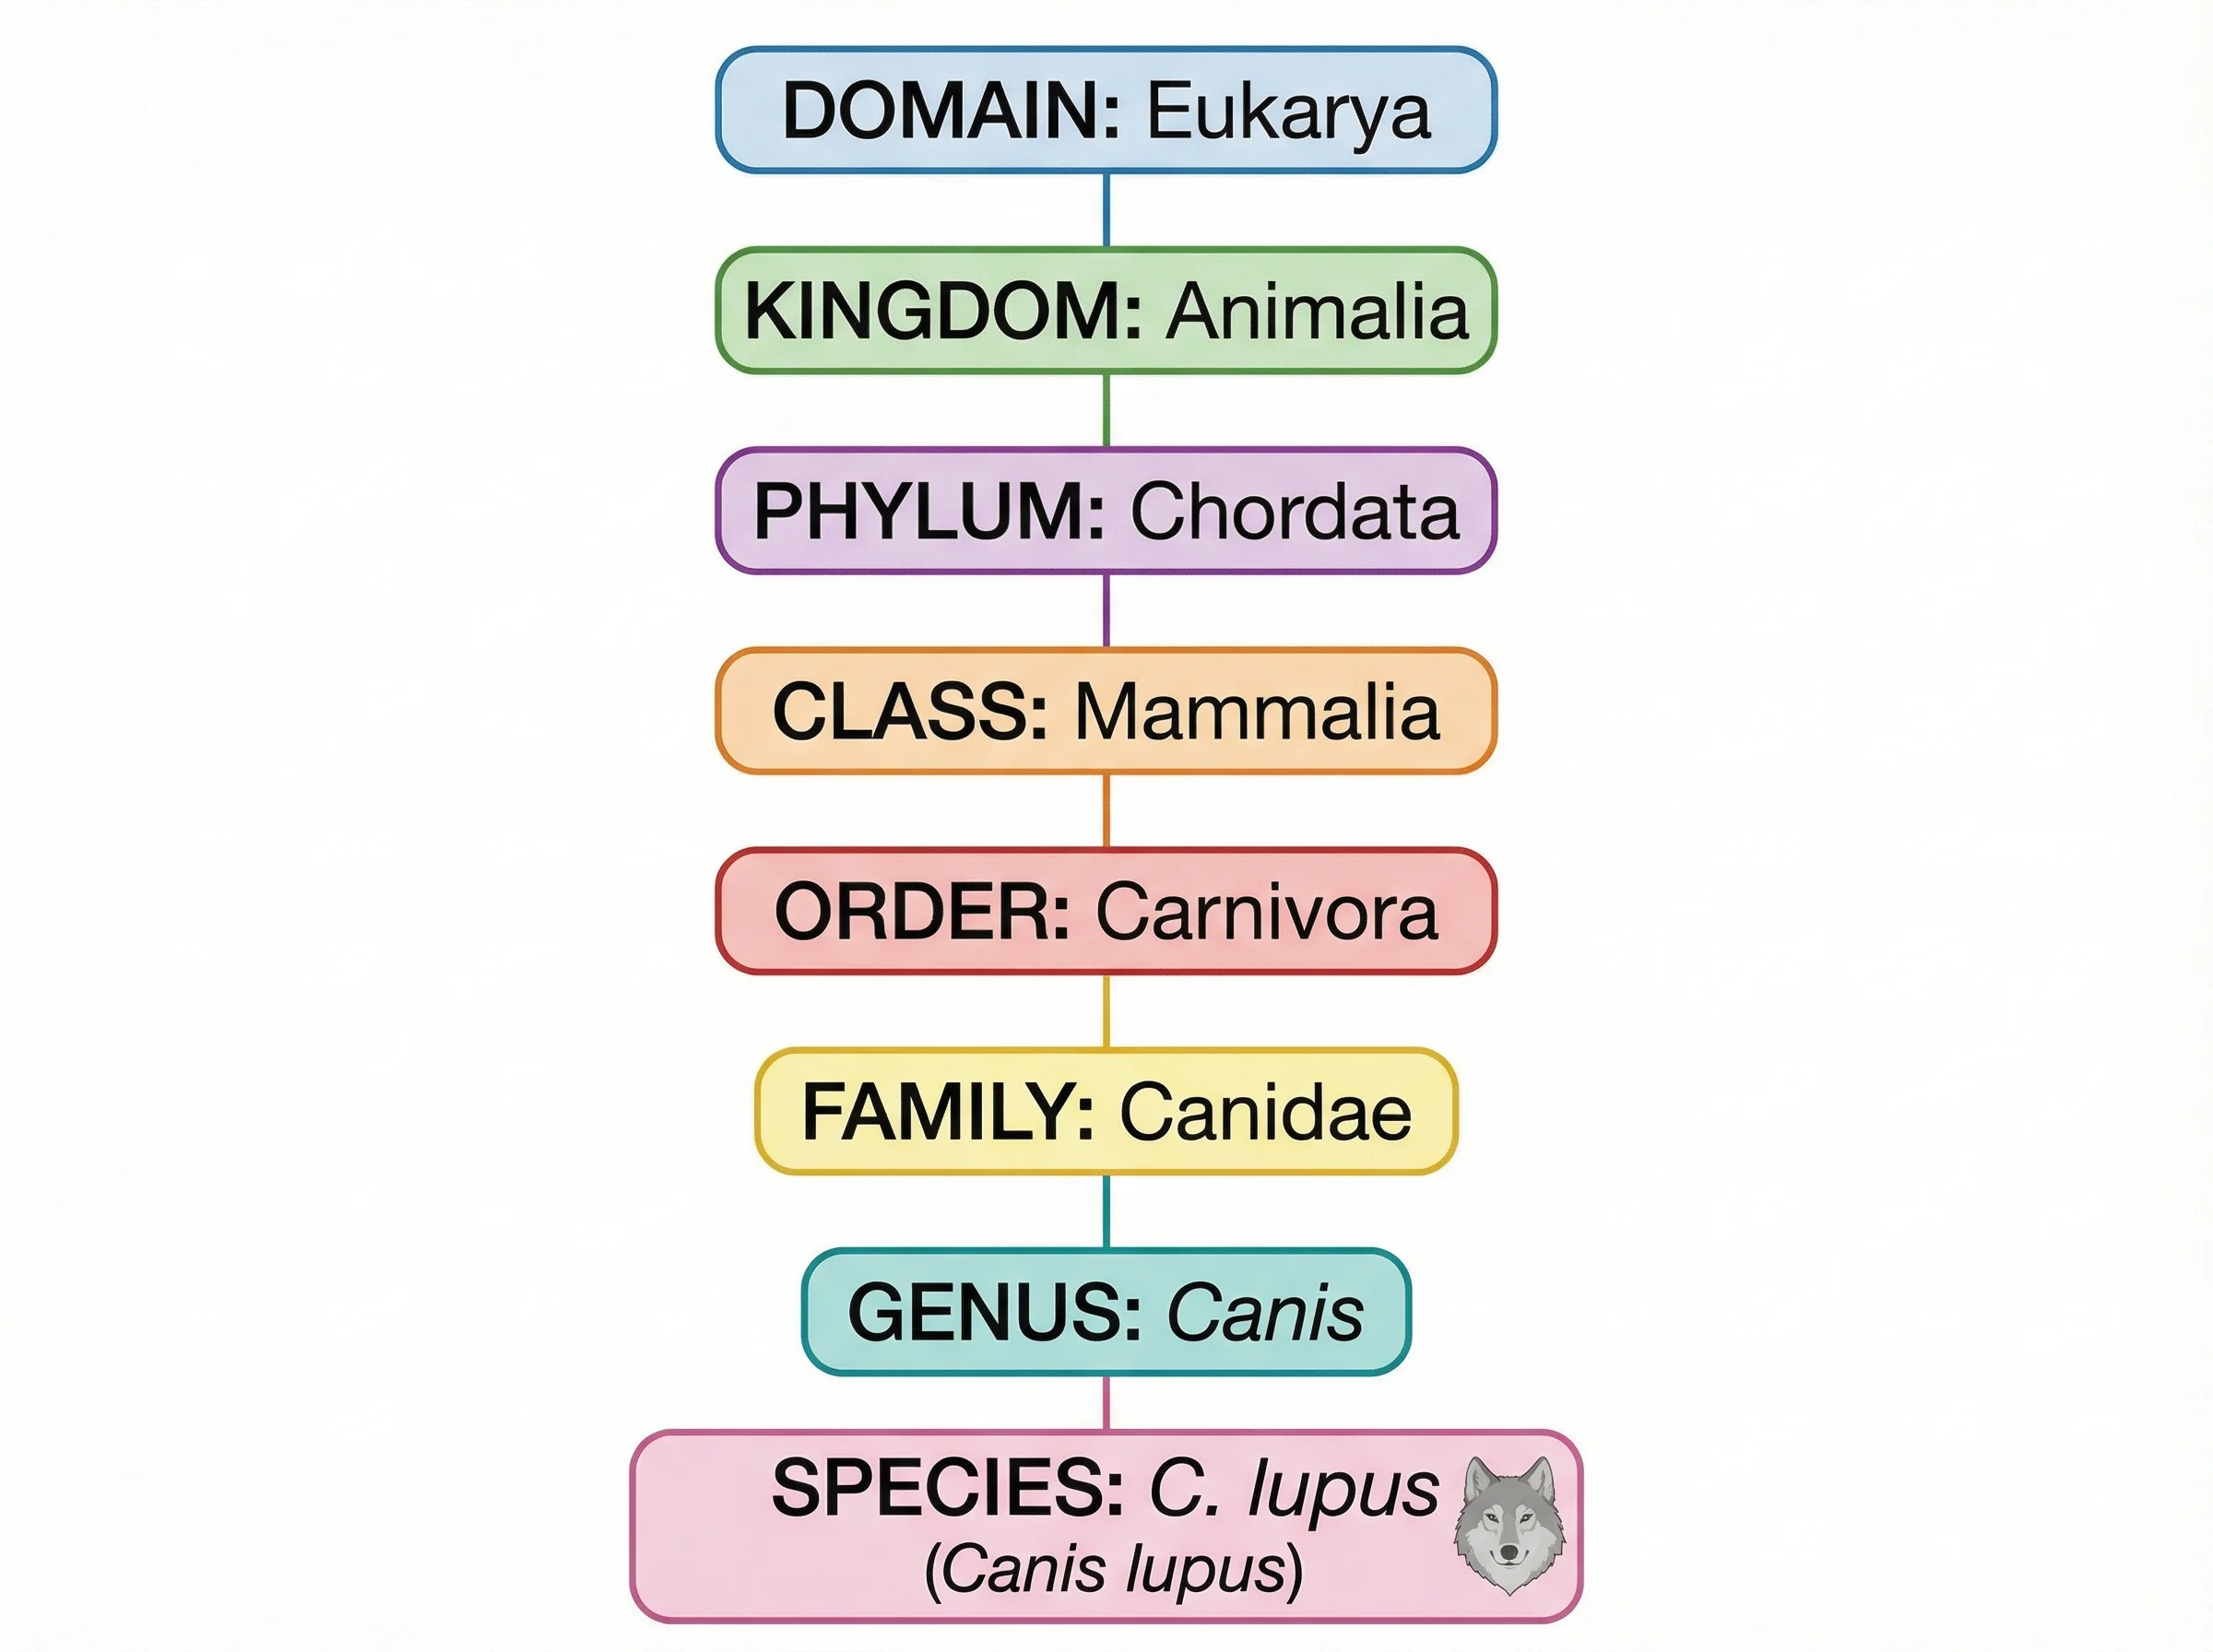 A taxonomy classification tree showing the hierarchical categorization of organisms from domain down to species level.
When to use it:
- Biological taxonomy (Kingdom, Phylum, Class, Order, Family, Genus, Species)
- Product or content categorization systems
- Library classification (Dewey Decimal, Library of Congress)
- Information architecture and website navigation design
- Machine learning feature hierarchies
How it works: Each level of the tree represents a rank or category level. Items at the same level share a common degree of specificity. The tree narrows as you go deeper -- broad categories at the top split into increasingly specific subcategories. Unlike decision trees, classification trees are typically static structures that describe existing knowledge rather than model future choices.
 An organism classification tree demonstrating how individual species are organized into the broader taxonomic hierarchy.
5. Phylogenetic Tree
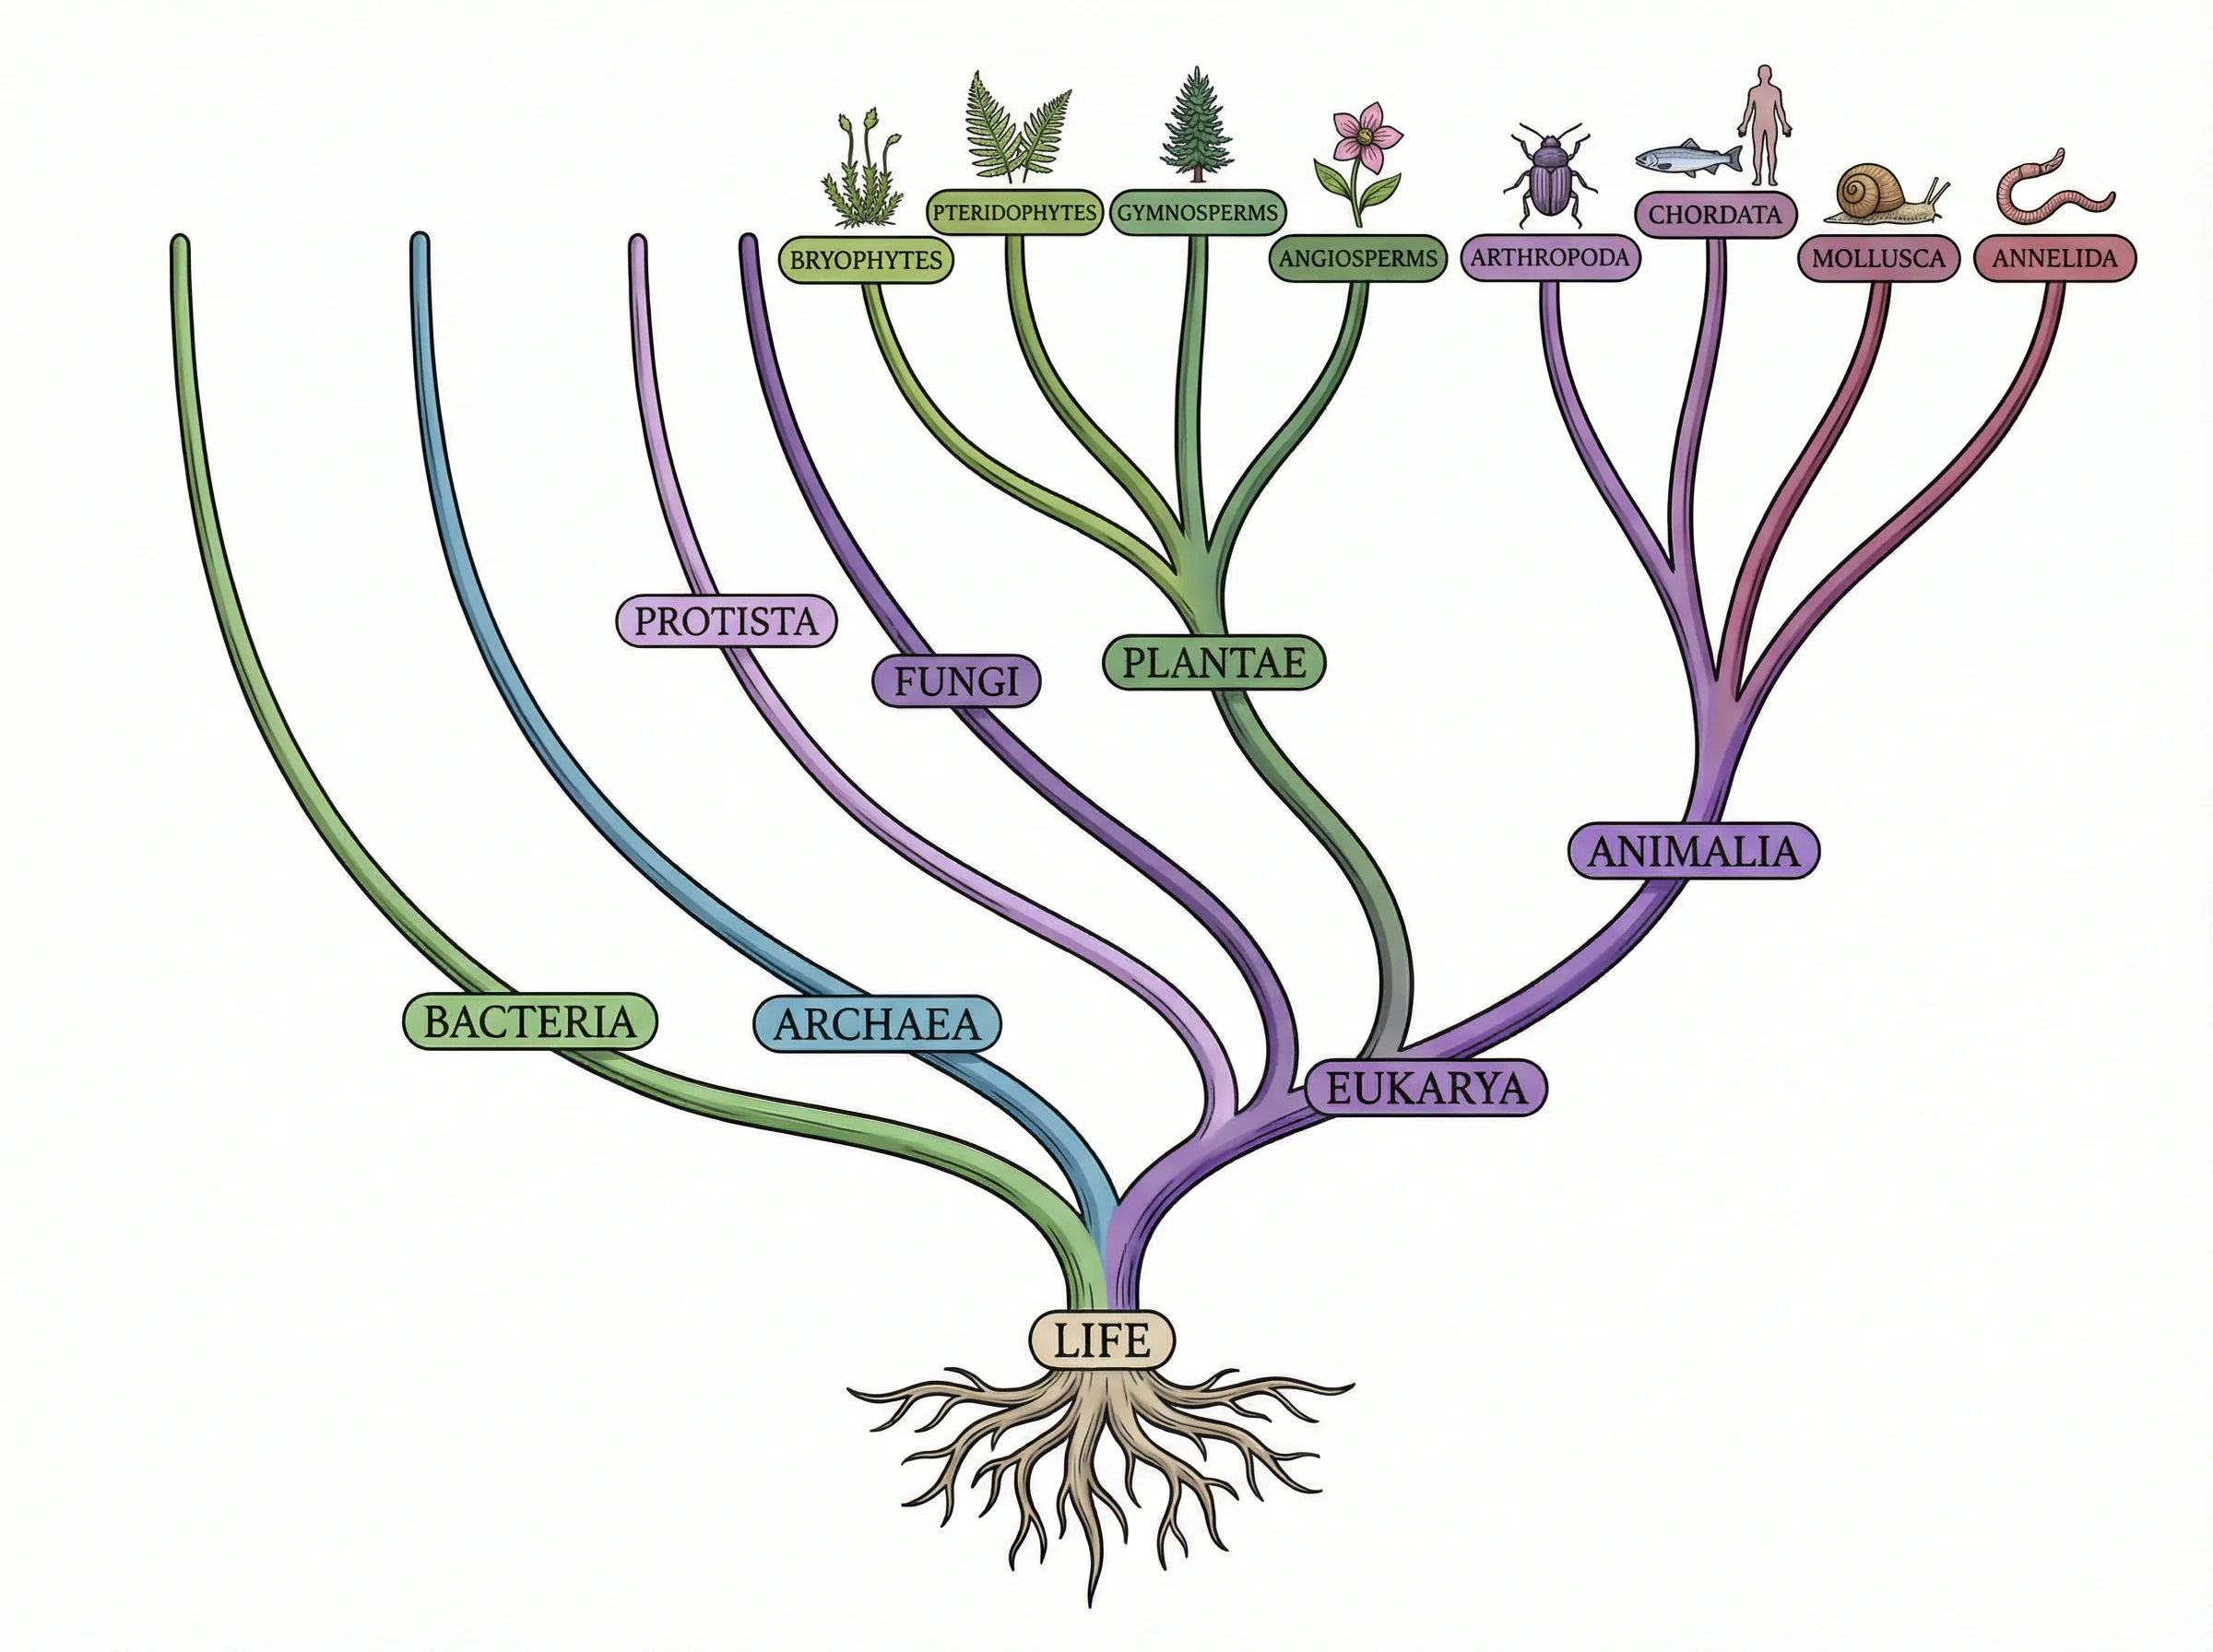
A phylogenetic tree (evolutionary tree or cladogram) represents the evolutionary relationships among species, genes, or other biological entities. Branch points (nodes) represent common ancestors, and the branch lengths may indicate the amount of evolutionary change or time elapsed.
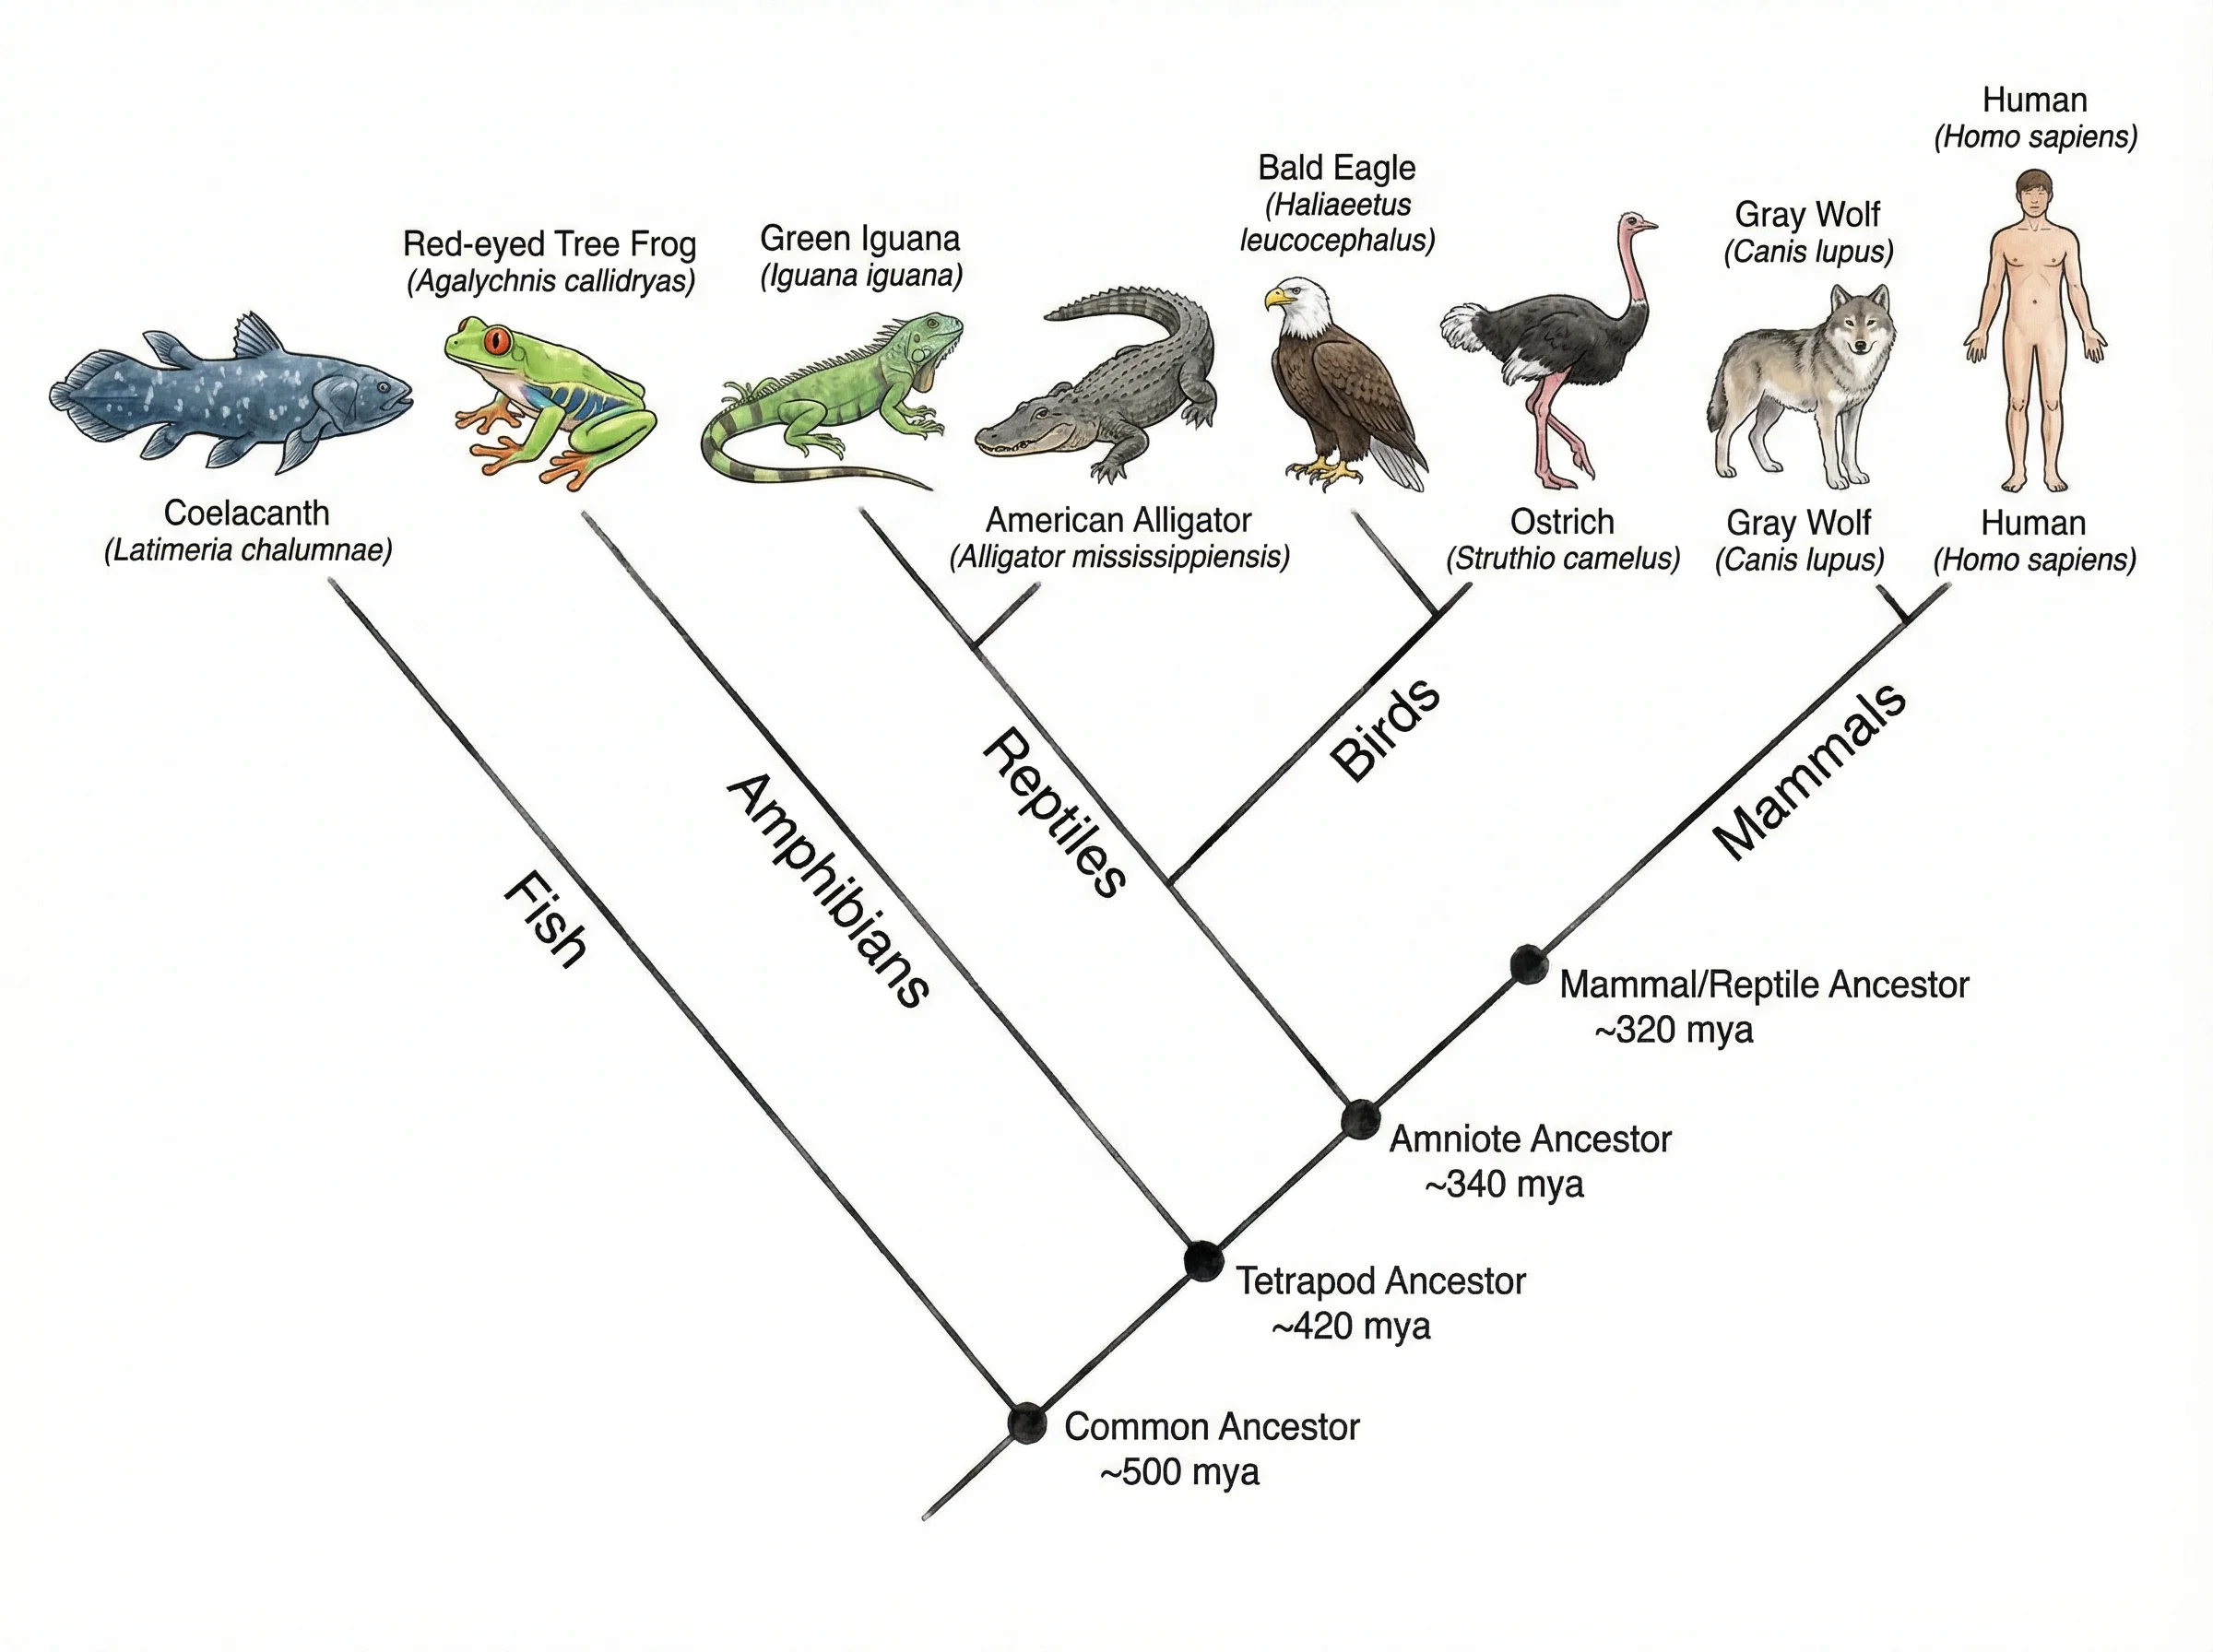 A phylogenetic tree illustrating evolutionary divergence among species, with branch lengths representing evolutionary distance.
When to use it:
- Evolutionary biology and comparative genomics
- Molecular phylogenetics (analyzing DNA, RNA, or protein sequences)
- Epidemiology (tracking pathogen evolution and outbreak origins)
- Linguistic analysis (tracing language family relationships)
- Historical manuscript analysis (stemmatology)
How it works: Phylogenetic trees are constructed from observational data -- typically DNA sequences, morphological traits, or protein structures. Algorithms like neighbor-joining, maximum parsimony, maximum likelihood, and Bayesian inference are used to infer the most probable tree topology. The root represents the most recent common ancestor of all species in the tree. Internal nodes represent hypothetical ancestors, while leaf nodes represent extant (living) or sampled organisms.
How to Create a Tree Diagram: Step-by-Step
Whether you are building a probability tree for a homework problem or designing an organizational chart for a research proposal, the process follows the same fundamental steps.
Step 1: Define the Purpose and Scope
Before drawing anything, clarify what your tree diagram needs to communicate:
- What type of tree? Probability, decision, hierarchy, classification, or phylogenetic?
- What is the root? The starting event, top-level category, or initial decision.
- How deep should the tree go? Two levels? Five? Determine the number of branching stages.
- Who is the audience? A statistics professor expects probability labels; a board of directors expects clean, labeled org charts.
Step 2: Identify the Root Node
The root is the foundation of your entire tree. Write it down explicitly:
- For a probability tree: "A bag contains 4 red and 6 blue marbles. Two are drawn without replacement."
- For a decision tree: "Should we expand into Market A or Market B?"
- For an org chart: "University President"
- For a taxonomy: "Kingdom Animalia"
Step 3: Determine Branches at Each Level
Work level by level, starting from the root:
- List all possible outcomes, choices, or subcategories that branch from the root.
- For each of those nodes, list their branches.
- Continue until you reach the terminal nodes (final outcomes or leaf categories).
Tip: For probability trees, ensure that branches at each node are mutually exclusive and collectively exhaustive (they cover all possibilities and do not overlap).
Step 4: Label Every Branch and Node
Clear labeling is what separates a useful tree diagram from a confusing one:
- Probability trees: Label each branch with its probability (as a fraction, decimal, or percentage). Label leaf nodes with the compound outcome (e.g., "Red, then Blue") and its calculated probability.
- Decision trees: Label decision branches with the choice name and chance branches with the outcome and its probability. Include payoff values at leaf nodes.
- Org charts: Label each node with the person's name, title, and optionally their department or team.
- Taxonomy trees: Label each node with the taxon name and rank.
Step 5: Calculate Values (if applicable)
For probability and decision trees, computation is a critical step:
- Probability trees: Multiply probabilities along each path to get the probability of that specific outcome. Sum probabilities across all paths that satisfy a condition to find the probability of that condition.
- Decision trees: Calculate expected values by multiplying each outcome's payoff by its probability and summing across branches. Choose the decision with the highest expected value.
Step 6: Review and Refine
Before finalizing your tree diagram:
- Verify that probabilities at each node sum to 1
- Check that all possible outcomes are included (no missing branches)
- Ensure labels are clear and unambiguous
- Confirm the tree is readable -- adjust spacing and layout if branches overlap or crowd each other
- Have someone else review it for clarity
For professional or publication-quality results, consider using a dedicated diagramming tool rather than drawing by hand. AI-powered tools like the Tree Diagram Generator can create polished diagrams from a text description in seconds.
Tree Diagram Examples
Example 1: Probability -- Flipping a Coin Twice
Problem: What is the probability of getting exactly one head when flipping a fair coin twice?
                    Coin Flip
                       |
              ┌────────┴────────┐
           H (0.5)           T (0.5)
              |                  |
        ┌─────┴─────┐     ┌─────┴─────┐
     H (0.5)     T (0.5) H (0.5)    T (0.5)
       |           |       |           |
     HH          HT      TH          TT
   (0.25)      (0.25)  (0.25)      (0.25)
Solution: The paths with exactly one head are HT (0.25) and TH (0.25). Adding these: 0.25 + 0.25 = 0.50. There is a 50% probability of getting exactly one head.
Example 2: Decision Tree -- Product Launch Strategy
Problem: A company must decide between launching Product A (low cost, moderate demand) or Product B (high cost, uncertain demand). Use a decision tree to find the better option.
                    Launch Decision
                         |
              ┌──────────┴──────────┐
          Product A              Product B
              |                      |
        ┌─────┴─────┐         ┌─────┴─────┐
   High Demand   Low Demand  High Demand  Low Demand
    (0.6)         (0.4)       (0.4)        (0.6)
      |             |           |            |
   $500K         $200K       $900K        -$100K
Expected values:
- Product A: (0.6 x $500K) + (0.4 x $200K) = $300K + $80K = $380K
- Product B: (0.4 x $900K) + (0.6 x -$100K) = $360K - $60K = $300K
Decision: Product A has the higher expected value ($380K vs. $300K), making it the rational choice under expected value maximization.
Example 3: Taxonomy -- Classifying a Domestic Cat
Domain: Eukarya
  └── Kingdom: Animalia
        └── Phylum: Chordata
              └── Class: Mammalia
                    └── Order: Carnivora
                          └── Family: Felidae
                                └── Genus: Felis
                                      └── Species: F. catus (Domestic Cat)
This single-path traversal of the taxonomic tree shows exactly where the domestic cat sits within the tree of life. At each level, the cat shares its branch with related organisms -- Felidae includes lions, tigers, and leopards; Carnivora includes dogs, bears, and seals.
Example 4: Organizational Hierarchy -- Research Lab
Lab Director (Prof. Chen)
  ├── Principal Investigator: Genomics (Dr. Park)
  │     ├── Postdoc: Bioinformatics (Dr. Liu)
  │     ├── PhD Student (Maria)
  │     └── Lab Technician (James)
  ├── Principal Investigator: Proteomics (Dr. Singh)
  │     ├── Postdoc: Mass Spec (Dr. Novak)
  │     ├── PhD Student (Kenji)
  │     └── PhD Student (Amara)
  └── Lab Manager (Taylor)
        ├── Equipment Specialist (Jordan)
        └── Admin Assistant (Casey)
This org chart makes reporting relationships immediately clear. Every person knows who they report to, and the lab director can see the entire team structure at a glance.
Tree Diagrams vs Other Diagram Types
Tree diagrams are sometimes confused with related visualization types. Here is how they compare:
| Feature | Tree Diagram | Flowchart | Mind Map | Org Chart | Venn Diagram |
|---|---|---|---|---|---|
| Structure | Hierarchical (one root, no cycles) | Sequential (start to end, may have loops) | Radial (central topic, free-form branches) | Hierarchical (same as tree) | Overlapping circles |
| Direction | Top-down or left-right | Usually top-down or left-right | Radiates outward | Top-down | No inherent direction |
| Shows | All possible outcomes, categories, or relationships | Step-by-step processes and decisions | Ideas and associations | Reporting relationships | Set relationships and overlaps |
| Cycles allowed? | No | Yes (loops and feedback) | No (but flexible linking) | No | N/A |
| Best for | Probability, classification, decisions | Workflows, algorithms, procedures | Brainstorming, note-taking | Company/team structure | Comparing groups |
| Data type | Hierarchical | Sequential/procedural | Associative | Hierarchical | Categorical |
Key distinctions:
-
Tree diagram vs flowchart: Flowcharts model processes with steps, conditions, and loops. Tree diagrams model hierarchies with no cycles. A decision tree may look like a flowchart, but it never loops back -- every path moves forward from root to leaf. Learn more about process diagramming in our guide to creating diagrams for research papers.
-
Tree diagram vs mind map: Mind maps radiate freely from a central topic without strict hierarchical rules. Tree diagrams enforce a rigid parent-child structure. Mind maps are better for brainstorming; tree diagrams are better for exhaustive enumeration of possibilities.
-
Tree diagram vs org chart: An org chart is actually a specific type of tree diagram. All org charts are tree diagrams, but not all tree diagrams are org charts. The term "org chart" implies the nodes represent people or departments with reporting relationships.
For a comprehensive comparison of diagramming tools, see our best free diagram software comparison guide.
Best Practices for Creating Effective Tree Diagrams
1. Start Simple and Expand
Begin with the first two levels of your tree, verify correctness, and then add deeper levels. Trying to draw the entire tree at once often leads to errors and messy layouts. This incremental approach is especially important for probability trees where a single mislabeled branch propagates errors through all calculations.
2. Maintain Consistent Spacing and Alignment
Nodes at the same level should be aligned horizontally (in a top-down tree) or vertically (in a left-right tree). Consistent spacing between branches prevents visual clutter and makes the hierarchy immediately apparent. Digital tools handle this automatically; for hand-drawn trees, use graph paper or guidelines.
3. Use Color and Visual Hierarchy Strategically
Color can dramatically improve readability when used purposefully:
- Use different colors for different branches or categories
- Highlight the optimal path in a decision tree with a bold color
- Use muted colors for low-probability paths and bold colors for high-probability paths
- Keep the color palette accessible -- avoid red-green combinations that are difficult for colorblind readers
For guidance on selecting effective color schemes, see our research data visualization best practices guide.
4. Label Everything Explicitly
Never assume the reader will infer labels. Every branch should have a label (probability, decision name, category). Every node should be clearly identified. In probability trees, include both the individual branch probability and the cumulative path probability at each leaf.
5. Control Tree Depth and Width
Trees that are too deep (many levels) become hard to follow. Trees that are too wide (many branches per node) become visually overwhelming. If your tree exceeds five levels, consider:
- Breaking it into multiple sub-trees
- Collapsing less important branches with a summary node
- Using a table or list for the detailed data and the tree for the overview
6. Choose the Right Orientation
- Top-down works best for organizational hierarchies, classification trees, and decision trees where the reader naturally reads from top to bottom.
- Left-to-right works well for probability trees and process-oriented trees where sequential flow matters.
- Bottom-up is sometimes used for phylogenetic trees where the root represents the most ancient ancestor.
Choose the orientation that best matches your audience's expectations and the type of data being presented. For more diagram design advice, see our mapping diagram complete guide.
Frequently Asked Questions
What is the difference between a tree diagram and a flowchart?
A tree diagram represents hierarchical relationships that branch outward from a single root with no cycles -- every path moves forward from root to leaf. A flowchart models sequential processes with steps, conditions, decision points, and potentially loops or feedback. While a decision tree may resemble a flowchart, it never loops back on itself. Use a tree diagram when you need to show all possible outcomes or categories; use a flowchart when you need to show a step-by-step process.
How do you calculate probability with a tree diagram?
To calculate probability with a tree diagram, follow two rules: (1) Multiply the probabilities along a single path from root to leaf to find the probability of that specific outcome sequence. (2) Add the probabilities of all paths that satisfy your condition to find the total probability of that event. For example, if you flip a coin twice, the probability of getting exactly one head is P(HT) + P(TH) = (0.5 x 0.5) + (0.5 x 0.5) = 0.50.
Can tree diagrams have more than two branches?
Yes, tree diagrams can have any number of branches from each node. A binary tree has at most two branches per node, but most real-world tree diagrams have variable branching. A probability tree for rolling a die would have six branches from each node. An organizational chart might show a manager with three, five, or ten direct reports. The number of branches depends on the number of possible outcomes, choices, or subcategories at each point.
What is the difference between a tree diagram and a mind map?
A tree diagram has a rigid hierarchical structure with a single root, defined levels, and strict parent-child relationships -- it is designed to exhaustively enumerate all possibilities or categories. A mind map radiates freely from a central topic with flexible, non-hierarchical connections and is designed for brainstorming and creative association. Tree diagrams are precise and analytical; mind maps are exploratory and informal.
How many levels should a tree diagram have?
Most effective tree diagrams have between two and five levels. Two levels are sufficient for simple probability problems or flat hierarchies. Three to four levels work well for decision trees and organizational charts. Beyond five levels, tree diagrams become difficult to read and should be broken into sub-trees or supplemented with tables. The ideal depth depends on the complexity of your data and the clarity needed for your audience.
What tools can I use to create tree diagrams?
You can create tree diagrams with general diagramming tools like draw.io (diagrams.net), Lucidchart, or Microsoft Visio. For probability and decision trees, specialized tools like TreePlan (Excel add-in) or R/Python libraries (rpart, scikit-learn) are available. For quick, professional results without design skills, AI-powered tools like ConceptViz's Tree Diagram Generator let you describe your tree in plain text and generate a publication-ready diagram in seconds.
Conclusion
Tree diagrams are a fundamental visualization tool that appears across nearly every discipline -- from probability calculations in statistics to evolutionary biology, from corporate organizational charts to machine learning classifiers. Their branching structure makes complex hierarchical relationships and sequential outcomes intuitively accessible, and their strict acyclic nature ensures that every path through the diagram tells a clear, unambiguous story.
The key to creating effective tree diagrams is matching the right type of tree to your specific need:
- Probability trees for calculating compound event likelihoods
- Decision trees for evaluating choices under uncertainty
- Organizational trees for displaying reporting structures and hierarchies
- Classification trees for categorizing items into taxonomic groups
- Phylogenetic trees for mapping evolutionary relationships
Regardless of the type, the principles remain the same: start from a clearly defined root, branch systematically at each level, label every node and edge explicitly, and verify that your tree is both complete (no missing branches) and correct (accurate labels and calculations).
If you need to create a tree diagram quickly without spending time on layout and formatting, try our AI-powered generator -- describe your hierarchy or decision in plain language and get a professional diagram in seconds.
Tree Diagram Generator
Skip the manual drawing. Describe your tree structure and get a professional diagram instantly.
Additional Resources
Categories
More Posts

Scientific Illustration Guide 2026: Types, Tools & How to Get Started
What is scientific illustration? Learn the types (botanical, medical, technical), best tools (free & paid), and how to create effective scientific visuals. With career tips.
")
Free Printable Cell Diagram Worksheets: Unlabeled & Labeled (2026)
Download free printable cell diagram worksheets. Includes unlabeled plant cell, animal cell, and comparison diagrams for classroom quizzes and study guides.
")
How to Make a Pie Chart in Google Sheets: Step-by-Step Guide (2026)
Learn how to create a pie chart in Google Sheets, summarize messy data, format labels, customize slices, and avoid misleading charts. Includes official Google Docs Editors Help references.