AI驱动设计
AI信息图生成器 创建精美可视化图表
描述您的信息图创意,让AI创建专业的可视化设计。适用于数据可视化、流程说明等多种场景。
描述即生成多种风格高分辨率可商用
AI信息图生成器
描述您的信息图
免费试用 ·
预览
您的信息图将显示在这里
描述您的信息图并点击「生成」
信息图示例
浏览不同的信息图风格,或在上方生成您自己的作品
视图:
SaaS市场分析
基于数据的市场分析信息图,展示行业统计数据和趋势。
market-analysisSaaSbusiness
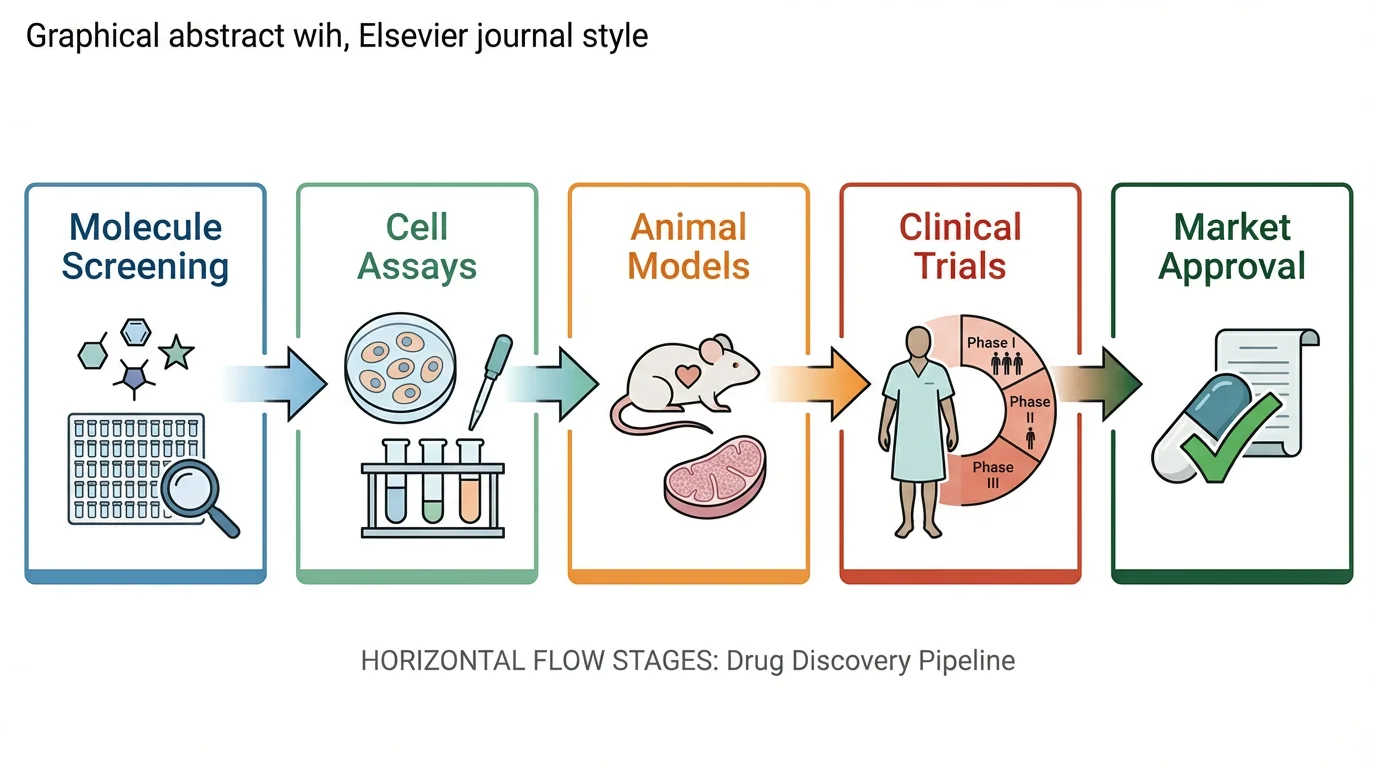
机器学习流水线
包含数据处理和模型训练各阶段的ML工作流技术信息图。
machine-learningAItechnical
可再生能源对比
太阳能、风能、水能和地热能的多维度对比。
comparisonenergyenvironment
创业融资历程
包含估值和股权稀释数据的融资里程碑时间线。
timelinestartupfunding
网络安全框架
包含威胁统计数据的全面安全框架可视化。
cybersecurityframeworktechnical
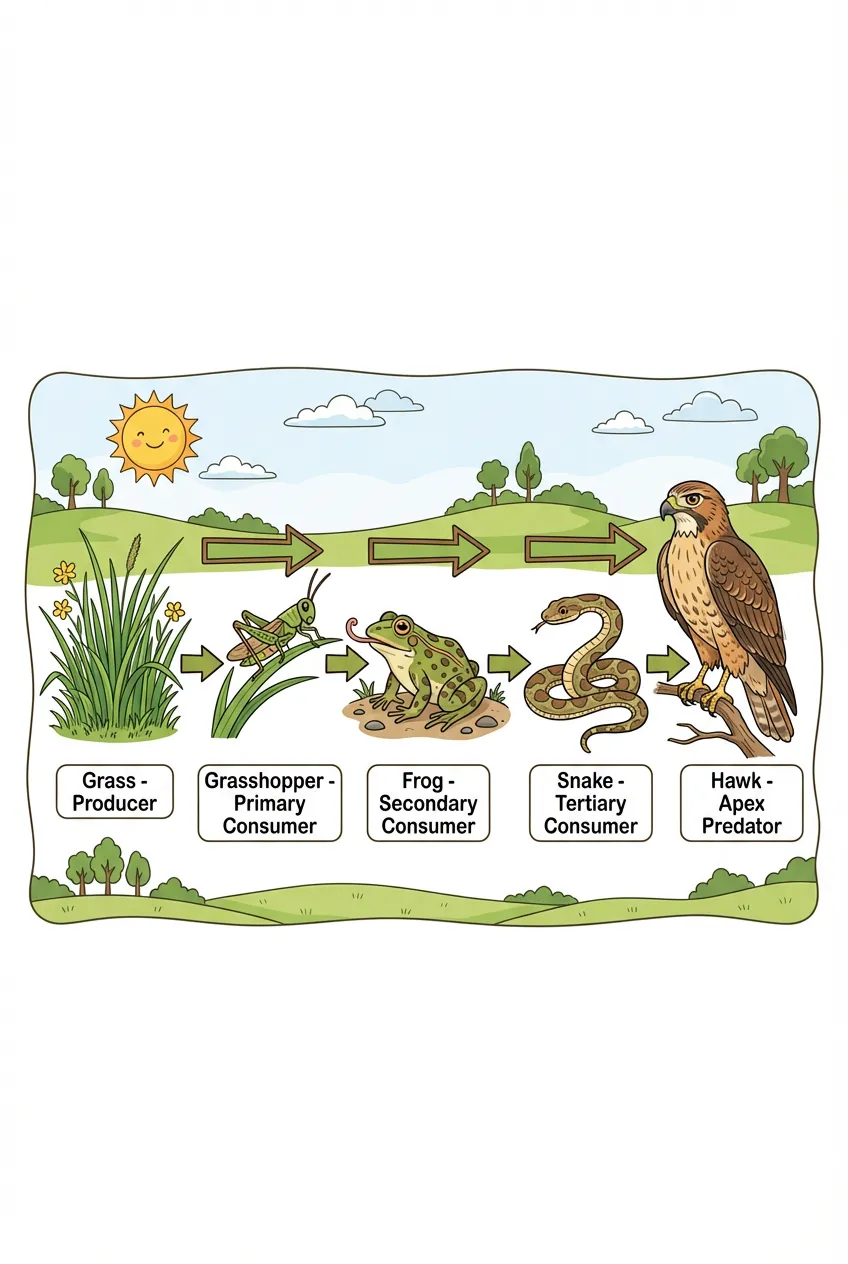
气候变化影响
包含排放源和级联效应的气候科学教育信息图。
climatescienceeducational
什么是信息图?
信息图是一种将信息、数据或知识进行可视化呈现的方式,旨在快速清晰地传达复杂信息。信息图将图形、图表和精简文字相结合,以引人入胜、易于理解的形式讲述故事或解释概念。
为什么要用AI创建信息图?
- 节省大量设计时间——几分钟内创建专业信息图
- 无需设计技能——AI自动处理布局、配色和构图
- 品质稳定——每张信息图都精致专业
- 创意无限——为任何主题生成独特设计
- 经济实惠——简单的信息图需求无需聘请设计师
信息图的最佳用途
信息图非常适合用于展示统计数据、解释流程、对比选项、展示时间线、列举技巧或事实,以及简化复杂的教育内容。它们在社交媒体帖子、博客内容、演示文稿、报告和营销材料中效果出色。
您可以创建的信息图类型
- 统计信息图——图表、图形和数据可视化
- 流程信息图——分步工作流程和操作步骤
- 对比信息图——特性或选项的并排对比
- 时间线信息图——历史事件、路线图、项目阶段
- 列表信息图——编号的技巧、事实或要点
- 教育信息图——概念解释和操作指南